Differentiate or Die: 3-Bromopyruvate and
Pluripotency in Mouse Embryonic Stem Cells
Ana Sofia Rodrigues1,2, Sandro L. Pereira2, Marcelo Correia1,2,3, Andreia Gomes1,3,4,
Tânia Perestrelo1,2,3, João Ramalho-Santos2,5*
1PhD Programme in Experimental Biology and Biomedicine, CNC—Center for Neuroscience and Cell Biology, University of Coimbra, Coimbra, Portugal,2CNC—Center for Neuroscience and Cell Biology, University of Coimbra, Coimbra, Portugal,3Institute for Interdisciplinary Research (IIIUC), University of Coimbra, Coimbra, Portugal,4Biocant—Center of Innovation in Biotechnology, Cantanhede, Portugal,
5Department of Life Sciences, University of Coimbra, Coimbra, Portugal
Abstract
Background
Pluripotent embryonic stem cells grown under standard conditions (ESC) have a markedly glycolytic profile, which is shared with many different types of cancer cells. Thus, some ther-apeutic strategies suggest that pharmacologically shifting cancer cells towards an oxidative phenotype, using glycolysis inhibitors, may reduce cancer aggressiveness. Given the meta-bolic parallels between cancer and stemness would chemotherapeutical agents have an effect on pluripotency, and could a strategy involving these agents be envisioned to modu-late stem cell fate in an accessible manner? In this manuscript we attempted to determine the effects of 3-bromopyruvate (3BrP) in pluripotency. Although it has other intracellular tar-gets, this compound is a potent inhibitor of glycolysis enzymes thought to be important to maintain a glycolytic profile. The goal was also to determine if we could contribute towards a pharmacologically accessible metabolic strategy to influence cell differentiation.
Methodology/Principal Findings
Mouse embryonic stem cells (mESC) grown under standard pluripotency conditions (in the presence of Leukemia Inducing Factor- LIF) were treated with 3BrP. As a positive control for differentiation other mESCs were grown without LIF. Overall our results demonstrate that 3BrP negatively affects pluripotency, forcing cells to become less glycolytic and with more active mitochondria. These changes in metabolism are correlated with increased dif-ferentiation, even under pluripotency conditions (i.e. in the presence of LIF). However, 3BrP also significantly impaired cell function, and may have other roles besides affecting the met-abolic profile of mESCs.
Conclusions/Findings
Treatment of mESCs with 3BrP triggered a metabolic switch and loss of pluripotency, even in the presence of LIF. Interestingly, the positive control for differentiation allowed for a
a11111
OPEN ACCESS
Citation:Rodrigues AS, Pereira SL, Correia M, Gomes A, Perestrelo T, Ramalho-Santos J (2015) Differentiate or Die: 3-Bromopyruvate and Pluripotency in Mouse Embryonic Stem Cells. PLoS ONE 10(8): e0135617. doi:10.1371/journal. pone.0135617
Editor:Johnson Rajasingh, University of Kansas Medical Center, UNITED STATES
Received:April 17, 2015
Accepted:July 24, 2015
Published:August 12, 2015
Copyright:© 2015 Rodrigues et al. This is an open access article distributed under the terms of the
Creative Commons Attribution License, which permits unrestricted use, distribution, and reproduction in any medium, provided the original author and source are credited.
Data Availability Statement:All relevant data are within the paper and its Supporting Information files.
distinction between 3BrP effects and changes associated with spontaneous differentiation/ loss of pluripotency in the absence of LIF. Additionally, there was a slight differentiation bias towards mesoderm in the presence of 3BrP. However, the side effects on cellular function suggest that the use of this drug is probably not adequate to efficiently push cells towards specific differentiation fates.
Introduction
Embryonic stem cells (ESC) rely more on glycolysis and have few immature mitochondria, localized mainly around the nucleus [1–3]. Furthermore, although there may be a metabolically bivalent metabolic state early in cell commitment a shift from glycolysis to a predominantly oxidative metabolism (OXPHOS) is needed for differentiation to take place [4–6]. Indeed, low O2tension and“silent”/quiescent mitochondria are beneficial for pluripotency, which is also boosted by mitochondrial inhibition [7,8]. Moreover, the activation of the internal pluripo-tency network in induced pluripotent stem cells (iPSC) during somatic cell reprogramming is preceded by a prior metabolic shift towards glycolysis [9], and the modulation of the pentose phosphate pathway leads to a biased differentiation [10].
Importantly, the metabolic characteristics of pluripotent stem cells (PSCs) are common to proliferative cells in general, and thus similar to some types of cancer cells. Common metabolic strategies between cancer and stemness include high levels of hexokinase II (HKII) linked to the outer mitochondrial membrane and a pyruvate dehydrogenase (PDH) cycle promoting the conversion of pyruvate to lactate rather than to acetyl-CoA [11]. Hexokinase is a key glycolytic enzyme that phosphorylates glucose to glucose 6-phosphate (G-6-P), and thus trapping it inside the cell. Certain tumor cells upregulate HKII expression due to its higher affinity for glu-cose and its privileged location in the outer mitochondrial membrane [12]. Depletion of HKII in tumor cells increases sensitivity to cell death [13] and HKII inhibits aerobic glycolysis, lead-ing to an increase in OXPHOS [14]. Of course other key metabolic players should be consid-ered, such as Hypoxia inducible factor-1alpha (HIF-1a) and c-Myc [7,15–17]. In fact, tumor aggressiveness and progression have been shown to positively correlate with a hypoxic micro-environment due to a high activity of HIF-1a and c-Myc [18,19] enhancing the transcription of genes coding for glycolytic enzymes and other important signaling pathways that help pro-mote aerobic glycolysis, or the Warburg effect [15,17,20].
Taken together these data suggest that pharmacological strategies linked to the targeting of metabolic characteristics that define active cancer cells may also be useful in modulating plu-ripotent stem cell fate. Although it may also have other targets, 3-brompyruvate (3BrP) is a chemical pyruvate analog that functions as a potent inhibitor of glycolytic enzymes, most nota-bly, but not exclusively, HKII [21,22]. Importantly 3BrP has been used as an anti-cancer drug, including in clinical trials, and shown to induce cell death and thus reducing tumor size [2,23,
24]. However, the exact mechanism by which this compound acts as an anti-tumor drug, is not completely known, although 3BrP treatment alters mitochondrial function in terms of both reactive oxygen species (ROS) and ATP production [25].
Given that ESCs are also highly proliferative, and share some common features with tumor cells, we wondered if 3BrP would also affect ESC pluripotency and could, in addition, be used as a practical and inexpensive tool to modulate stem cell fate by promoting differentiation by inducing a metabolic glycolysis-OXPHOS shift. The goal of the present work was not to deter-mine the importance of specific glycolysis enzymes towards the maintenance of pluripotency, (CNC) funding is also supported by FCT (PEst-C/
SAU/LA0001/2011). The funders had no role in study design, data collection and analysis, decision to publish, or preparation of the manuscript.
for which a totally different experimental approach would be necessary, but rather to establish if the specific compound 3BrP could be a viable alternative for cell culture metabolic modula-tion in order to obtain specific cell lineages.
Material and Methods
Cell culture conditions and Experimental design for 3-Bromopyruvate
(3BrP)
Mouse embryonic stem cell line E14Tg2a was kindly provided by Miguel Ramalho-Santos (University of California, San Francisco, USA) and characterized elsewhere [26,27]. Cells were maintained in feeder free conditions using Knockout-DMEM media (Gibco Life Technologies) supplemented with 15% of KSR (Knockout serum replacement—Gibco LIFe Technologies), 1% of MEM Non-Essential Amino acids (Sigma-Aldrich), 1% Penicillin/Streptomycin, 1% L-glutamine (2mM) (both from Gibco LIFe Technologies) andβ-Mercaptoethanol (Sigma-Aldrich). In order to maintain pluripotency Leukemia inhibitor factor (LIF; ESGRO Millipore) was added to a working concentration of 1000U/ml. Media was changed every 24h and cells were maintained at 37°C, 20%O2and 5% CO2. E14Tg2a mESC were passaged when the right confluence was achieved, usually two or three days after platting. Briefly, 0.1% gelatin (Sigma-Aldrich) was added to plates and allowed to coat for ten minutes at 37°C. Afterwards, the excess was removed and supplemented Knockout-DMEM media was added. Cells were plated at a final density of 5000cells/cm for all experimental conditions: ESCs in control conditions (with LIF), in the absence of LIF (differentiation control) and in the presence of two different 3BrP (Sigma-Aldrich) concentrations (25 and 50μM) plus LIF. 3BrP was freshly prepared and
added every 24hours and experiments were conducted after 60h of incubation with 3BrP+LIF or in the absence of LIF. It is important to stress that all 3BrP experiments were carried out under strict pluripotency conditions (i.e. in the presence of LIF) in order to determine if this glycolytic inhibitor pushed the cells towards differentiation even under pluripotency condi-tions. Thus 3BrP experiments were compared to ESCs cultured with (pluripotency control) or without (differentiation control) LIF. The exception was the embryoid body experiments, spe-cific for differentiation, as noted below.
Viability
In order to monitor cell viability the LIVE/DEAD Kit (Invitrogen) was used according to man-ufacturers’instructions. The Kit consists of two DNA binding fluorescent dyes: SYBR 14 which is membrane permeable staining the nucleus green for all cells, and PI (propidium iodide). PI only enters cells with compromised membrane integrity, thus staining the nucleus of dead cells red. Briefly, cells were collected at the 60h time point by enzymatic dissociation with accutase (Gibco LIFe Technologies), and centrifuged for 5 min at 1200rpm. The pellet was ressuspended in D-PBS and 6μM of SYBR 14 and 0.48mM of PI were added to the cell suspension that was
then incubated for 20 min at 37°C, 20%O2and 5% CO2. Viability was assessed counting 100 cells per condition; green fluorescent cells without red fluorescence were counted as live cells and a cell with both stains as dead cells using a fluorescent microscope.
Thiazolyl Blue Tetrazolium Bromide (MTT) assay
crystals that are soluble in acidified isopropanol [28]. Cells were plated and incubated for 60h and media was changed so that the assay did not take place in the presence of 3BrP. Formazan crystals (violet) formed after a 5 h incubation at 37°C, 20%O2and 5% CO2and were solubilized with 300μl of isopropanol with 0.04M HCl. Intensity was measured colorimetrically at 570
nm. Raw data was normalized to total cell number for each condition and then metabolic activ-ity was normalized to the control.
Alkaline phosphatase (AP) assay
It is well accepted that stem cells that are self-renewing and pluripotent present high levels of AP [29]. The Alkaline Phosphatase Detection Kit from Millipore was used for each experimen-tal condition following the manufacturers’instructions. Briefly, cells were cultured in a 24 well plate for 60h, media was removed and cells were fixed with 4% paraformaldehyde for 1 min. Cells were washed and the alkaline phosphatase reagent (prepared according to the manufac-turers’instructions) was added. After a 20 min incubation at room temperature (RT) in the dark the reagent was removed and D-PBS was added. Colonies were counted using an optical microscope; red colonies were considered AP positive while unstained colonies were counted as AP negative. All colonies in the 24 wells were counted and counts normalized to 100%. Experiments were performed in duplicate for all experimental conditions.
Flow cytometry
All dyes noted below were analyzed by flow cytometry (BD FACSCalibur) and 20000 gated cells were acquired/analyzed per condition with the Cell Quest Pro Acquisition software (BD Biosciences).
Mitochondrial membrane potential (MMP) was monitored using tetramethylrhodamine methyl (TMRM-Invitrogen) [30–32] a lipophilic cationic fluorescent dye that, due to its posi-tive charge, accumulates in mitochondria according to membrane potential. Cells were incu-bated with 20μM of TMRM for 20 min at 37°C, 20%O2and 5% CO2in the dark in 1ml of
D-PBS. Afterwards cells were centrifuged to remove excess TMRM and pellets were ressus-pended with 500μl of PBS, kept on ice and analyzed. In order to define the proper gates for an
accurate analysis we used cells without TMRM as a blank control and TMRM labeled cells incubated with 250μM of CCCP, a potent mitochondrial uncoupler, as a negative control.
To evaluate intracellular amounts of superoxide anion we used MitoSOX Red (Molecular Probes) that emits fluorescence after selectively reacting with superoxide in mitochondria. MitoSOX Red was prepared according to the manufacturers’instructions and cells were incu-bated for 30 min at 37°C in the dark with a final concentration of 3μM of the probe. To
prop-erly define the analysis gates we used cells without the probe as a negative control and cells that were incubated with Antimycin A (100μM) as a positive control, given that this potent
mito-chondrial complex III inhibitor acts as a ROS inducer [33–35].
To infer effects on cell proliferation we examined the expression of the proliferating cell nuclear antigen (PCNA), given its role in DNA replication and repair, and that it is highly expressed in rapidly proliferating cells [36]. Cells were fixed with 70% ethanol and stored over-night at -20°C, then subjected to an acidic denaturation step with 2N HCl and washed. After-wards cells were incubated for 1h with primary antibody against PCNA (1:100), washed with D-PBS and FITC-conjugated secondary antibody was added (1:100) for 1h in the dark [37]. As negative controls we used cells without antibodies (to access auto-fluorescence), as well as cells incubated only with the primary antibody and cells incubated only with the secondary antibody.
Adenine nucleotide content analysis by High Performance liquid
chromatography (HPLC)
The protocol for adenine nucleotide content analysis was as previously described [11]. Samples were stored at -80°C until assayed by separation in a reverse-phase HPLC using a Beckman-System Gold. The detection wavelength was 254 nm, and the column used was a LiChrospher 100 RP-18 (5μM, Merck). The elution buffer was composed by 100mM phosphate buffer (pH
6.5) and supplemented with 1% methanol. Retention times were determined using standards for ATP, ADP and AMP (Sigma-Aldrich): Adenylate Energy Charge was calculated according to the following formula: ATP+0.5xADP/(ATP+ADP+AMP) [38,39].
Total RNA isolation, DNA cleanup, cDNA synthesis and RT-PCR
RNA isolation and DNA cleanup was performed as described previously [40]. RNA concentra-tion and quality were determined using NanoDrop 2000 (Thermo Scientific) and samples pre-senting a 260/280 ratio under 1.8 were discarded. Samples of total RNA were stored at -80°C until use [40]. cDNA was obtained using the iScript cDNA Synthesis Kit from Bio Rad accord-ing to the protocol established by the manufacturer. Samples were then placed in the thermal cycler (S1000 Thermal Cycler) programmed with a reaction protocol provided by the manufac-turer. RT-PCR was performed to quantify gene expression for OCT4; NANOG; GAPDH; HEXOKINASEII AND HEXOKINASEI with BETA-Actin used as housekeeping gene for data normalization. Primers are described inS1 Tableand were obtained from a primer bank data-base (http://pga.mgh.harvard.edu/primerbank/) and ordered from Integrated DNA Technolo-gies (IDT). SsoFast EvaGreen Supermix (Bio-Rad) was used to perform RT-PCR analysis according with Bio-Rad instructions. Samples were run in CFX96 Touch Real-Time PCR Detection System and mRNA fold change was calculated using the -ΔΔCt method.
Total Protein Extracts, protein quantification and Western Blot
In order to obtain protein extracts for Western blot analysis mESC were lysed with 100μl of
RIPA buffer (Sigma-Aldrich) supplemented with 2mM of phenylmethylsulphonyl fluoride-PMSF (Sigma-Aldrich) and 2x Halt phosphatase inhibitor cocktail (Pierce, Rockford, IL) as described elsewhere [11]. Protein quantification was performed using the Pierce BCA (Bicinch-oninic Acid) Protein Assay Kit, following the datasheet protocol. Both samples and calibration curve were determined with duplicates.
Protein samples for Western blot were prepared by diluting 30μg of protein in Laemmli
sample buffer (Bio-Rad) and water, given that the volume of sample buffer had to contain 30μg
of protein (water was used to adjust the volume). A total volume of 30μl per sample was
VersaDoc Imaging system (Bio-Rad). Protein quantification was performed using Quantity One software and results were normalized to beta-Actin levels for each condition.
Embryoid Body (EB) formation
To promote and monitor ESC differentiation the EB assay was used. mESCs were platted in a 60mm non-adherent petri dish at a cellular density equal to one million cells and were left for three days in a 37°C, 5% CO2 incubator with KODMEM without LIF supplementation in order to form EB. Cell media was changed during this period by gentle aspiration of the non-adherent dishes into falcons and allowing the cells to sediment. At day 3 KODMEM media was supplemented with 10% FBS and EB were transferred into new normal gelatin coated 100mm dishes. EBs were incubated overnight in a 37°C, 5% CO2 incubator to allow them to attach to the dish. From that day on EB were grown with basic DMEM media with no serum supple-mentation and media changed every other day. At day 14 EBs were collected for protein isola-tion. In this case 3BrP experiments were carried out in the absence of LIF, as the goals was to see if the drug created a differentiation bias. Therefore there is only one control in this case (EB formation without 3BrP), unlike what took place in the pluripotency experiments mentioned earlier.
Statistical Analysis
SPSS Statistics 21.0 (SPSS Inc.) was used to perform statistical analysis. All the raw data was verified for normality and homoscedasticity and accordingly the appropriate parametric tests for paired samples were applied. Given that all the experimental conditions were collected/ana-lyzed at the same time a repeated measure ANOVA was used. Sphericity was assessed and, when violated, the Greenhouse-Geisser correction was applied before performing any POST--HOC tests. When data violated the normal distribution assumption a Friedman ANOVA was performed. All data is expressed as mean ± standard error of mean (SEM) reflecting the num-ber of experiments. Statistical significance was determined at p0.05.
Results
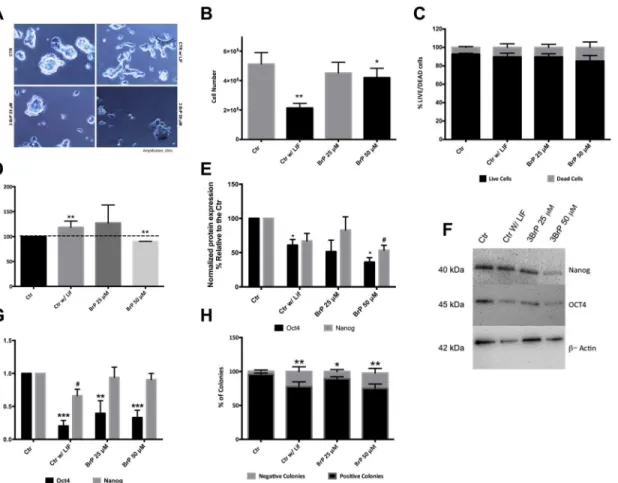
cytometry (Fig 1D). Results for 50μM 3BrP showed a significant decrease in cell proliferation
(p<0.01), which could explain the decrease in cell number, and the fact that colonies are
smaller under these conditions. However, and in contrast, an increase in PCNA levels was seen in the negative control (p<0.01).
Does 3BrP affect pluripotency in the presence of LIF? To address this issue pluripotency was first monitored by analyzing gene expression and protein levels for two of the major regu-lators of the pluripotency network: Oct4 and Nanog. Both Western Blot (Fig 1E and 1F) and RT-PCR (Fig 1G) show a tendency for a negative effect of 3BrP on pluripotency in the presence of LIF, notably for Oct4. At the protein level the most deleterious effect occurred for 50μM
3BrP where both Oct4 and Nanog levels were significantly decreased (p<0.05). Interestingly,
the 3BrP-induced negative effect on pluripotency is greater in terms of mRNA levels for Oct4. As expected, our negative control (cells grown without LIF) had decreased protein and mRNA Fig 1. Effect of 3BrP on morphology, cell number, viability, proliferation and pluripotency.ESCs were maintained in control conditions (with LIF), in the absence of LIF (differentiation control) and in the presence of two different 3BrP concentrations (25 and 50μM) plus LIF.A)Phase microscopy photographs
of the colonies in all conditions with a magnification of 200x.B)Total number of cells counted upon collection for ATP and flow cytometry experiments.C)
Percentage of viableversusdead cells. Cells stained green were counted as live, while PI positive cells were counted as dead. 100 cells were counted per condition for a total of n = 8 independent experiments, results are expressed as means±SEM for 30 experiments.D)- Cells in all experimental conditions
were stained for PCNA in the cell nucleus and protein levels were assessed by flow cytometry. Results were analyzed in terms of Geometric Mean of Fluorescence for 20000 cells for each condition and are represented as percentage relative to the control; 4 independent experiments were performed.E) -Western Blot quantification by densiometric evaluation for Oct4 and Nanog. Results are presented as percentage relative to the CTR and were normalized for beta-actin; 5 independent experiments were performed.F)- Representative blot demonstrating the decrease in protein levels for pluripotency markers.G) -RT-PCR analysis for the Oct4 and Nanog mRNA gene levels are represented as fold changes normalized to the Control after normalization for endogenous beta-actin; 4 independent experiments were performed. Results are expressed as means±SEM.H)- Quantification for the alkaline phosphatase assay: colonies stained red were counted as positive (pluripotent) colonies whereas unstained colonies were counted as negative. A total of 10 independent experiments were analyzed and results are expressed as means±SEM.*p0.05,**p0.01,***p0.001.
levels for both pluripotency markers confirming compromised pluripotency. Given that plurip-otent cells have high levels of Alkaline Phosphatase (AP), we also performed the AP assay which monitors the number of AP-positive red colonies [29,42] (Fig 1H) As expected controls had a high percentage of AP-positive colonies (over 90%), while cells growing without LIF had a lower percentage of AP-positive colonies (P<0.01). Interestingly, we observe a similar
decrease for cells treated with 3BrP in the presence of LIF. Overall the results clearly suggest a deleterious effect of 3BrP on pluripotency, similar to the effect promoted by removing LIF.
Mitochondrial function and Energy status of mESCs in the presence of
3BrP
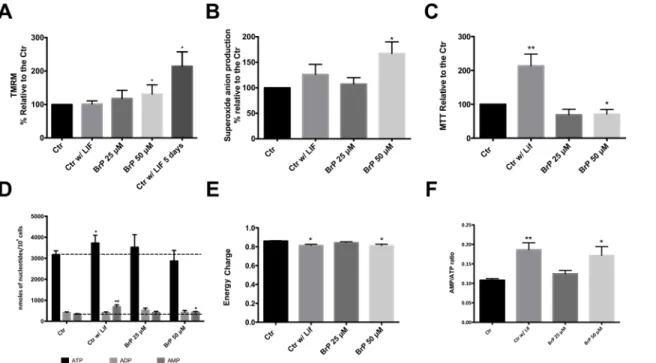
Given that 3BrP has been described to cause mitochondrial depolarization [43] and that and differentiated cells should have a higher mitochondrial membrane potential (MMP)[44] we assessed mitochondrial membrane potential with the Tetramethylrhodamine, methyl ester (TMRM) dye. Interestingly, our results show a trend towards an increase in MMP in the pres-ence of 3BrP (Fig 2A). Taking into account that, while it has been described that with differen-tiation mitochondria become more polarized, our negative control (absence of LIF for 60 h) was not confirming this trend, we cultured cells in the absence of LIF for 5 days, and this indeed resulted in a significant increase in mitochondrial membrane potential.
Mitochondrial ROS production, in the form of mitochondria-produced superoxide anion, was also analyzed as another indicator of mitochondrial activity and possible target for 3BrP induced changes in ESC status. Superoxide anion production was quantified by measuring MitoSOX Red fluorescence by flow cytometry, and showed a similar trend as noted for TMRM; all the experimental conditions presented a slight increase in superoxide anion pro-duction when compared to the control, although this increase was statistically significant for 50μM 3BrP (Fig 2B). This is in accordance with previous literature describing that 3BrP
expo-sure causes tumor cells to increase ROS production [45].
Taking into account the significant effect of 3BrP in mitochondrial function we wondered if this might impact cell energy status. To address this issue, adenine nucleotides were quantified by High-performance liquid chromatography (HPLC;Fig 2D). In accordance with previous data, a tendency for a decrease in ATP levels in cells treated with 50μM 3BrP was noted,
although it was not significant. The same cannot be said about the control without LIF, where we observed a significant increase in ATP levels, consistent with differentiation (P<0.05). No
differences were detected for ADP concentration while AMP levels were significantly increased in cells grown without LIF or in the presence of 50μM 3BrP and LIF (P<0.01 and P<0.05
respectively). When considering more integrated measurements of energy charge (Fig 2E), we determined that our experimental conditions are inducing a lower energy charge in mESC when compared to the control, with the most significant decrease observed for cells without LIF or exposed to 50μM 3BrP in the presence of LIF (P<0.05). When we take into account the
AMP/ATP ratio (Fig 2F) there is a significant increase in cells without LIF and exposed to 50μM 3BrP in the presence of LIF (P<0.01 and P<0.05, respectively), reflecting the differences
in nucleotide concentrations. Furthermore the MTT assay was also used to indirectly infer met-abolic activity, given that the assay measures cellular NADPH and NADH dehydrogenase activity and was normalized to total cell number. Our results demonstrate (Fig 2C) that 3BrP at a higher concentration negatively affects the metabolic activity of mESCs (P<0.05) and, again,
that differentiated cells are more active when compared to our control condition (P<0.01). In
standard differentiation (removal of LIF in control colonies), as seen when comparing ROS, MTT and ATP levels for both conditions.
Cell death in the presence of 3BrP
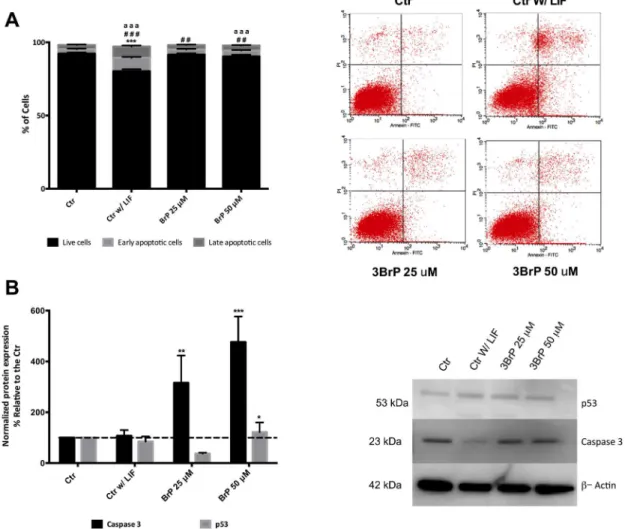
Considering that 3BrP is a known apoptosis inducer, and even though we did not see signifi-cant differences in terms of cell viability, we performed AnnexinV/PI analysis by flow cytome-try (Fig 3A). Notably, the absence of LIF drastically impacts cell survival (P<0.001), and a
higher concentration of 3BrP once more is shown to be detrimental, while 25μM 3BrP only
presented significant differences for early apoptosis. Surprisingly only the experimental condi-tions with 3BrP showed significant changes in caspase 3 protein levels, with 3BrP 25μM
show-ing a significant increase in caspase 3 levels (P<0.01) and 50μM 3BrP significantly increasing
both p53 (P<0.001) and caspase 3 (P<0.001;Fig 3B).
3BrP effects on glycolytic enzymes and on mESC differentiation
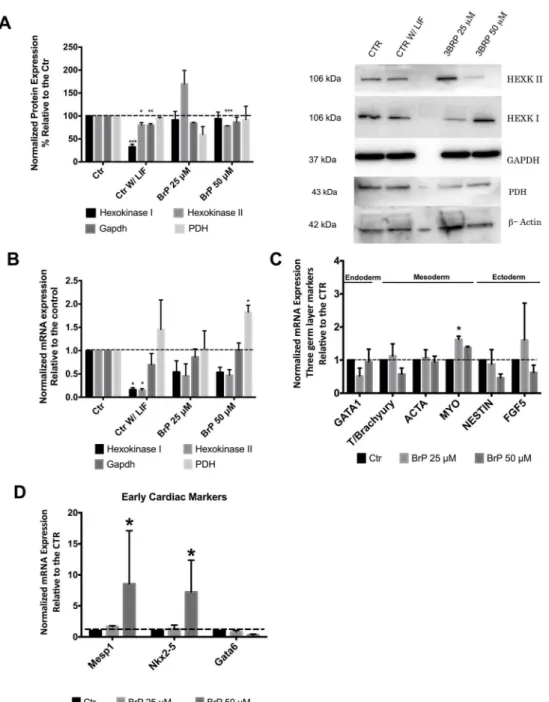
3BrP has been described to inhibit Hexokinase II (HKII) and, more recently, Gapdh [22]. Thus we examined protein and mRNA levels for some glycolytic enzymes in order to determine pos-sible 3BrP effects on glycolysis. Interestingly, Western Blot analysis revealed that differentiating cells (control without LIF) presented more significant alterations in those enzymes when com-pared to the 3BrP effect (Fig 4A). For HKI we observed a significant decrease in our negative control both for protein (P<0.001) and mRNA levels (P<0.05;Fig 4B) while HKII protein
lev-els were significantly decreased in Control without LIF (P<0.05) and 50μM 3BrP (P<0.001)
Fig 2. Assessing 3BrP effects on mitochondrial function.ESCs were maintained in control conditions (with LIF), in the absence of LIF (differentiation control) and in the presence of two different 3BrP concentrations (25 and 50μM) plus LIF. For each flow cytometry experiment results were analyzed in terms
of Geometric Mean of Fluorescence for 20000 cells for each condition and are represented as percentage relative to the control.A)- Quantification of mitochondrial membrane potential (MMP) potential using TMRM; 4 independent experiments were performed.B)- Quantification of superoxide production using MitoSOX Red dye; 4 independent experiments performed. See alsoS1 Fig.C)- Results for the MTT assay are presented as percentage of formazan crystals relative to the control. Because the goal was to evaluate oxidative status MTT results were normalized for total cell number. A total of 10 independent experiments were performed.*p0.05,**p0.01.D)- Nucleotide levels determined by HPLC in 10 independent experiments.E)- Energy charge calculated as ([ATP] + 0.5×[ADP])/([ATP] + [ADP] + [AMP]).F)- AMP/ATP ratio n = 10.
conditions. On the other hand, mRNA levels for both isoforms of Hexokinase decreased in the absence of LIF (P<0.05;Fig 4B). On the other hand Gapdh levels were not significantly affected
by 3BrP in our experiments, the only effect noted was for differentiating cells in the absence of LIF, and only at the protein level. Furthermore no differences were observed in Pyruvate dehy-drogenase (PDH) protein levels, which controls the fate of pyruvate conversion to either lactate or acetyl-CoA. However the same was not true for PDH mRNA levels, given that for the higher concentration of 3BrP there was a significant increase (P<0.05).
To determine if 3BrP could influence ESC differentiation we used the embryoid body assay, where cells are left to differentiate spontaneously by removing LIF, in this case in the presence or absence of 3BrP. The first thing to point out is the fact that control cells presented markers for the three germ layers upon differentiation, clearly demonstrating that ESCs were indeed pluripotent (Fig 4C). Given that initially the only significant difference was observed for the mesoderm marker MyoD, which is a marker for muscle development, we decided to analyze Fig 3. Assessment of apoptosis in mESC as affect by 3BrP.ESCs were maintained in control conditions (with LIF), in the absence of LIF (differentiation control) and in the presence of two different 3BrP concentrations (25 and 50μM) plus LIF.A)- Apoptosis/ Necrosis was accessed by flow cytometry for
Annexin v/PI and three populations were identified live cells (negative for both annexin V and PI); early apoptotic cells (positive for annexin V and negative for PI); late apoptotic cells (positive for both annexin V and PI). At the left side of the panel representative dot plots for all experimental conditions are presented. 20000 cells were evaluated for Geometric Mean of Fluorescence in each population. 4 independent experiments were performed. Symbols are used to compare levels of live (*), early apoptotic (#) and late apoptotic (a) cells. One, two and three symbols represent p0.05, p0.01, p0.001, respectively.B) -Western Blot quantification by densiometric evaluation for p53 and caspase3. Results are presented as percentage relative to the CTR and were normalized for beta-actin. 3 independent experiments were performed.*p0.05,**p0.01,***p0.001.
Fig 4. 3BrP effect on glycolytic enzymes as well as on differentiation markers assessed via embryoid body (EB) formation.ESCs were maintained in control conditions (with LIF), in the absence of LIF (differentiation control) and in the presence of two different 3BrP concentrations (25 and 50μM) plus LIF.A)
-Left: Protein levels for Hexokinases II and I, Gapdh and PDH were determined by Western Blot and quantified by densiometric evaluation. Results were normalized to beta-Actin protein levels and are represented as percentage relative to the control; the results represent n = 4. Right: a representative blot demonstrating the decrease in protein levels for glycolytic enzymes. Molecular weight markers were run in lane 3, and some may have reacted with the secondary antibody.B)- RT-PCR analysis for Hexokinase I, II, Gapdh and PDH mRNA. Results are presented as fold changes and normalized to beta-Actin levels. 4 independent experiments were analyzed.C)- RT-PCR analysis for the mesoderm, endoderm and ectoderm germ layers markers following ESC differentiation in EBs. Results are presented as fold changes for 3 independent experiments, normalized to the reference house keeping gene beta-Actin.D)- RT-PCR analysis for mesoderm cardiac markers: Mesp1; Nkx2-5 and Gata6 following ESC differentiation in EBs. Results are presented as fold changes for 3 independent experiments, normalized to the reference house keeping gene beta-Actin.*p0.05,**p0.01,***p0.001.
other markers focusing exclusively on early cardiac muscle markers, such as Mesp1, Nkx2-5 and Gata6, given that cardiac differentiation implies an increase in mitochondrial function (Fig 4D). Overall we found three markers differentially expressed, suggesting that 3BrP could possi-bly lead to a bias differentiation towards mesoderm, particularly cardiac development.
Discussion
Embryonic stem cells (ESC) in general rely more on glycolysis and a shift to a predominantly oxidative metabolism (OXPHOS) is though to be needed for differentiation to take place [7]. Due to the metabolic characteristics of cancer cells novel therapeutic approaches have focused on inhibiting glycolysis, and 3BrP has become a promising compound in this respect, because, although it also has other cellular targets, it inhibits glycolytic enzymes and alters mitochon-drial function. Indeed promising results regarding decrease in tumor size and cell death have been noted with this compound [24,43,46].
Considering the metabolic parallelism between ESC and cancer cells [7], we wondered weather 3BrP would affect pluripotent ESCs in the same manner. In order to address this issue we treated cells with 3BrP (concentrations in the range used in cancer research—0–80 mM [43]) in the presence of LIF, and monitored changes in mESC pluripotency to determine if 3BrP would induce metabolic changes that might shift cells towards differentiation, even under stringent pluripotency conditions. To our knowledge this is the first paper describing such an experimental approach for ESCs. Titrations were performed in order to determine the lowest concentration of 3BrP needed to affect ESC, and we chose as a negative control cells grown without LIF (i.e. differentiating cells).
We show that 3BrP has a negative impact on colony morphology, cell number, viability and cell proliferation, although not as negative as growing ESCs without LIF. Overall, in the pres-ence of 3BrP colonies were smaller and borders started to lose definition. These observations are paralleled by significant differences in total cell number, although with no detrimental effects on viability, suggesting that 3BrP affects cell proliferation rates. The effects of 3BrP on cell viability are well described, as this compound causes both apoptosis and necrosis by deplet-ing ATP due to impairment of mitochondrial function [47,48]. The reason we did not observe such an effect in our Live/Dead assay could be due to PI only staining cells with compromised membranes, which is a very late phenomenon in cell death. This was further confirmed with our annexinV/PI results, which revealed a negative impact of 3BrP for all experimental condi-tions. These results were supported by the Western blot analysis of p53 and caspase3 protein levels and point to a possible stressful cellular condition, which for differentiating cells is prob-ably a normal process of cell selection, while in the case of 3BrP we cannot rule out a toxic effect, which could explain the significant decrease in total cell number.
Although 3BrP is possibly causing toxic effects we could not rule out an additional impact in the cell cycle. Both pluripotent stem cells and certain cancer cells proliferate extensively, and thus require bioenergetic and biosynthetic blocks for cell growth and division [7]. Given the observed impact in total cell number, we analyzed PCNA, which is involved in DNA synthesis during replication and can interact with different cell cycle proteins including p21 [49,50]. It is also important to note that PCNA staining allowed us to distinguish a“true”differentiation effect (lack of LIF) from a 3BrP effect. However 3BrP did lead to an apparent loss of pluripo-tency as analyzed by protein and mRNA levels for Oct4 (and Nanog, to a lesser extent and only at the protein level), as well as the significant decrease in AP-positive colonies. It should be noted that the results observed for cells grown without LIF are similar to the ones obtained with cells exposed to 50μM 3BrP, showing that the highest 3BrP concentration is more
As discussed previously, 3BrP affects mitochondrial function in cancer cells, so we investi-gated mitochondrial-related changes in ESC in the presence of this compound. Overall mito-chondria become more active, reflected by the significant increase in MMP following 3BrP treatment, accompanied by an increase in the production of superoxide anion. For the higher concentration of 3BrP energy charge decreased, a reflection from the significant increase in AMP level and the tendency for a decrease in ATP levels, which could mean that the increment in MMP and ROS production is starting to be detrimental to mitochondrial function. MTT results also suggest a slower metabolic state of cells exposed to 3BrP, and given that MTT mea-sures dehydrogenase activity treated cells could have a lower capability to manage oxidative stress as well. This outcome is characteristic of 3BrP. On the other hand, as with PCNA results, cells grown without LIF were slightly different, with higher concentrations of ATP and AMP, and a significant increase in MTT, thus suggesting that these cells are more active and capable of managing oxidative stress.
Besides a detrimental effect on mitochondrial function and apoptosis effect 3BrP could affect metabolic enzymes promoting a metabolic shift that would result in the loss of pluripo-tency. In order to address this question we quantified protein and mRNA levels for Hexokinase I and II, as well as other downstream glycolytic enzymes. Although results were not linear, they suggest a decrease in both Hexokinase isoforms and Gapdh (both purported targets for 3BrP inhibition [22]), at the protein and mRNA levels upon differentiation. 3BrP seems to negatively impact Hexokinases in particular HKII at the protein level, which could lead to a shift in metabolism; however, more experiments are needed before definitive conclusions can be drawn. Notably, any conclusions on more specific roles for Hexokinases and Gapdh in pluripo-tency would certainly require molecular-based assays, such as enzyme overexpression/downre-gulation, which, as stated previously, was not the purpose of the present work.
Overall our results suggest that by using 3BrP we are promoting pluripotency loss even under pluripotency culture conditions, and possibly a shift in metabolism, considering that mitochondria are more active. However, the effects of 3BrP in the presence of LIF do not always mirror what takes place under normal differentiation conditions (absence of LIF), sug-gesting that 3BrP is not simply shifting ESCs towards differentiation, but also causing other effects, and thus that the parallelism between stemness and cancer must be treated with cau-tion. In addition, differentiation seems to be accompanied by a decrease in Gapdh and Hif 1α
levels, which is very interesting given that Hif-1αparticipates in the maintenance of stem cell identity by interacting with core pluripotency transcriptional factors, and also increases the expression of glycolytic enzymes [7,8,16].
Although embryonic stem cells (ESC) rely more on glycolysis it is important to note that there may be a metabolically bivalent metabolic state early in cell commitment [51]. Regardless the first main conclusion of this study is that the putative chemotherapeutic agent 3BrP affects ESC pluripotency, but does not trigger forced differentiation in the same manner as removing LIF. The second goal of the study was to determine if the compound would hasten triggered ESC differentiation, or create a useful differentiation bias. Indeed, 3BrP seemed to induce biased differentiation, given that differentiation in the presence of the compound was associ-ated with predominance in cardiac precursors markers. However, this bias was not of a magni-tude that would definitely imply a clear practical use in this case.
Supporting Information
Dot-Plots and overlay of Histograms for analysis of:(A)intracellular amounts of superoxide using MitoSOX Red (Molecular Probes);(B)evaluation of the expression of the proliferating cell nuclear antigen (PCNA) and(C)mitochondrial membrane potential using TMRM (Invitro-gen). For MitoSOX Red and PCNA experimental conditions were: Control (upper left panel); Control without LIF (upper right); 3BrP 25μM+LIF (lower left) and 3BrP 50μM + LIF (lower
right). For TMRM analysis the Dot-Plots are: Control (upper left panel); Control without LIF (upper central panel); Control without LIF for 5 days (upper right panel); 3BrP 25μM+ LIF
(lower left panel) and 3BrP 50μM + LIF (lower right panel). The histograms show
representa-tive experiments in an overlay display in order to better represent the data. (TIF)
S1 Table. List and sequence of primers obtained from the primer bank databasehttp://pga. mgh.harvard.edu/primerbank/.Primers were used for the genes listed as described in the text. (DOCX)
Acknowledgments
The authors acknowledge all members of the Biology of Reproduction and Stem Cell Group for scientific discussions; Miguel Ramalho-Santos (UCSF) for providing cells; Isabel Nunes for assistance in flow cytometry studies; Maria Sancha Santos for her valuable help in HPLC analy-sis and Henriqueta Silva head of the medical genetics service from Medicine Faculty, University of Coimbra for allowing the use of RT-PCR equipment. John Jones (CNC) is thanked for reviewing the Manuscript in terms of possible English language issues.
The authors thank Fundação para a Ciência e a Tecnologia (FCT) Portugal for grant sup-port (PTDC/EBB-EBI/ 120634/2010 and PDTC/QUI-BIQ/120652/2010 co-funded by Com-pete/FEDER/National Funds; and scholarships attributed to ASR (SFRH/BD/33463/2008); to MC (SFRH/BD/51681/2011), to TP (SFRH/BD/51684/2011), AG (SFRH/BD/51968/2012) and SLP (SFRH/BPD/98995/2013) and also to QREN (Centro-01-0762-FEDER-00204). Center for Neuroscience and Cell Biology (CNC) funding is also supported by FCT (PEst-C/SAU/ LA0001/2011).
Author Contributions
Conceived and designed the experiments: ASR MC SLP JRS. Performed the experiments: ASR AG MC TP. Analyzed the data: ASR SLP MC JRS. Wrote the paper: ASR JRS.
References
1. Kondoh H, Lleonart ME, Nakashima Y, Yokode M, Tanaka M, Bernard D, et al. A high glycolytic flux supports the proliferative potential of murine embryonic stem cells. Antioxid Redox Signal. 2007; 9 (3):293–9. Epub 2006/12/23. PMID:17184172.
2. Cho YM, Kwon S, Pak YK, Seol HW, Choi YM, Park do J, et al. Dynamic changes in mitochondrial bio-genesis and antioxidant enzymes during the spontaneous differentiation of human embryonic stem cells. Biochem Biophys Res Commun. 2006; 348(4):1472–8. Epub 2006/08/22. S0006-291X(06) 01821-3 [pii] doi:10.1016/j.bbrc.2006.08.020PMID:16920071.
3. St John JC, Ramalho-Santos J, Gray HL, Petrosko P, Rawe VY, Navara CS, et al. The expression of mitochondrial DNA transcription factors during early cardiomyocyte in vitro differentiation from human embryonic stem cells. Cloning Stem Cells. 2005; 7(3):141–53. Epub 2005/09/24. doi:10.1089/clo. 2005.7.141PMID:16176124.
5. Mandal S, Lindgren AG, Srivastava AS, Clark AT, Banerjee U. Mitochondrial function controls prolifera-tion and early differentiaprolifera-tion potential of embryonic stem cells. Stem Cells. 2011; 29(3):486–95. Epub 2011/03/23. doi:10.1002/stem.590PMID:21425411.
6. Tamai M, Yamashita A, Tagawa Y. Mitochondrial development of the in vitro hepatic organogenesis model with simultaneous cardiac mesoderm differentiation from murine induced pluripotent stem cells. J Biosci Bioeng. 2011; 112(5):495–500. Epub 2011/08/06. S1389-1723(11)00264-7 [pii] doi:10.1016/j. jbiosc.2011.07.005PMID:21816670.
7. Pereira SL, Rodrigues AS, Sousa MI, Correia M, Perestrelo T, Ramalho-Santos J. From gametogene-sis and stem cells to cancer: common metabolic themes. Hum Reprod Update. 2014. Epub 2014/07/ 12. dmu034 [pii] doi:10.1093/humupd/dmu034PMID:25013216.
8. Pereira SL, Graos M, Rodrigues AS, Anjo SI, Carvalho RA, Oliveira PJ, et al. Inhibition of mitochondrial complex III blocks neuronal differentiation and maintains embryonic stem cell pluripotency. PLoS One. 2013; 8(12):e82095. Epub 2013/12/07. [pii]. PMID:24312632; PubMed Central PMCID: PMC3847032.
9. Folmes CD, Nelson TJ, Martinez-Fernandez A, Arrell DK, Lindor JZ, Dzeja PP, et al. Somatic oxidative bioenergetics transitions into pluripotency-dependent glycolysis to facilitate nuclear reprogramming. Cell Metab. 2011; 14(2):264–71. Epub 2011/08/02. S1550-4131(11)00260-9 [pii] doi:10.1016/j.cmet. 2011.06.011PMID:21803296; PubMed Central PMCID: PMC3156138.
10. Manganelli G, Fico A, Masullo U, Pizzolongo F, Cimmino A, Filosa S. Modulation of the pentose phos-phate pathway induces endodermal differentiation in embryonic stem cells. PLoS One. 2012; 7(1): e29321. Epub 2012/01/19. doi:10.1371/journal.pone.0029321PONE-D-11-01982 [pii]. PMID: 22253711; PubMed Central PMCID: PMC3257253.
11. Varum S, Rodrigues AS, Moura MB, Momcilovic O, Easley CAt, Ramalho-Santos J, et al. Energy metabolism in human pluripotent stem cells and their differentiated counterparts. PLoS One. 2011; 6 (6):e20914. Epub 2011/06/24. doi:10.1371/journal.pone.0020914PONE-D-11-02358 [pii]. PMID: 21698063; PubMed Central PMCID: PMC3117868.
12. Ngo H, Tortorella SM, Ververis K, Karagiannis TC. The Warburg effect: molecular aspects and thera-peutic possibilities. Mol Biol Rep. 2014. Epub 2014/09/26. doi:10.1007/s11033-014-3764-7PMID: 25253100.
13. Peng Q, Zhou J, Zhou Q, Pan F, Zhong D, Liang H. Silencing hexokinase II gene sensitizes human colon cancer cells to 5-fluorouracil. Hepatogastroenterology. 2009; 56(90):355–60. Epub 2009/07/08. PMID:19579598.
14. Wolf A, Agnihotri S, Micallef J, Mukherjee J, Sabha N, Cairns R, et al. Hexokinase 2 is a key mediator of aerobic glycolysis and promotes tumor growth in human glioblastoma multiforme. J Exp Med. 2011; 208(2):313–26. Epub 2011/01/19. jem.20101470 [pii] doi:10.1084/jem.20101470PMID:21242296; PubMed Central PMCID: PMC3039857.
15. Dang CV, Semenza GL. Oncogenic alterations of metabolism. Trends Biochem Sci. 1999; 24(2):68– 72. Epub 1999/03/31. S0968-0004(98)01344-9 [pii]. PMID:10098401.
16. Prigione A, Rohwer N, Hoffmann S, Mlody B, Drews K, Bukowiecki R, et al. HIF1alpha modulates cell fate reprogramming through early glycolytic shift and upregulation of PDK1-3 and PKM2. Stem Cells. 2014; 32(2):364–76. doi:10.1002/stem.1552PMID:24123565.
17. Pistollato F, Chen HL, Rood BR, Zhang HZ, D'Avella D, Denaro L, et al. Hypoxia and HIF1alpha repress the differentiative effects of BMPs in high-grade glioma. Stem Cells. 2009; 27(1):7–17. Epub 2008/10/ 04. 2008–0402 [pii] doi:10.1634/stemcells.2008-0402PMID:18832593.
18. Jogi A, Ora I, Nilsson H, Lindeheim A, Makino Y, Poellinger L, et al. Hypoxia alters gene expression in human neuroblastoma cells toward an immature and neural crest-like phenotype. Proc Natl Acad Sci U S A. 2002; 99(10):7021–6. Epub 2002/05/16. doi:10.1073/pnas.10266019999/10/7021 [pii]. PMID: 12011461; PubMed Central PMCID: PMC124521.
19. Folmes CD, Martinez-Fernandez A, Faustino RS, Yamada S, Perez-Terzic C, Nelson TJ, et al. Nuclear reprogramming with c-Myc potentiates glycolytic capacity of derived induced pluripotent stem cells. J Cardiovasc Transl Res. 2013; 6(1):10–21. Epub 2012/12/19. doi:10.1007/s12265-012-9431-2PMID: 23247633.
20. Hsu PP, Sabatini DM. Cancer cell metabolism: Warburg and beyond. Cell. 2008; 134(5):703–7. Epub 2008/09/09. S0092-8674(08)01066-0 [pii] doi:10.1016/j.cell.2008.08.021PMID:18775299.
21. Glick M, Biddle P, Jantzi J, Weaver S, Schirch D. The antitumor agent 3-bromopyruvate has a short half-life at physiological conditions. Biochem Biophys Res Commun. 2014; 452(1):170–3. doi:10.1016/ j.bbrc.2014.08.066PMID:25152397.
23. Ko YH, Smith BL, Wang Y, Pomper MG, Rini DA, Torbenson MS, et al. Advanced cancers: eradication in all cases using 3-bromopyruvate therapy to deplete ATP. Biochem Biophys Res Commun. 2004; 324 (1):269–75. Epub 2004/10/07. S0006-291X(04)02062-5 [pii] doi:10.1016/j.bbrc.2004.09.047PMID: 15465013.
24. Isayev O, Rausch V, Bauer N, Liu L, Fan P, Zhang Y, et al. Inhibition of glucose turnover by 3-bromo-pyruvate counteracts pancreatic cancer stem cell features and sensitizes cells to gemcitabine. Oncotar-get. 2014; 5(13):5177–89. PMID:25015789; PubMed Central PMCID: PMC4148131.
25. Galina A. Mitochondria: 3-bromopyruvate vs. mitochondria? A small molecule that attacks tumors by targeting their bioenergetic diversity. Int J Biochem Cell Biol. 2014; 54:266–71. doi:10.1016/j.biocel. 2014.05.013PMID:24842108.
26. Wakayama T, Rodriguez I, Perry AC, Yanagimachi R, Mombaerts P. Mice cloned from embryonic stem cells. Proc Natl Acad Sci U S A. 1999; 96(26):14984–9. Epub 1999/12/28. PMID:10611324; PubMed Central PMCID: PMC24759.
27. Ohtsuka M, Ishii K, Kikuti YY, Warita T, Suzuki D, Sato M, et al. Construction of mouse 129/Ola BAC library for targeting experiments using E14 embryonic stem cells. Genes Genet Syst. 2006; 81(2):143– 6. Epub 2006/06/07. JST.JSTAGE/ggs/81.143 [pii]. PMID:16755138.
28. Berridge MV, Herst PM, Tan AS. Tetrazolium dyes as tools in cell biology: new insights into their cellular reduction. Biotechnol Annu Rev. 2005; 11:127–52. Epub 2005/10/12. S1387-2656(05)11004-7 [pii] doi: 10.1016/S1387-2656(05)11004-7PMID:16216776.
29. O'Connor MD, Kardel MD, Eaves CJ. Functional assays for human embryonic stem cell pluripotency. Methods Mol Biol. 2011; 690:67–80. Epub 2010/11/03. doi:10.1007/978-1-60761-962-8_4PMID: 21042985.
30. Perry SW, Norman JP, Barbieri J, Brown EB, Gelbard HA. Mitochondrial membrane potential probes and the proton gradient: a practical usage guide. Biotechniques. 2011; 50(2):98–115. Epub 2011/04/ 14. 000113610 [pii] doi:10.2144/000113610PMID:21486251; PubMed Central PMCID:
PMC3115691.
31. Schieke SM, Ma M, Cao L, McCoy JP Jr., Liu C, Hensel NF, et al. Mitochondrial metabolism modulates differentiation and teratoma formation capacity in mouse embryonic stem cells. J Biol Chem. 2008; 283 (42):28506–12. Epub 2008/08/21. M802763200 [pii] doi:10.1074/jbc.M802763200PMID:18713735; PubMed Central PMCID: PMC2568919.
32. Floryk D, Houstek J. Tetramethyl rhodamine methyl ester (TMRM) is suitable for cytofluorometric mea-surements of mitochondrial membrane potential in cells treated with digitonin. Biosci Rep. 1999; 19 (1):27–34. Epub 1999/06/24. PMID:10379904.
33. Mukhopadhyay P, Rajesh M, Hasko G, Hawkins BJ, Madesh M, Pacher P. Simultaneous detection of apoptosis and mitochondrial superoxide production in live cells by flow cytometry and confocal micros-copy. Nat Protoc. 2007; 2(9):2295–301. Epub 2007/09/15. nprot.2007.327 [pii] doi:10.1038/nprot. 2007.327PMID:17853886; PubMed Central PMCID: PMC2225540.
34. Lee S, Van Remmen H, Csete M. Sod2 overexpression preserves myoblast mitochondrial mass and function, but not muscle mass with aging. Aging Cell. 2009; 8(3):296–310. Epub 2009/07/25. ACE477 [pii] doi:10.1111/j.1474-9726.2009.00477.xPMID:19627269.
35. Dingley S, Chapman KA, Falk MJ. Fluorescence-activated cell sorting analysis of mitochondrial con-tent, membrane potential, and matrix oxidant burden in human lymphoblastoid cell lines. Methods Mol Biol. 2012; 837:231–9. Epub 2012/01/05. doi:10.1007/978-1-61779-504-6_16PMID:22215552; PubMed Central PMCID: PMC3590112.
36. Mahler M, Miyachi K, Peebles C, Fritzler MJ. The clinical significance of autoantibodies to the proliferat-ing cell nuclear antigen (PCNA). Autoimmun Rev. 2012; 11(10):771–5. Epub 2012/03/03. S1568-9972 (12)00040-7 [pii] doi:10.1016/j.autrev.2012.02.012PMID:22381917.
37. Nair RP, Krishnan LK. Identification of p63+ keratinocyte progenitor cells in circulation and their matrix-directed differentiation to epithelial cells. Stem Cell Res Ther. 2013; 4(2):38. Epub 2013/04/13. scrt186 [pii] doi:10.1186/scrt186PMID:23578397.
38. Amaral S, Mota PC, Lacerda B, Alves M, Pereira Mde L, Oliveira PJ, et al. Testicular mitochondrial alterations in untreated streptozotocin-induced diabetic rats. Mitochondrion. 2009; 9(1):41–50. Epub 2008/12/23. S1567-7249(08)00106-2 [pii] doi:10.1016/j.mito.2008.11.005PMID:19100345.
39. Stocchi V, Cucchiarini L, Magnani M, Chiarantini L, Palma P, Crescentini G. Simultaneous extraction and reverse-phase high-performance liquid chromatographic determination of adenine and pyridine nucleotides in human red blood cells. Anal Biochem. 1985; 146(1):118–24. Epub 1985/04/01. 0003-2697(85)90405-1 [pii]. PMID:3993925.
Cell Res. 2009; 3(2–3):142–56. Epub 2009/09/01. S1873-5061(09)00085-3 [pii] doi:10.1016/j.scr. 2009.07.002PMID:19716358; PubMed Central PMCID: PMC2837416.
41. Ko YH, Verhoeven HA, Lee MJ, Corbin DJ, Vogl TJ, Pedersen PL. A translational study "case report" on the small molecule "energy blocker" 3-bromopyruvate (3BP) as a potent anticancer agent: from bench side to bedside. J Bioenerg Biomembr. 2012; 44(1):163–70. Epub 2012/02/14. doi:10.1007/ s10863-012-9417-4PMID:22328020.
42. O'Connor MD, Kardel MD, Iosfina I, Youssef D, Lu M, Li MM, et al. Alkaline phosphatase-positive col-ony formation is a sensitive, specific, and quantitative indicator of undifferentiated human embryonic stem cells. Stem Cells. 2008; 26(5):1109–16. Epub 2008/02/16. 2007–0801 [pii] doi:10.1634/ stemcells.2007-0801PMID:18276800.
43. Macchioni L, Davidescu M, Sciaccaluga M, Marchetti C, Migliorati G, Coaccioli S, et al. Mitochondrial dysfunction and effect of antiglycolytic bromopyruvic acid in GL15 glioblastoma cells. J Bioenerg Bio-membr. 2011; 43(5):507–18. Epub 2011/08/13. doi:10.1007/s10863-011-9375-2PMID:21833601.
44. Rodrigues JR-SaAS. From Oocytes and Pluripotent Stem Cells to Fully Differentiated Fates: (Also) a Mitochondrial Odyssey. In: John JCS, editor. Mitochondrial DNA, Mitochondria, Disease and Stem Cells: Humana Press; 2012. p. 69–86.
45. Qin JZ, Xin H, Nickoloff BJ. 3-Bromopyruvate induces necrotic cell death in sensitive melanoma cell lines. Biochem Biophys Res Commun. 2010; 396(2):495–500. Epub 2010/05/01. S0006-291X(10) 00819-3 [pii] doi:10.1016/j.bbrc.2010.04.126PMID:20430010.
46. Zhang Q, Zhang Y, Zhang P, Chao Z, Xia F, Jiang C, et al. Hexokinase II inhibitor, 3-BrPA induced autophagy by stimulating ROS formation in human breast cancer cells. Genes & cancer. 2014; 5(3– 4):100–12. PMID:25053988; PubMed Central PMCID: PMC4091531.
47. Kim JS, Ahn KJ, Kim JA, Kim HM, Lee JD, Lee JM, et al. Role of reactive oxygen species-mediated mitochondrial dysregulation in 3-bromopyruvate induced cell death in hepatoma cells: ROS-mediated cell death by 3-BrPA. J Bioenerg Biomembr. 2008; 40(6):607–18. Epub 2008/12/11. doi:10.1007/ s10863-008-9188-0PMID:19067133.
48. Xu RH, Pelicano H, Zhou Y, Carew JS, Feng L, Bhalla KN, et al. Inhibition of glycolysis in cancer cells: a novel strategy to overcome drug resistance associated with mitochondrial respiratory defect and hyp-oxia. Cancer Res. 2005; 65(2):613–21. Epub 2005/02/08. 65/2/613 [pii]. PMID:15695406.
49. Kreis NN, Louwen F, Yuan J. Less understood issues: p21 in mitosis and its therapeutic potential. Oncogene. 2014; 0. Epub 2014/05/27. onc2014133 [pii] doi:10.1038/onc.2014.133PMID:24858045.
50. Strzalka W, Ziemienowicz A. Proliferating cell nuclear antigen (PCNA): a key factor in DNA replication and cell cycle regulation. Annals of botany. 2011; 107(7):1127–40. doi:10.1093/aob/mcq243PMID: 21169293; PubMed Central PMCID: PMC3091797.
51. Zhou W, Choi M, Margineantu D, Margaretha L, Hesson J, Cavanaugh C, et al. HIF1αinduced switch