DANIEL CARNEIRO DE ABREU
WHOLE-FARM MODELING APPROACH TO EVALUATE DIFFERENT CROP ROTATIONS IN ORGANIC DAIRY SYSTEMS
Tese apresentada à Universidade Federal de Viçosa, como parte das exigências do Programa de Pós-Graduação em Zootecnia, para obtenção do título de Doctor Scientiae.
VIÇOSA
ii Aos meus pais, Antonio Abreu e Heloisa Abreu. À minha esposa Caren Ghedini.
À minha filha Luiza Abreu.
iii
AGRADECIMENTOS
A Deus, pela vida e por sempre guiar e iluminar o caminho.
À proeminente Universidade Federal de Viçosa, pela oportunidade de completar mais uma importante etapa de minha educação, e em especial ao Departamento de Zootecnia.
À University of New Hampshire pela chance de cursar importantes disciplinas as quais foram essências para condução do meu trabalho de pesquisa.
À University of Maine por permitir a condução do trabalho de pesquisa.
À Fundação de Amparo à Pesquisa do estado de Minas Gerais pela concessão da bolsa de doutorado e doutorado sanduíche.
À minha adorada mãe Heloisa Abreu pelo apoio incondicional. À minha amada esposa Caren Ghedini pelo companheirismo e amor. À minha querida e amada filha Luiza Abreu por existir em minha vida.
As maravilhosas pessoas que conheci em New Hampshire, William Badgley, Debbie Liskow, Anthony McManus, Michael D'Angelo e Van Gsottschneider; e que sempre serão bem vindas no Brasil.
Ao prof. Rogério de Paula Lana pela orientação e confiança que possibilitou o início de minha carreira científica.
Ao prof. André Soares de Oliveira pela amizade, exemplo, orientação, ensinamentos e conselhos durante minha vida acadêmica.
À profa. Ellen Beth Mallory pela orientação, destreza, paciência, competência e ajuda sempre necessária.
Ao prof. Aaron Kinyu Hoshide pela amizade, ensinamentos, orientação, longas horas de dedicação e caloroso acolhimento durante a minha estadia em Maine.
Ao amigo e compadre Mozart Fonseca pela sua preciosa amizade e atenção.
Aos professores Roberto Novais, Cristina Veloso, Dilermando Fonseca, Mário Paulino, Sebastião Valadares Filho, Fabiano Barbosa e Richard Smith pelo conhecimento transferido.
Aos servidores do Departamento de Zootecnia: Fernanda Silva, Celeste Silva, Rosana Barbosa e Venâncio Santos.
À equipe do escritório internacional da University of New Hampshire: Elizabeth Webber, Leila Paje-Manalo, Thuy Nguyen e Brittany Edgar.
Ao prof. André Fonseca de Brito pela recepção na University of New Hampshire.
iv BIOGRAFIA
DANIEL CARNEIRO DE ABREU, filho de Antonio Marcio Carneiro de Abreu e Heloisa Aparecida Barroso de Abreu, nasceu em 5 de setembro de 1981, em Ipatinga, Minas Gerais, Brasil.
Em 2001, ingressou na Universidade Federal de Viçosa, onde obteve o título de Engenheiro Agrônomo, tendo colado grau em 25 de julho de 2008.
No período de janeiro de 2003 a julho de 2004 participou do programa MAST Internacional da Universidade de Minnesota.
Em julho de 2010, concluiu o curso de Mestrado em Zootecnia na Universidade Federal de Viçosa, concentrando seus estudos na área de Nutrição e Produção de Ruminantes.
v SUMÁRIO
RESUMO ... vi
ABSTRACT ... vii
INTRODUÇÃO GERAL ... 1
Literatura Citada ... 3
The Integrated Farm System Model ... 4
References ... 5
Interpretative Summary ... 6
Economic and environmental implications of wheat crop rotations on organic dairy farms ... 7
INTRODUCTION ... 8
MATERIALS AND METHODS ... 10
RESULTS... 16
DISCUSSION ... 23
CONCLUSIONS ... 26
vi RESUMO
ABREU, Daniel Carneiro de, D.Sc., Universidade Federal de Viçosa, Setembro de 2014. Análise de ciclo de vida na avaliação de diferentes rotações de culturas com trigo em fazendas produtoras de leite orgânico. Orientador: Rogério de Paula Lana. Co-orientadores: André Soares de Oliveira e Cristina Mattos Veloso.
vii ABSTRACT
ABREU, Daniel Carneiro de, D.Sc., Universidade Federal de Viçosa, September, 2014. Whole-farm modeling approach to evaluate different crop rotations in organic dairy systems. Adviser: Rogério de Paula Lana. Co-advisers: André Soares de Oliveira and Cristina Mattos Veloso.
1
INTRODUÇÃO GERAL
O mercado de trigo (Triticum aestivum L.) orgânico cresceu em grande magnitude na América do Norte (Mallory & Darby, 2013) e Europa (David et al., 2012). A produção de trigo orgânico (organic food-grade), com padrão exigido pela indústria (mais de 12% de PB), é comercializada pelo dobro do valor pago ao trigo orgânico tradicional, sendo este utilizado na nutrição animal em sistemas orgânicos. Um dos motivos que impulsiona este mercado reside na associação do consumidor à maior sustentabilidade da produção orgânica em relação aos sistemas convencionais
A grande demanda de trigo orgânico gera oportunidades promissoras para produtores de leite orgânico. Estes produtores podem incluir o trigo na rotação de cultura e explorar o mercado de trigo orgânico para produção de pão. Entretanto, a sustentabilidade de diferentes sequências de rotações de cultura, que adicionem o trigo na rotação, deve ser avaliada do ponto de vista econômico e ambiental para que seus os benefícios sejam quantificados.
Sustentabilidade na agropecuária pode ser definida como um sistema integrado de práticas de produção vegetal e animais que satisfaça a necessidade humana de alimentação e de fibra, melhore a qualidade do meio ambiente e a eficiência de uso recursos naturais sobre os quais a agricultura depende, torne a utilização de recursos (renováveis e não renováveis) mais eficiente na atividade, integre ciclos biológicos naturais no controle de pragas e doenças, mantenha a viabilidade econômica da atividade agrícola e melhore a qualidade de vida do produtor e da sociedade como um todo (FACTA, 1990).
2
comuns em monocultivo e, também, melhorar a saúde e o bem estar animal (Tilman et al., 2001; Lotter, 2003; Mondelaers et al., 2009; Tuomisto et al., 2012).
3
Literatura Citada
Mallory, E.B.; Darby, H. In-season nitrogen effects on organic hard red winter wheat yield and quality. Agronomy Journal, v.105, p.1167-1175, 2013.
David, C.J. et al. Organic bread wheat production and market in Europe. Sustainable Agriculture Reviews, v.11, p.43-62, 2012.
Minnesota. Journal of Dairy Science, v.96, n.9, p.6117-6126, 2013.
FACTA - Food, Agriculture, Conservation, and Trade Act of 1990. Farm Bill, lei publica, p.101-624, titúlo XVI, sub.A, seção 1603, 1990.
Tilman, D. et al. Forecasting agriculturally driven global environmental change. Science, v.292, p.281-284, 2001.
Lotter, D.W. Organic Agriculture. Journal of Sustainable Agriculture, v.21, n.4, p.59-128, 2003.
Mondelaers, K. et al. A meta-analysis of the differences in environmental impacts between organic and conventional farming. British Food Journal, v.111, p.1098-1119, 2009.
4
The Integrated Farm System Model
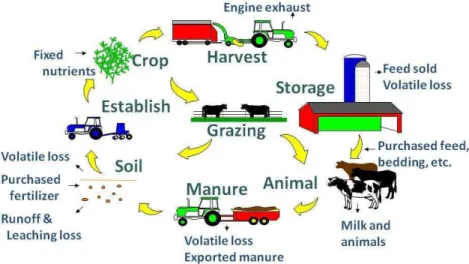
The Integrated Farm System Model or IFSM is a mechanistic model representing and modeling the behavior of an integrated agriculture system using a whole-farm modeling approach. The model was created by Clarence Alan Rotz in collaboration with several researchers on systems research and modeling work. They dedicated over 25 years in developing the current structure of IFSM (version 4.1) today.
IFSM is considered unique compared to other models because it simulates all major farm components on a process level over many years of weather conditions (Figure 1). Empirical relationships are defined with comprehensiveness in the number of farm components included integrating the major biological and physical processes of a crop, beef, or dairy farm (Rotz et al., 2014), as well as system processes such as crop and pasture production, crop harvest, feed storage, grazing, feeding, and manure handling (Rotz et al. 1989, 1999, 2002, 2014).
5
Modeling agricultural systems today using inexpensive computer programs like IFSM has become an important research tool to supplement experimental designs and on-farm research in areas of agronomy, animal science and soil science to predict system responses such as crop yield to nutrient application or animal growth rate to feed intake (Thornley & France, 2007). Unlike other farm models, IFSM integrates all agricultural components (soil, plants, animals and weather) as a whole-farm system. IFSM predicts the long-term performance, environmental impact, and economics of livestock and crop production systems, which is essential to evaluating and improving the sustainability of agricultural systems.
References
Thornley, J.H.M; France, J. 2007. Mathematical Models in Agriculture: Quantitative Methods for the Plant, Animal and Ecological Sciences. CAB International, Wallingford, Oxfordshire, UK.
Rotz, C.A.; Corson, M.S.; Chianese, D.S.; Montes, F.; Hafner, S.D.; Bonifacio, H.F. and Coiner, U.C. October 2014. The Integrated Farm System Model - Reference Manual Version 4.1. Pasture Systems and Watershed Management Research Unit - Agriculture Research Service of United States Department of Agriculture.
Rotz, C.A.; Buckmaster, D.R.; Mertens, R.D.; Black, J.R. 1989. DAFOSYM: A Dairy Forage System Model for Evaluating Alternatives in Forage Conservation. Journal of Dairy Science, Vol. 72, p. 3050 3063.
Rotz, C.A.; Satter, L.D.; Mertens, D.R.; Muck, R.E. 1999. Feeding Strategy, Nitrogen Cycling, and Profitability of Dairy Farms. Journal of Dairy Science, Vol. 82, p. 2841 2855.
6
Interpretative Summary
7
Economic and environmental implications of wheat crop rotations on organic dairy farms
D.C. Abreu*§1, A.K. Hoshide , E.B. Mallory , A.S. Oliveira*, R.J. Kersbergen , R.P. Lana§
*Instituto de Ciências Agrárias e Ambientais, Universidade Federal de Mato Grosso, Campus Sinop, Sinop, MT, Brazil, 78557-267
School of Economics, University of Maine, Orono, ME, 04469
University of Maine, Cooperative Extension and School of Food and Agriculture, 495 College Avenue, Orono, ME, 04473
§
Universidade Federal de Viçosa, Viçosa, MG, Brazil, 36570-900
1
8
INTRODUCTION
The organic food market has expanded in North America (Lotter 2003; McBride & Greene 2009) and Europe (Cederberg & Mattsson 2000; David et al. 2012).One of the reasons for the expansion of this market is the pool of consumers demanding the often greater sustainability of organic production compared to conventional systems (O'Hara & Parsons 2013) when organic is based on ecological production systems integrating cultural, biological, and mechanical practices that improve cycling of resources, promote ecological balance, and conserve biodiversity (Underwood et al. 2011).
In the northeastern United States, the demand for local organic bread wheat (Triticum aestivum L.) is growing. This market niche provides a great opportunity for organic dairy farmers in the New England area. In Europe, prices for organic cereal used for human nutrition can be 100% more than conventional prices, whereas the organic price differential for animal feed is a maximum of 30% (David et al. 2012).
9
with crude protein values over 12% of dry matter). Also, these premiums prices can fluctuate according to consumer demand and global production.
We hypothesize that organic dairy producers can combine innovative wheat crop rotations in order to optimize use of nutrients released in these systems. The profitability of dairy farms integrating wheat into their cropping systems could be improved by enhancing yields to compensate for recent declines in organic milk price premiums, increasing N availability for plant uptake to boost crop productivity, and stabilizing farm income through enterprise diversification. Intensive cropping rotations that include wheat, may have higher fertility inputs and associated costs, but result in greater yields and economic returns. We also hypothesize wheat can potentially improve environmental sustainability on New England organic dairy farms by reducing erosion and dependence on off-farm feed inputs.
10
MATERIALS AND METHODS Integrated Farm System Model
IFSM is a mechanistic model representing and modeling the behavior of an integrated agriculture system. IFSM conducts process-level simulation of the farming system and it is unique in the level of detail used to define empirical relationships along with the comprehensiveness of the number of farm components included. IFSM has been created and used to evaluate dairy, beef and crop production, and interacting major processes in those systems such as crop and pasture production, crop harvest, feed storage, grazing, feeding, and manure handling (Rotz et al. 1989, 1999, 2001). Many biological and physical processes in the system are integrated (Rotz et al. 2002) allowing the model to predict the long-term performance, environmental impact, and economics of livestock and crop production systems. These agricultural systems can be evaluated and compared over many years of weather conditions to determine their sustainability.
Crop production, environmental impact and economic performance are determined for each simulated year of weather. Weather conditions are the only source of variation over the simulated 26 years. In this study, each cropping strategy is considered a treatment by IFSM, and each simulated year is a replicate of farm performance for the specific weather conditions of that year.
11
utilized on the farm. Third, the machinery parameter file included size, initial cost, operating parameters, and repair factors for farm equipment.
IFSM model output provides extensive information including all crop yields, feeds produced, bought and sold, manure generated, farm costs, income from products sold (feed, food, animals and milk), and the net return or profitability and how these components of the whole-farm simulation are functioning under different crop rotations strategies.
Representative Farm
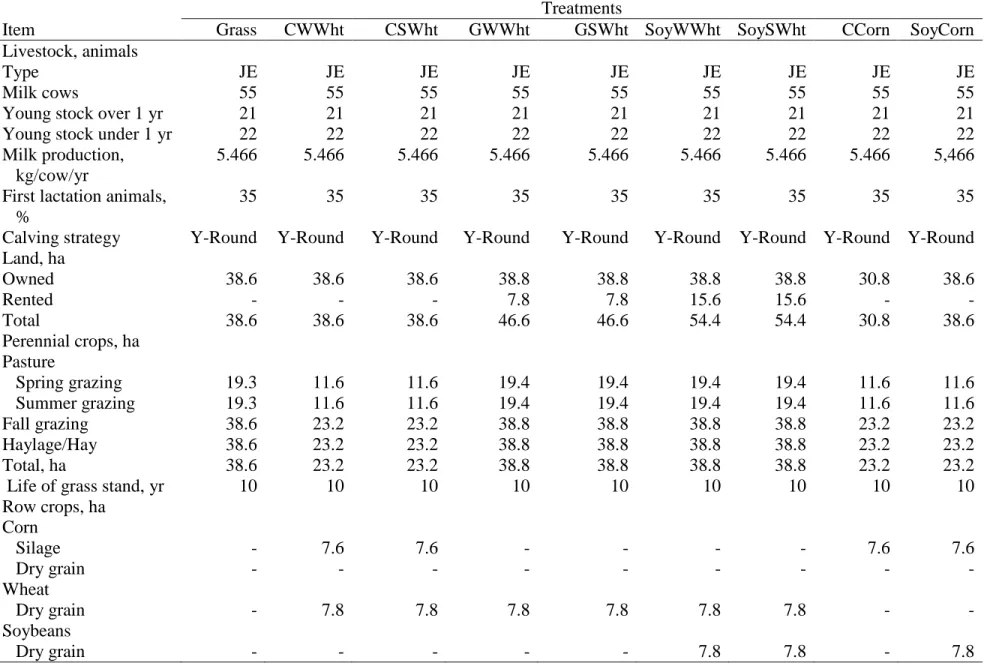
The effects of various crop rotations were evaluated on a representative well-managed medium-sized organic dairy farm in Maine (Table 2). The soil was a shallow loam with an available water holding capacity of 80 mm. Simulations of the farm performance were done for 26 years (1983 to 2008) of observed weather data for Waterville, Maine (National Climatic Data Center 2013). Crop and pasture growth and yield are predicted daily in metric tons (t), based on soil water and nutrient availability, temperature, and solar radiation.
Organic Crops
The medium-sized farm consisted of 38.8 ha of owned land. Crop rotations are represented in Table 1, with wheat rotated in at 7.8 ha each year. Those cropping system areas were estimated to meet most of the forage needs of the herd during most of the weather years. However, when the cropping system was not able to meet the forage needs, rented land was added in order to have no forage purchases (Table 2).
12
The corn variety had an 83-day relative maturity index at a population of 81,550 plants/ha. Most of the manure from the herd (65%) was applied to the corn land when it was cultivated (Table A2). Corn was planted in May 27 and harvested as silage in September 18 to represent early season or October 7 to represent full season (Table A1). Harvest occurred on days at or beyond those dates when the weather and soil conditions were suitable.
Grass stand composition considered were 40% of rye grass (cool-season) and 60% of red clover (legume). Grass was harvested using a three-cut strategy where each cutting began at early head stage of development which occurs around 50 days between cuts. Yields varied between crop rotations due to differences in the timeliness of planting and harvested. Silos were sized so that the portion of the herds forage requirement was met over all simulation years.
Feed storage facilities (Table A6) included a bunker silo for storing corn silage (150.00 t of DM). Grass was stored as bale silage (240.00 t of DM) and dry hay (45 and 20 t of DM). Manure (12-14% DM) was collected using hand scraping with gutter cleaners and incorporated by tillage within two days to reduce volatile N loss. Manure was stored up to 4 months in a top loaded concrete tank. Bedding used was sawdust at a rate of 4.08 kg/cow/day (Table A8).
The tillage for wheat and soybean crops involved moldboard/chisel-plowing followed by tandem disking, field-cultivating/conditioner and planting. Rotary hoes were used on soybeans two times for weed control. Corn was tandem disked, planted and rotary hoed (Table A1).
Livestock
13
were housed in a tie stall barn; cows were milked using a pipeline system (Table A7). The cull rate of the herd was 35%, which set the number of first-lactation animals to 19.
Feed Crops
A mobile feed mixer (round, dump and grain wagons) was used to prepare total mixed rations for animals (Table A5). Feeding method for grain and silage were hand feeding; dry hay was self-fed in a hay feeder (Table A7). The feed rations were formulated to exceed the NRC requirements of each animal, which is common practice on current dairy farms. The minimum dry hay ratio was 10% of forage, with high relative forage to grain ratio, soybean (44% of CP) as crude protein supplement and soybean seed (roasted) as undegradable protein/full fat supplement (Table A7).
Equipment and Structures
Machinery and facilities were typical of those used in the region (Table A5). Most of the equipment used on the farm was purchased new and amortized over 10 years. Perennial forage planting as well as planting of wheat were all assumed to be completed with a no-till grain drill. Soybeans were planted with a corn planter. Perennial forages and corn silage were harvested with the same forage harvester.
14 Prices
Prices were held constant across all simulations so that economic differences across years were solely due to weather effects on farm performance. A real interest rate (approximately nominal rate minus inflation) of 6% per year was assumed on investments. Prices received for milk, cull cows, heifers, and calves were based on prior surveys of Maine organic dairy farmers (Dalton et al. 2008, Cook et al. 2010). Prices received for any crop used data from USDA National Agriculture Statistics Service (2013), and it was considerate average of 5 years from 2008 (Table A9). Milk hauling and marketing costs were based on the 2006 survey for Maine and Vermont (Dalton et al. 2008). Other livestock costs such as breeding, veterinary, insurance, and dues were from the most recent cost-of-production survey for Maine (Cook et al. 2010). The commodity selling prices for organic was also obtained from USDA National Agricultural Statistics Service (2013), with a five year average used (Table 6).
Prices for Midwest organic soybeans and corn grain were increased to include transportation to Maine. Soybean price ($35/t of DM) was increased to include roasting. The estimated price per t of DM for organic was $959 and the price of corn grain $379 (Table A9). The IFSM default seed costs for new ($270/ha) and reseeded ($20/ha) grassland were used. Seed costs for organic corn, winter wheat, and soybeans were obtained from a local livestock supply dealer used by organic dairy farms in Maine.
Sensitivity Analyses
15
16 RESULTS
The average of 25 years of crop performance (feed production and quality), nutrient losses and accumulations, and production costs and farm net return were compared between the continuous grass and crop rotation strategies simulated. All of the winter and spring wheat considered and included in all crop rotation strategies were sold as a dry grain cash crop.
Crop Rotation Production
The grass and all crops had similar biomass production per hectare (Table 3). However, winter wheat yielded about 9% better than spring wheat and corn silage yielded 7% more for the soybean-corn-grass rotation (Table 3). When wheat was rotated with soybeans (soybean-wwheat-grass and soybean-swheat-grass), winter and spring wheat yielded more (2.60 t DM/ha and 2.39 ton DM/ha respectively). Corn, however, yielded less t DM/ha when rotated with winter (9.57) or spring (10.09) wheat compared to rotation with double corn (10.09) and soybeans (10.88).
17
et al. 1994). Moreover, winter wheat is planted in September and harvested in July; thus, this time provides better benefits to plants by developing high root biomass and deep rooting structure (David et al. 2005) that allows winter wheat to perform better.
The 25-yr average nutrient concentrations in the simulated crop were constant (Table 4). In wheat, winter or spring dry grains were 13.3% CP and 32.0% NDF, and no quality difference between winter or spring wheat were simulated. According to Mallory and Darby (2013), a grain protein content of 12% CP or greater is desired on the bread wheat market. It was expected spring wheat would have higher CP than winter wheat because winter wheat is more susceptible to N deficiency since pre-plant N applications are prone to leaching over the winter and early spring. However, this difference was not simulated, and both winter and spring wheat met the grain protein standard (baking quality standard) for the high-quality bread wheat market.
Corn silage yields tended to be lower with wheat in the rotation (Table 3), but nutrient concentrations were 9% CP and 47% NDF, which is considered high. Soybean grain nutrient concentrations were 42.8% CP and 15.0% NDF. Ryegrass/red clover that was harvested as hay and haylage had nutrient concentrations of 32% CP and 36.4% NDF, which are considered high quality forage and potentially reduced concentrated feed purchases (Table 3). A comparison of the nine cropping systems indicates that continuous grass and corn rotations can support forage animal requirements without substantial increases in land area on medium-sized organic dairy farms (Table 2).
Environmental
18
decreased the energy footprint by 0.29 (13%) and C footprint (with biogenic CO2) by 0.06 (8%).
CH4 release was high (190 kg/ha/yr), but C imported through grass photosynthetic fixation
during grass growth offset much of the emissions; thus, decreasing the C footprint.
Winter and spring wheat had similar impacts on the farm. The major effect on the nutrient flows was a 0.8 kg/ha/yr in P runoff and leachate losses (17%), a 0.8 kg/ha/yr K accumulation (17%) and a 1.0 water footprint (4%) reduction through the use of winter wheat. CH4 losses were reduced when grass or soybean were used in rotation due to the increased N
contents in diets that let the animals produce less CH4.
Harvest and feeding of corn silage had several environmental impacts on the farm when corn cropping rotations are compared to other crop rotations. First, N volatilization, leaching and denitrification losses (kg/ha/yr) increased by 30.18 (30%), 1.03 (3%) and 2.15 (9%), when corn silage was double-cropped (corn-corn-grass). Second, P runoff and leachate losses increased by 1.28 kg/ha/yr (58%); however, P accumulation increased by 32.40 kg/ha/yr (693%). Third, K loss through runoff was 3.00 kg/ha/yr (33%), but K accumulation increased by 43.03 kg/ha/yr (576%). Fourth, CH4 increased by 44.82 kg/ha/yr (30%) and C losses through runoff by 0.43
kg/ha/yr (72%). Finally, environmental footprints (kg/kg of FPCM) increased 81.50 (31%) for water and 0.05 (7%) for carbon. The higher nutrient losses were driven by heavy application of manure on corn land.
19
was reduced by 0.10 kg/ha/yr (39%), K accumulation increased by 1.35 kg/ha/yr (20%). The energy and carbon footprints were reduced by 11% and 8% respectively.
Comparison of the nine cropping systems indicates that continuous grass decreased environmental impact through nutrient cycling. The results indicate that conversion of perennial grassland to tilled cropland increases greenhouse gas emissions.
Economics
Continuous grass was at least 166% more profitable compared to all others cropping rotation strategies (Table 6). In this scenario the total annual revenue was lowest ($200,330) because the income is based on milk and animals sold, but total annual cost was also lowest ($159,512) thus makes the strategy profitable with a high farm net return ($742.15/cow). This system had a competitive edge due to the lower equipment costs ($33,089) required to operate the system which requires capital investments in equipment and storage facilities. Averaged over all weather years, 68 t DM of grain and 11 t DM of soybean roasted were purchased annually to meet feed nutrient requirements (Table 3). Thus, concentrated feed purchases (Table 6) were higher ($42,698) due to energy and protein requirements for each animal group and lower protein degradability in the grass. Results were consistent with prior research (Hoshide et al. 2011), which suggested grass-based organic dairy models are more or as economically competitive compared to corn-based ones until farms have over 120 milk cows.
20
bedding. Annual costs of land rental were added when corn (corn-wwheat-grass, corn-swheat-grass) was replaced by grass (grass-wwheat-grass, grass-swheat-corn-swheat-grass) and soybeans (soybean-wwheat-grass, soybean-swheat-grass); but, in general, the income from wheat grain sales (cash crop) and the reduction in bedding cost more than offset these increased costs related to land rental, increasing net farm income ($2,346) and net return per cow ($43) by 21%.
Use of corn harvested as silage in place of grass or/and soybean in the first year or winter/spring wheat in the second year provided relatively less profitability to the farm. When corn was replaced by grass in the first year, net return increased from $14 to $225/cow/yr. When corn was replaced by winter/spring wheat in the second rotation year, net return increased from $217 to $427/cow/yr. Compared to grass and wheat, producing and feeding corn silage requires a lot more energy, seed/manure and straw bedding for a medium-sized farm; these cost increases were not offset by enough farm income due to a lack of economies of scale thus decreasing annual net return (Table 6).
Use of soybeans in addition to corn improved economic performance to the farm. Annual per unit costs for machinery, fuel, labor, feeding (roasting soybeans) and facilities all decreased since these costs were shared across more crops. Annual net returns increased from $7,978 to $16,183 and net return per cow from $145 to $294/cow/yr.
21
were met without purchasing extra soybeans (meal or roasted; Table 3). However, when wheat was rotated without soybean, the farm was largely dependent of external protein resources to meet herd requirements which had to be paid for through wheat cash crop sales (Table 6). Corn decreased profitability in all cropping systems simulated, likely due to a lack of economies of scale for medium-sized organic farms to generate enough income to cover the added capital investment and supplemental protein requirements for corn-based forage systems (Hoshide et al. 2011).
Sensitivity Analyses
Wheat Prices. Income over costs ranged from -$14,356 to $44,911 when wheat was sold as a cash crop. Corn-wwheat-grass and corn-swheat-grass were the only rotations that had negative NFI if prices fluctuated (Table 7). In corn-swheat-grass the NFI become negative at a 17% price decrease, whereas for corn-wwheat-grass, NFI became negative at a 33% price decrease. Scenarios that includes soybeans in rotation were always more profitable or lost less money than others scenarios. Moreover, grass rotated with winter or spring wheat was more profitable then all corn rotated with wheat over all simulated prices.
Milk prices. A second sensitivity analysis changed organic milk prices from $37.91 to $88.45/hL. Corn-wwheat-grass, corn-swheat-grass, grass-swheat-grass and soybean-corn-grass scenarios were not profitable if milk prices were reduced 5%. Furthermore, only the continuous grass scenario was profitable if milk price was 20% less.
22
23 DISCUSSION
This study focuses not on the relative profitability of grass- versus corn-based systems but rather the relative profitability of organic dairy farms integrating organic wheat into their rotations to harvest as grain to meet surging local demand for bread made from locally produced wheat in the Northeast, U.S. While there are demonstrated environmental benefits to including wheat in both grass-based and corn-based organic dairy farm rotations, the current typical organic dairy farm size (60 milk cows) modeled in Maine did not have the scale efficiency to be as economically competitive compared to baseline models without winter wheat. Assuming scale efficiencies of growing and using row crops such as corn, wheat, and soybeans are applicable to larger farm model sizes (i.e. 120 and 220 milk cows), our research suggests some key insights into how organic dairy farmers in Maine could profit more from and benefit from including winter wheat for grain in their cropping rotations.
Organic dairy farmers could improve profits by 1) growing more wheat (15.6 to 28.6 ha) than currently modeled (7.8 ha), 2) sharing planting and harvesting equipment between growers, or 3) sub-contracting organic wheat grain production to a specialized grower focusing exclusively on wheat. Expansion of wheat production may be difficult due to land constraints. Sharing equipment has historically been done by clusters of dairy farmers in Maine growing their own concentrated feed crops like corn grain and soybeans, but this may be impractical due to short optimal windows of crop planting and harvest. Specialized wheat production by other
24
dairy farms, a potential conflict exists of winter wheat harvest (late-July to early-August) with second-cut grass (July 15) especially if this cut is delayed.
Even though the profitability of including winter wheat in organic dairy farm models is relatively lower than other rotation options, there are other benefits to consider in addition to improved nutrient cycling highlighted in this analysis. First, many organic dairy farmers in
wheat in the rotation as a way to break- from year to year.
Although silage corn is traditionally rotated over longer time horizons with grass (i.e. C-C-C-C-C-G-G-G-G-G-G over 10 years), planting corn year after year is not in adherence with organic principles (Lotter 2003, Mohler and Johnson 2009). Second, even though whole-farm returns may be lower for modeled systems with wheat, baking quality winter wheat can diversify and stabilize farm income, especially given recent post-recession production quotas and milk price reductions instituted by organic milk processors. Finally, integrating winter wheat into crop rotations can take advantage of manure fertility and nutrient inputs from imported certified organic concentrated feeds from Canada and the Midwest. To maintain adequate protein content, growing winter wheat in a purely non-integrated cropping system without easy access to manure nutrients requires fertility inputs that are more difficult to manage for nutrients (chicken manure) or that are more expensive (such as non-GM soy meal or fish meal).
25
or 2) roasting prior to feeding. There are no industrial extrusion plants in Maine with the closest one being in New Brunswick which processes conventional (not organic) soybeans. Maine conventional dairy farms have shared soybean roasters in the past. While a roaster has more time flexibility when it comes to sharing compared to a combine, the aforementioned production and
26
CONCLUSIONS
27
ACKNOWLEDGMENTS
The authors appreciate the assistance received from Dr. Alan Rotz from ARS-USDA, the Organic Research and Extension Initiative, and Dr. Andre Brito at the University of New Hampshire (UNH). The lead author would also like to thank the Brazilian government and people as well as the Universidade Federal de Viçosa for supporting his study abroad to UNH and the University of Maine, U.S. to conduct crop livestock integrated modelling in IFSM. This research is based upon work supported by the Research, Education and Economics Information System, U.S. Department of Agriculture, under Agreement No.
28
REFERENCES
Badaruddin, M., and D.W. Meyer. 1994. Grain legume effects on soil nitrogen, grain yield, and nitrogen nutrition of wheat. Crop Sci. 34:1304-1309.
Carcea, M., S. Salvatorelli, V. Turfani and F. Mellara. 2006. Influence of growing conditions on the technological performance of bread wheat (Triticum aestivum L.). Int. J. Food Sci. Technol. 41:102-107.
Cederber, C. and B. Mattsson. 2000. Life cycle assessment of milk production - a comparison of conventional and organic farming. J. Cleaner Prod. 8:49-60.
Cook, A. L., P. S. Heacock, G. K. Criner and L. A. Bragg. 2010. Organic milk production in Maine: Attributes, costs, and returns. Maine Agric. and Forest Exper. Stat. Tech. Bull. No. 204. University of Maine, Orono, ME.
Dalton, T. J., R. Parsons, R. Kersbergen, G. Rogers, D. Kauppila, L. McCrory, L. A. Bragg and Q. Wang. 2008. A comparative analysis of organic dairy farms in Maine and Vermont: Farm Financial Information from 2004 to 2006. Maine Agric. and Forest Exper. Stat. Bull. No. 851. University of Maine, Orono, ME.
David, C. J., M. H. Jeuffroy, J. Henning and J. M. Meynard. 2005. Yield variation in organic winter wheat: A diagnostic study in the southeast of France. Agro. Sust. Dev. 25:213-223. David, C., J. Abecassis, M. Carcea, F. Celette, J. K. Friedel, G. Hellou, J. Hiltbrunner, M.
29
Hoshide, A. K., J. M. Halloran, R. J. Kersbergen, T. S. Griffin, S. L. DeFauw, B. J. Lagasse, S. Jain. 2011. Effects of stored feed cropping systems and farm size on the profitability of Maine organic dairy farm simulations. J. Dairy Sci. 94:5710-5723.
Lotter, D.W. 2003. Organic agriculture. J. Sust. Agric. 21:59-128.
Mäder, P., D. Hahn, D. Dubois, L. Gunst, T. Alföldi, H. Bergmann, M. Oehme, R. Amado, H. Schneider, U. Graf, A. Velimirov, and U. Niggli. 2007. Wheat quality in organic and conventional farming: Results of a 21 year field experiment. J. Sci. Food Agric. 87:1826-1835.
Mallory, E.B. and H. Darby. 2013. In-season nitrogen effects on organic hard red winter wheat yield and quality. Agron. J. 105:1167-1175.
McBride, W. D. and C. Greene. 2009. Characteristics, costs, and issues for organic dairy farming. Econ. Res. Rep. No. 82. USDA-ERS, Washington, DC.
Mohler, C. L. and S. E. Johnson. 2009. Crop rotation on organic farms: a planning manual. Natural Resource, Agric., and Eng. Serv. (NRAES), Ithaca, NY.
National Climatic Data Center. 2013. National Climatic Data Center, National Oceanic and Atmospheric Administration (NOAA) Satellite and Information Service. Accessed Jan 10, 2013. http://www.ncdc.noaa.gov/oa/ncdc.html.
K. and R. L. Parsons. 2013. The economic value of organic dairy farms in Vermont and Minnesota. J. Dairy Sci. 96:6117-6126.
30
Rotz, C. A., D. R. Buckmaster, D. R. Mertens and J. R. Black. 1989. DAFOSYM: A dairy forage system model for evaluating alternatives in forage conservation. J. Dairy Sci. 72:3050-3063. Rotz, C.A., G. W. Roth and W. L. Stout. 2002. Economic and environmental implications of
small grain production and use on Pennsylvania dairy farms. Appl. Eng. Agric. 18:417-428. Rotz, C.A., G. W. Roth, K. J. Soder and R. R. Schnabel. 2001. Economic and environmental
implications of soybean production and use on Pennsylvania dairy farms. Agro. J. 93:418-428.
Rotz, C.A., L. D. Satter, D. R. Mertens and R. E. Muck. 1999. Feeding strategy, nitrogen cycling, and profitability of dairy farms. J. Dairy Sci. 82:2841-2855.
Schomberg, H. H., J. L. Steiner and P. W. Unger. Decomposition and nitrogen dynamics of crop residues: Residue quality and water effects. Soil Sci. Soc. Am. J. 58:372-381.
Underwood, T., C. McCullum-Gomez, A. Harmon and S. Roberts. 2011. Organic agriculture supports biodiversity and sustainable food production. J. Hunger Environ. Nutr. 6:398-423. USDA - National Agriculture Statistics Service. 2013. Quick Stats. US Department of
Agriculture, National Agricultural Statistics Service, Washington, DC. Accessed November 10, 2013. http://www.nass.usda.gov/Data_and_Statistics/Quick_Stats/Lite/
Wesley R.A., L. G. Heatherly, C. D. Elmore and S. R. Spurlock. 1995. Net returns from eight nonirrigated cropping systems on clay soil. J. Prod. Agric. 8:514-520.
31 Table 1. Representative organic dairy cropping system trial
Treatment Cropping sequence Rotation - yr 1 Rotation - yr 2 Rotation - yr 3-5
Grass continuous grass ryegrass/red clover ryegrass/red clover ryegrass/red clover
CWWht corn-wwheat-grass corn silage winter wheat ryegrass/red clover
CSWht corn-swheat-grass corn silage spring wheat ryegrass/red clover
GWWht grass-wwheat-grass ryegrass/red clover winter wheat ryegrass/red clover
GSWht grass-swheat-grass ryegrass/red clover spring wheat ryegrass/red clover
SoyWWht soybean-wwheat-grass soybean winter wheat ryegrass/red clover
SoySWht soybean-swheat-grass soybean spring wheat ryegrass/red clover
CCorn corn-corn-grass corn silage corn silage ryegrass/red clover
SoyCorn soybean-corn-grass soybean corn silage ryegrass/red clover
32
Table 2. Organic dairy livestock inventory, milk production, area for perennial crops and row crops Treatments
Item Grass CWWht CSWht GWWht GSWht SoyWWht SoySWht CCorn SoyCorn
Livestock, animals
Type JE JE JE JE JE JE JE JE JE
Milk cows 55 55 55 55 55 55 55 55 55
Young stock over 1 yr 21 21 21 21 21 21 21 21 21
Young stock under 1 yr 22 22 22 22 22 22 22 22 22
Milk production, kg/cow/yr
5.466 5.466 5.466 5.466 5.466 5.466 5.466 5.466 5,466
First lactation animals, %
35 35 35 35 35 35 35 35 35
Calving strategy Y-Round Y-Round Y-Round Y-Round Y-Round Y-Round Y-Round Y-Round Y-Round Land, ha
Owned 38.6 38.6 38.6 38.8 38.8 38.8 38.8 30.8 38.6
Rented - - - 7.8 7.8 15.6 15.6 - -
Total 38.6 38.6 38.6 46.6 46.6 54.4 54.4 30.8 38.6
Perennial crops, ha Pasture
Spring grazing 19.3 11.6 11.6 19.4 19.4 19.4 19.4 11.6 11.6
Summer grazing 19.3 11.6 11.6 19.4 19.4 19.4 19.4 11.6 11.6
Fall grazing 38.6 23.2 23.2 38.8 38.8 38.8 38.8 23.2 23.2
Haylage/Hay 38.6 23.2 23.2 38.8 38.8 38.8 38.8 23.2 23.2
Total, ha 38.6 23.2 23.2 38.8 38.8 38.8 38.8 23.2 23.2
Life of grass stand, yr 10 10 10 10 10 10 10 10 10
Row crops, ha Corn
Silage - 7.6 7.6 - - - - 7.6 7.6
Dry grain - - - -
Wheat
Dry grain - 7.8 7.8 7.8 7.8 7.8 7.8 - -
Soybeans
33
Table 3. Total crop yields, sold and purchased feeds and supplements (tone of dry matter), and crop productivity over 25 year analysis of different crop rotations (ton DM / ha)
Treatments
Item Grass CWWht CSWht GWWht GSWht SoyWWht SoySWht CCorn SoyCorn
Farm crop production, (t DM)
High-quality hay 64 38 37 64 64 64 64 38 37
Low-quality hay 1 1 1 1 1 1 1 1 1
High-quality silage 97 59 59 97 97 97 97 59 59
Low-quality silage - - - -
Grain crop silage - 56 58 - - - - 58 59
Dry grain - 16 14 19 17 20 19 - -
Stover and straw - 29 23 34 27 37 29 - -
Grazed forage consumed
115 106 106 115 115 115 115 107 106
Purchases, (t DM)
Forage - - - -
Grain 68 93 94 70 70 70 70 93 93
Soybean meal, 44% - - - -
Soybean seed, roasted 11 5 5 12 12 - - 5 -
Mineral & vitamins 2 2 2 2 2 2 2 2 2
Sales
Forage 0 0 0 0 0 0 0 0 0
Soybeans - - - 2 2 - 9
Wheat - 16 14 19 17 20 19 - -
Crop performance, (t DM/ha)
Grass1 10.25 10.23 10.23 10.25 10.25 10.25 10.25 10.23 10.23
Corn Silage - 9.57 10.09 - - - - 10.09 10.88
Wheat2 - 2.02 1.86 2.37 2.17 2.60 2.39 - -
Soybeans - - - 1.84 1.84 - 1.84
1
34 Table 4. Average of nutritive contents (% of dry matter) of crops
Treatments (Crop Rotations)
Grass CWWht CSWht GWWht GSWht SoyWWht SoySWht CCorn SoyCorn
Crop CP NDF CP NDF CP NDF CP NDF CP NDF CP NDF CP NDF CP NDF CP NDF
Grass, hay/haylage
32.0 36.4 32.0 36.4 32.0 36.4 32.0 36.4 32.0 36.4 32.0 36.4 32.0 36.4 32.0 36.4 32.0 36.4
Corn, silage - - 9.5 47.7 9.4 46.1 - - - 9.4 46.1 9.4 46.0
Winter wheat, grain
- - 13.3 32.0 - - 13.3 32.0 - - 13.3 32.0 - - - -
Summer wheat, grain
- - 13.3 32.0 - - 13.3 32.0 - - 13.3 32.0 - - - -
Soybeans, grain
35
Table 5. A comparison of environmental impacts for organic dairy rotations.
Treatments (Crop Rotations)
Item Grass CWWht CSWht GWWht GSWht SoyWWht SoySWht CCorn SoyCorn
Nutrient flows (kg/ha)
Nitrogen imported 582.9 458.1 456.7 499.5 499.0 440.1 440.2 560.9 489.8
Nitrogen exported 76.1 81.7 79.8 71.7 71.0 65.3 64.7 91.5 92.5
Nitrogen lost by volatilization 104.0 87.5 86.5 88.0 87.8 77.5 77.5 109.0 90.4
Nitrogen lost by leaching 254.0 187.4 187.1 211.9 211.5 184.8 184.9 241.8 200.8
Nitrogen lost by denitrification 30.5 23.9 23.5 25.5 25.2 22.4 22.2 30.7 25.8
Phosphorous imported 12.0 46.7 44.9 12.4 11.8 16.5 16.5 56.5 50.0
Phosphorous exported 10.1 11,6 11.4 9.9 9.8 8.9 8.8 12.7 12.1
Phosphorus loss-runoff/leachate 0.2 0.5 0.5 0.2 0.3 0.3 0.4 0.4 0.5
Phosphorus soil build up 1.7 34.6 32.9 2.3 1.8 7.2 7.4 43.4 37.4
Potassium imported 60.9 70.9 73.1 36.0 39.3 31.6 35.2 109.1 91.4
Potassium exported 21.9 22.0 21.3 20.0 19.8 18.1 18.0 25.3 25.4
Potassium loss through runoff 11.4 11.3 11.2 9.6 9.6 8.6 8.6 14.1 11.8
Potassium soil build up 27.6 37.6 40.5 6.4 9.9 5.0 8.6 69.7 54.2
Carbon imported 14,543.4 13,154.3 12,339.7 13,683.4 13,056.5 12,437.8 11,916.0 13,240.9 12,942.6
Carbon exported 806.3 962.5 941.0 829.3 815.6 741.8 729.9 1,003.9 928.2
Carbon loss as carbon dioxide 13,546.2 12,015.7 11,222.6 12,695.4 12,082.0 11,559.7 11,049,8 12,016.6 11,832.4
Carbon loss as methane 190.7 175.1 174.9 158.3 158.3 135.6 135.6 219.6 180.8
Carbon loss through runoff 0.2 1.0 1.1 0.5 0.5 0.7 0.7 0.9 1.1
Water footprint without rainfall, kg/kg FPCM1
307 317 328 256 269 253 267 361 365
Reactive nitrogen footprint, g/kg FPCM
35.08 26.77 26.67 35.28 35.23 35.97 36.01 27.28 27.42
Energy footprint, MJ/kg FPCM 1.92 2.22 2.26 2.10 2.14 2.36 2.40 2.07 2.44
Carbon footprint with biogenic CO2, kg/kg FPCM
0.64 0.72 0.72 0.65 0.65 0.71 0.71 0.72 0.76
1
36 Table 6. Organic dairy total revenues, costs, and profits
Treatments (Crop Rotations)
Item Grass CWWht CSWht GWWht GSWht SoyWWht SoySWht CCorn SoyCorn
Farm Revenues, US$
Milk 186,895 189,708 189,594 186,899 186,899 186,899 186,899 189,700 189,612
Feed 2,008 12,307 11,353 14,260 13,209 17,603 16,528 1,946 10,098
Animal 11,427 11,427 11,427 11,427 11,427 11,427 11,427 11,427 11,427
Total revenue 200,330 213,442 212,374 212,586 211,535 215,929 214,854 203,073 211,137 Costs, US$
Equipment 33,089 90,649 90,659 82,237 82,237 85,100 85,100 49,861 88,371
Facilities 24,609 26,349 25,619 24,609 24,609 24,727 24,727 26,368 25,684
Energy 5,736 5,864 5,785 6,181 6,070 6,885 6,763 5,404 5,850
Labor 34,425 34,379 34,309 34,854 34,858 35,216 35,216 33,662 34,083
Seed, fertilizer 1,746 3,321 3,321 3,047 3,047 5,597 5,597 2,020 4,519
Land rental - - - 964 964 1,156 1,156 - -
Purchased feeds/bedding 42,698 33,822 35,405 29,808 31,477 15,190 16,932 46,224 33,767 Livestock expense 11,985 11,985 11,985 11,985 11,985 11,985 11,985 11,985 11,985
Milk hauling and fees 3,095 3,144 3,143 3,097 3,097 3,097 3,097 3,144 3,142
Property tax 2,129 2,273 2,224 2,129 2,129 2,129 2,129 2,051 2,187
Total costs 159,512 211,786 212,449 198,911 200,473 191,082 192,702 180,719 209,588 Net Returns, US$
Net farm income (NFI) 40,818 1,656 (75) 13,675 11,062 24,847 22,152 22,354 1,549 Net return per cow over
feed costs 1,896 983 908 1,127 1,110 1,263 1,245 1,571 1,044
Net return per cow over
income 742.15 30.11 (1.36) 248.64 201.13 451.76 402.76 406.44 28.16
37
Table 7. Sensitivity analyses of changing wheat selling price and milk price on net farm income (NFI) Treatments (Crop Rotations)
Item Grass CWWht CSWht GWWht GSWht SoyWWht SoySWht CCorn SoyCorn
Wheat price, US$/t DM
+75% $1,157 ($1,150/t DM) - 17,239 14,183 32,023 27,834 44,911 40,604 - -
+50% $991 ($900/t DM) - 12,020 9,408 25,877 22,216 38,191 34,424 - -
+33% $881 ($800/t DM) - 8,561 6,243 21,805 18,494 33,738 30,328 - -
+17% $771 ($700/t DM) - 5,103 3,078 17,733 14,772 29,285 26,233 - -
$661 ($600/t DM) - 1,656 (75) 13,675 11,062 24,847 22,152 - -
-17% $551 ($500/t DM) - (1,814) (3,250) 9,589 7,327 20,379 18,042 - -
-33% $441 ($400/t DM) - (5,273) (6,415) 5,517 3,605 15,926 13,947 - -
-50% $331 ($300/t DM) - (8,731) (9,580) 1,445 (117) 11,473 9,852 - -
-75% $165 ($160/t DM) - (13,951) (14,356) (4,699) (5,734) 4,753 3,673 - -
Milk price, US$/hL($/cwt)
+40% $88.45 ($38.88/cwt) 113,061 78,110 76,587 85,890 83,275 95,132 94,384 98,227 79,036 +30% $82.13 ($36.10/cwt) 94,370 59,132 57,608 67,200 64,584 76,436 75,694 79,251 60,055 +20% $75.82 ($33.33/cwt) 75,709 40,185 38,659 48,540 45,924 57,770 57,034 60,305 41,104 +10% $69.50 ($30.55/cwt) 57,018 21,208 19,680 29,851 27,235 39,075 38,345 41,329 22,123 +5% $66.34 ($29.16/cwt) 47,673 11,719 10,190 20,506 17,890 29,727 29,000 31,841 12,632 $63.18 ($27.77/cwt) 40,818 1,656 (75) 13,675 11,062 24,847 22,152 22,354 1,549 -5% $60.02 ($26.38/cwt) 28,982 (7,258) (8,789) 1,817 (799) 11,031 10,311 12,865 (6,349) -10% $56.86 ($24.99/cwt) 19,637 (16,747) (18,279) (7,528) (10,144) 1,683 966 3,377 (15,839) -20% $50.54 ($22.21/cwt) 946 (35,724) (37,258) (26,217) (28,833) (17,013) (17,723) (15,599) (34,820) -30% $44.23 ($19.44/cwt) (17,716) (54,673) (56,207) (44,877) (47,493) (35,679) (36,383) (34,545) (53,771) -40% $37.91 ($16.66/cwt) (36,406) (73,649) (75,186) (63,567) (66,188) (54,375) (55,073) (53,521) (72,753)
38
SUPPLEMENTAL MATERIALS
Appendix
Table A1. Dates for production operations
Grass Corn Wheat Soybean
Operations Hay Haylage Pasture Silage Spring Winter Dry Grain
Moldboard/Chisel plow - - - - April 26 Sept 10 May 15
Tandem disk - - - May 14 April 29 Sept 13 May 30
Field cultivator/conditioner - - - - April 29 Sept 13 Jun 5
Planting - - - May 27 May 1 Sept 15 Jun 10
Rotary hoe
First - - - July 9 - - Jun 11
Second - - - Jun 13
Harvest
First grass - May 31 - - - - -
Second grass July 15 - - - -
Third grass - Aug 25 - - - - -
Early corn - - - Sept 18 - - -
Full season corn - - - Oct 7 - - -
Winter wheat - - - July 27 -
Spring wheat - - - - Aug 25 - -
39
Table A2. Manure application rates (wet manure - 82.1% moisture) applied to each crop Treatments
Grass CWWht CSWht GWWht GSWht SoyWWht SoySWht CCorn SoyCorn
Manure application, %
Grass 100 15 15 80 80 65 65 35 20
Corn - 65 65 - - - - 65 65
Wheat - 20 20 20 20 20 20 - -
Soybean - - - 15 15 - 15
Manure application, t
Grass 688 104 104 553 553 449 449 139
Corn - 449 452 - - - - 451
Wheat - 138 139 138 138 138 138 -
Soybean - - - 111 111 123
Imported
Type - poultry poultry poultry poultry poultry poultry poultry
40 Table A3. Crop nutrient requirements (kg/ha)
Tmt --- Grass1 --- --- Corn --- --- Wheat --- - Soybean ----
N P2O5 K2O N P2O5 K2O N P2O5 K2O P2O5 K2O
Grass 335 48 215 - - - -
CWWht 399 61 274 146 48 110 68 22 116 - -
CSWht 399 61 274 152 51 116 60 20 95 - -
GWWht 335 48 215 - - - 81 26 137 - -
GSWht 335 48 215 - - - 70 23 109 - -
SoyWWht 335 48 215 - - - 77 25 120 30 44
SoySWht 335 48 215 - - - 77 25 120 30 44
CCorn 335 61 275 146 48 110 - - - - -
SoyCorn 399 61 274 - - - 30 44
1
Established grass
Manure nutrient content (% DM): 3.82-N / 2.25-P2O5 / 4.86-K2O (Tmt A) 3.78-N / 2.17-P2O5 / 4.81-K2O (Tmt B) 4.02-N /
1.04-P2O5 / 5.04-K2O (Tmt C) 4.00-N / 1.01-P2O5 / 5.03-K2O (Tmt D) 4.19-N / 1.44-P2O5 / 5.22-K2O (Tmt E) 3.94-N / 0.91-P2O5 /
4.99-K2O (Tmt G) 3.81-N / 2.33-P2O5 / 4.85-K2O (Tmt H).
41 Table A4. Soil characteristics (IFSM default)
Soil attributes Shallow Clay Loam
Available water holding capacity, mm 59.995
Fraction of available water when stress begins
0.500
Bare soil albedo 0.110
Soil evaporation coefficient, mm 5.994
Moist bulk density of soil, g/cm3 1.200
Organic carbon concentration, % 1.800
Particle content, %
Silt 45.000
Clay 45.000
Sand 10.000
Runoff curve number w/ row crops 87.000
Whole profile drainage rate coefficient 0.350
pH 6.3
Exchangeable acidity 3.500
---Tractability Coefficients Upper Soil Lower Soil
Spring tillage and planting 0.950 0.970
Fall tillage and planting 1.020 1.030
42 Table A5. Machinery inventory for all operations
Treatments
Equipment parameters Grass CWWht CSWht GWWht GSWht SoyWWht SoySWht CCorn SoyCorn Harvest/Feeding,
type/size
Mowing 9ft 9ft 9ft 9ft 9ft 9ft 9ft 9ft 9ft
Tedding 16ft 16ft 16ft 16ft 16ft 16ft 16ft 16ft 16ft
Raking 9ft 9ft 9ft 9ft 9ft 9ft 9ft 9ft 9ft
Baling S S S S S S S S S
Bale wrapping S S S S S S S S S
Forage chopping M M M M M M M M M
Grain harvesting S S S S S S S S S
Feed mixing S S S S S S S S S
Silo filing Tillage/Planting
Manure handling M M M M M M M M M
Plowing 4-18in 4-18in 4-18in 4-18in 4-18in 4-18in 4-18in 4-18in 4-18in
Disking 15ft 15ft 15ft 15ft 15ft 15ft 15ft 15ft 15ft
Field cultivation 12ft 12ft 12ft 12ft 12ft 12ft 12ft 12ft 12ft
Hoeing 15ft 15ft 15ft 15ft 15ft 15ft 15ft 15ft 15ft
Row crop planting - 6 6 6 6 6 6 6 6
Drill seeding - 10ft 10ft 10ft 10ft 10ft 10ft 10ft 10ft
Miscellaneous, tractor/type
Transport Tractor 47 47 47 47 47 47 47 47 47
Feed/Manure Loaders 67 67 67 67 67 67 67 67 67
Round Bale Loader 67 67 67 67 67 67 67 67 67
Transport of Feed
Hay Round Round Round Round Round Round Round Round Round
Hay Crop Silage Dump Dump Dump Dump Dump Dump Dump Dump Dump
43 Table A6. Storage structures
Treatments
Structures Grass CWWht CSWht GWWht GSWht SoyWWht SoySWht CCorn SoyCorn
Grass Bale Silage1
Capacity, ton of DM 240 150 150 240 240 240 240 150 150
Initial cost, $ 0 0 0 0 0 0 0 0 0
Annual cost, $/ton DM 16.53 16.53 16.53 16.53 16.53 16.53 16.53 16.53 16.53
Dry Hay
Capacity, ton of DM 45 20 20 45 45 45 45 20 20
Initial cost, $ 20,000 10,000 10,000 20,000 20,000 20,000 20,000 10,000 10,000
Annual cost, $/ton DM 4.41 4.41 4.41 4.41 4.41 4.41 4.41 4.41 4.41
Corn Silage Bunker Silo
Capacity, ton of DM - 140 140 - - - - 140 140
Initial cost, $ - 30,522 30,522 - - - - 30,522 30,522
Annual cost, $/ton DM - 1.65 1.65 - - - - 1.65 1.65
Grain
Annual cost, $/ton DM 9.91 9.91 9.91 9.91 9.91 9.91 9.91 9.91 9.91
1
44 Table A7. Animal facilities, feeding, and manure storage assumptions
Item All treatments
Animal Facilities Milking center
Type Pipeline System
Structure cost, $ 15,000
Equipment cost, $ 36,000
Labor for Milking and Animal Handling, min/cow/day 5
Housing
Cow Tie Stall Barn
Structure cost, $ 57,000
Heifer Tie Stall Barn
Structure cost, $ 35,400
Feeding Method
Grain Hand Feeding
Silage Hand Feeding
Hay Self-fed in Hay Feeder
Ration Constituents
Minimum dry hay in ratio, % of forage 10
Relative forage to grain ratio High
Crude protein supplement Soybean, 44%
45 Table A8. Manure storage information
Item All treatments
Collection and Hauling
Manure collection method Hand Scraping w/Gutter Cleaners
Manure type Semi-solid (12-14% DM)
Incorporation by tillage Within Two Days
Average manure hauling distance, km 1.00
Storage
Period, month 4
Type Top loaded concrete tank
Average diameter, m 19.81
Average depth, m 2.44
Storage capacity, t 752
Initial cost, $ 59,604.00
Bedding
Type of bedding used Sawdust
46 Table A9. Economic information
Item All treatments
General
Diesel fuel, $/liter 0.94
Electricity, $/kWh 0.13
Labor wage, $/hr 15.00
Property tax, % 2.3
Cropping
New forage stand, $/ha 269.99
Established forage stand, $/ha 19.99
Corn land, $/ha 128.50
Wheat land, $/ha 166.80
Soybean land, $/ha 197.19
Commodity Buying prices
Soybean meal 44%, $/t DM 772.26
Soybean seed roasted, $/t DM 959.44
Corn grain, $/t DM 379.73
Hay, $/t DM 137.79
Fat, $/t 551.15
Minerals/vitamins, $/t 385.79
Bedding material, $/t 82.67
Selling Prices
Grain crop silage, $/t DM 202.38
High moisture grain, $/t DM 423.97
47
Soybeans, $/t DM 863.50
Wheat grain (commodity price), $/t DM 440.92
Wheat grain (standard for food grade), $/t DM 661.38
High quality hay, $/t DM 137.79
Milk, $/hL 63.18
Cull cow, $/kg 1.06
Bred heifer, $/animal 1,000.00
Suckling calf, $/animal 75.00
Milk hauling, marketing and advertising fees, $/hL 1.047 Custom Operations
Forage crop tillage and planting, $/ha 45.96
Grain crop tillage, $/ha 50.66
Grain crop planting, $/ha 48.19
Mowing, $/ha 37.31
Tedding, $/ha 21.00
Raking, $/ha 22.24
Baling, $/t 9.72
Grain crop chopping, $/t 9.87
Hay crop chopping, $/t 17.75
Grain harvest, $/ha 78.09
Manure hauling, $/hour 84.60