American Journal of Environmental Sciences 4 (1): 50-62, 2008 ISSN 1553-345X
© 2008 Science Publications
Corresponding Author: Bader N. AL-Azmi, Department of Chemical Engineering, Loughborough University, Leicestershire, LE11 3TU UK, Tel: 965-6698833
Comparative Assessment of Ambient Air Quality in Rabia Area for Years 2001 and 2004 in
the State of Kuwait
1Bader N. Al-Azmi, 1V. Nassehi and 2A. R. Khan
1Department of Chemical Engineering
Loughborough University, Leicestershire, LE11 3TU, UK
2
Coastal and Air Pollution Department, Kuwait Institute for Scientific Research, Kuwait
Abstract: The hourly air pollutants concentrations were measured continuously by fixed ambient air stations located over the polyclinics in Rabia area in Capital Governorate in the State of Kuwait. The focus of this investigation is to determine the pollution levels of SO2, NO2 and O3 in year 2001 and 2004 to assess the pollution trends. The recorded data are used in identification of the most probable sources of these pollutants. The pollutants levels were compared to evaluate exceedances of Kuwait Environmental Authority Standards. The diurnal patterns were also analyzed for different seasons for two years 2001 and 2004. Weekdays and weekend variation on Ozone pollution has been thoroughly investigated. It is observed that SO2, NO2 and O3 levels were higher in year 2001 as compare to year 2004 due to the application of various mitigation strategies such as relocation of car auction market and transport depot, which were located in the northwestern side of Rabia area with distance of 2 km. The traffic volume all over the country has increased by substantial amount increasing NOx and ozone precursor emissions, which showed the complex balance of NOx and O3. The O3 levels of the daytime hours from April to September period has shown high buildup on weekend as compare to weekdays due to the least traffic density on the roads.
Key words: Ambient air pollution, weekdays/weekend effect, seasonal variation, ozone, nitrogen oxides, sulphur dioxide
INTRODUCTION
The air pollution causes persistent smog and health risk to the inhabitants of developing countries such as the state of Kuwait. Since the concept of pollution has existed for a long time, there has been progressing concern about air quality in urban communities. The state of Kuwait is an OPEC member, produces almost two million barrels of oil per day, and has numerous petroleum refineries, petrochemical plants, petroleum dispensing centers, power stations, and oil related industries, and apart from all that, has highly congested roads, with a heavy flux of traffic. The state of Kuwait is located in the Arabian Gulf has a hot dry climate, consists of large uninhabited desert area, with the temperature varying between 40oC and 50oC for at least six months of the year. Therefore, the energy consumption in Kuwait is one of the highest, increasing at an average rate of 7.7%, as compared to developing countries, where this rate is around 2-3 %[1]. Since the state of Kuwait depends mainly on the desalination of seawater to provide its citizens with drinking water, and fulfill the growing demand of electrical power, five major power stations were set up, which work continuously.
The government of Kuwait established the Kuwait Environmental Public Authority (KEPA) in 1995, to safeguard the environment from air pollution due to
heavy industrialization. Kuwait EPA established a number of fixed monitoring stations (six stations), to be updated with the air quality in the urban areas, through a monitoring network. These stations continuously measure the levels of pollutants such as SO2, NO2, CO, NO, CO2, H2S, O3, and TSP (total suspended particles) in the air, the increasing levels of which effect human health, apart from eroding materials[2].
Bouhamra[3] have reported VOCs concentrations in ambient air after the largest manmade environmental disaster occurred in Kuwait, exploding over six hundred wellhead by the retreating Iraqi army. He reported low concentration but prolonged exposure of these compounds has substantial health risk to Kuwaiti population. Bouhamara et al.,[4] have identified large number of organic compounds in indoor and outdoor air of various Kuwaiti houses using GC/FID with Tenax TA cartridge. The concentrations of various contaminants were reported between 100 and 5000g m-3. In another study, outdoor air quality in Mansouria area is measured for one-month duration, May 1994. Bouhamra and Abdul-Wahab[5] have not reported any violation of residential standards set by Kuwait Environment Public Authority (KEPA).
Air pollutants, especially SO2, NO2, and the major secondary photochemical oxidant, O3 strongly influence plants, and human health, and so the emphasis
Author Manuscrip
in the current study will focus on them. Riga-karandinos and Saitanis[6] conducted a study comparing the air quality of two Mediterranean coastal cities in Greece, Volos, and Patras, and their results showed that the O3 levels in Volos were higher than those in Patras during the period of April – September 2004, and the SO2 levels higher in Patras than in Volos. A comparative study of variation in daily ozone maxima between the different days of the week in big French cities over the summer period of 1994-1996 indicates a difference of almost 20% between the highest values of ozone concentration measured on weekdays and over the weekend, while traffic levels vary by more than 40% especially between Fridays and Sundays[7]. In Italy the levels of ozone concentration in the weekend was higher in the two cities of Milan and Varenna, either Milan is higher, or both are high[8]. Also, Pont and Fontan have wrote that as a reducing traffic to the normal weekend regime the concentration of ozone (O3) on the next day will increase all over the country in the Belgium[7].
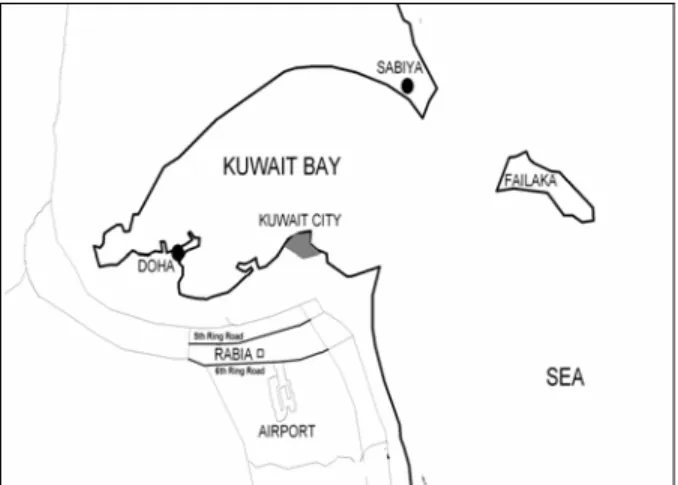
Fig. 1: location of Rabia area in Kuwait state
Geographical data: Rabia area is located in the south-west of central Kuwait, with a total area of 2456 km2 and is mainly flat land. The fixed monitoring station for Rabia is located above the polyclinic, in the center of the area. There are two major highways passing adjacent to it, fifth ring road to the north, and sixth ring road from the south. There is an industrial area, Shuwaikh industrial consisting mainly of garages and workshops for the repair of cars located to the north of Rabia. The International Airport of Kuwait is located to the southeast, where daily many planes take off and land at regular intervals. Rabia is also flanked by two
power stations, Doha to the northwest, and Subyia to the northeast, and a wastewater treatment plant located to the southwest, in Ardiya. Form Kuwait Municipality the total population of Rabia is about 30000 to 35000. The total locality is divided into five blocks, consisting of 320 houses, 7 schools, a polyclinic, a police station, 14 co-operative stores, 20 main electrical distribution stations, two petrol stations one to the east, and the other to the west. There is a wedding hall, a restaurant and a training institute of the public authority for agriculture and fish resources, which is located to the east. Traffic moves in and out of Rabia through many main streets, to the center of the city. The rush hours are 7:00 to 9:00 am in the morning, and around 5:00 to 8:00 pm in the evening. Most of the pollution resulting form traffic is due to heavy vehicles that use diesel as fuel, and light vehicles using gasoline as fuel.
Meteorological Data and methods: The Kuwait Environmental Protection Authority (KEPA) Fixed an Air pollution monitoring (APM) station that consists of direct reading instruments for measuring major air pollutants as well as meteorological parameters, is located over the polyclinic Building in Rabia. The data were obtained from KEPA for year 2001 and year 2004 and consisted of the hourly averages of continuous measurements of the concentration of the pollutants SO2 (ppm), NO2 (ppm), CO (ppm), NO (ppm) and O3 (ppm) and meteorological data.
Discussion: The investigation of this study shows the comparison between the trend of three primary pollutants SO2 , NO2 and O3 using a fixed monitoring station located above the polyclinic at a height of about 6m in the Rabia residential area in Kuwait state using hourly data for the four seasons in two years 2001 and 2004 (Fig. 1). This work covers a thorough analysis of the trends in air pollution levels of SO2, NO2 and O3 and their most probable sources in Rabia area in the State of Kuwait. In order to assess the air quality in this area, measured concentration values of these pollutants have been analyzed and compared with the specified
Author Manuscrip
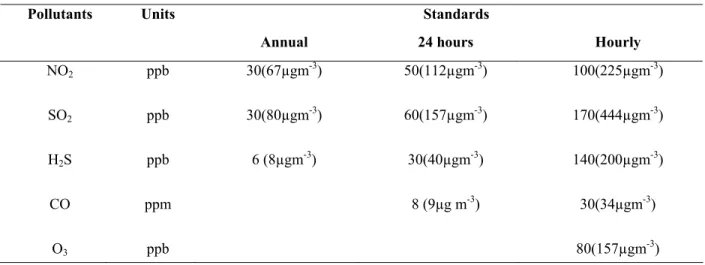
Table 1: Kuwait EPA Standards for Ambient Air
limits and guideline published by the Kuwait
Environmental Protection Authority (EPA). SO2 sources: SO2 is released in the air during the
exploration, transportation, and consumption of fuel. The main contribution is from the oilfields, during exploration, production and transportation of oil, to refineries and other related industries, during refining, processing, flaring, and transport industry, which is one of the end users, and power stations that use oil to generate electric power. These sources and their emissions are directly related to the operational conditions of the machinery involved, and the prevailing weather conditions that ultimately determine the fate of sulphur dioxide released to the environment.
Winter: The results of analyzed data for year 2004 show that the available hourly values of recorded SO2 concentrations for winter (January to March) period were around 93.13 %. There was no observed violation for hourly data exceeding 170 ppb, the specified limit of KEPA for SO2 concentration. The maximum hourly SO2 concentration in this period was around 6.58 ppb at 19:00Hr on 31st March where the corresponding temperature was 27.9 ºC, relative humidity 11.4%, wind speed 3.69 ms-1 from WNW direction confirming the predominant emission source, the Doha power station. The maximum daily mean SO2 concentration for this period was 3.18ppb corresponding to 31st of March. Overall, the monthly average SO2 concentration for January was 0.57±0.88σ ppb, where σ =0.5, for February was 0.47±0.79σ ppb, where σ = 0.435 and for March was 0.69±0.75σ ppb, where σ =0.82.
The results of analyzed data for year 2001 in the winter
period show that the recorded hourly SO2 concentration was around 99.77 %, with no violations in this period either, exceeding 170 ppb, the specified limit of KEPA for SO2 concentration. The maximum hourly SO2 concentration for this period was around 141.1 ppb at 21:00Hr on 7th March where the corresponding temperature was 26 ºC, relative humidity 61.38%, wind speed 1.03 ms-1 from SSE direction. The probable source is a restaurant café that uses charcoal fire for roasting meat, generously augmenting the prevalent SO2 concentrations. The maximum daily mean SO2 concentration for this period was 38.95ppb, corresponding to 7th March. The monthly average SO2 concentration was 2.5±0.786σ ppb, where σ =0.25, February 4.4±0.789σ ppb, where σ = 0.41 and March 4.6±0.53σ ppb, where σ =0.7 respectively.
Spring: The available values for recorded SO2 hourly concentrations in spring period (April to June) for year 2004 was 67 % only, due to the malfunctioning of the SO2 monitor. There was no observed violation, exceeding 170ppb specified limit of KEPA for SO2 concentration. The maximum hourly SO2 concentration for this period was around 8.1 ppb at 11:00Hr on 3rd April where the corresponding temperature was 28.7Cº, relative humidity 0.87%, wind speed 3.1 ms-1 from SSE direction (143o). In this location, the most probable source is a café restaurant that uses charcoal fire for roasting meat adding to the existing SO2 in the ambient air. The maximum daily mean SO2 concentration for this period was 4.22ppb, corresponding to 27th May. The monthly average SO2 concentration for April was 1.2±0.73σ ppb, where σ =0.934, May 1.25±0.765σ ppb, where σ =0.91.
Standards Pollutants Units
Annual 24 hours Hourly
NO2 ppb 30(67µgm-3) 50(112µgm-3) 100(225µgm-3)
SO2 ppb 30(80µgm-3) 60(157µgm-3) 170(444µgm-3)
H2S ppb 6 (8µgm-3) 30(40µgm-3) 140(200µgm-3)
CO ppm 8 (9µg m-3) 30(34µgm-3)
O3 ppb 80(157µgm-3)
Author Manuscrip
The available values for recorded SO2 hourly concentrations in spring period for year 2001 was 92.58%, with a violation of around 0.046% exceeding 170ppb specified limit of KEPA for SO2 concentration. The maximum hourly SO2 concentration for this period was around 171.25 ppb at 19:00Hr on 3rd April where the corresponding temperature was 34.85Cº, relative humidity 45.3%, wind speed 2.22 ms-1 from SSE direction (138o), validating the above explanation of the café- restaurant as a high contributor of SO2. The maximum daily mean SO2 concentration for this period was 16.62ppb, corresponding to 3rd April. The monthly average SO2 concentration was 4.8±0.77σ ppb, where σ =0.393 for the month of April, May1.75±0.7σ ppb, where σ =0.148 and in June was 1.2±0.83σ ppb, where
σ =0.963.
Summer: The hottest temperature in the state of Kuwait is recorded in this period (July to September) and is identified as the summer season. The available values for recorded SO2 hourly concentrations in this period were about 98 % for year 2004. There was no apparent violation exceeding 170 ppb, the specified limit of KEPA for SO2 concentration in this period. The maximum hourly SO2 concentration was around 87.7 ppb at 11:00Hr on 18th August 2004 where the corresponding temperature was 41.1Cº, relative humidity 1.94%, wind speed 3.41 ms-1 from WSW direction (253o). The most probable sources are the numerous transport offices, in Ardiya area, which has that use heavy transport to mobilize goods, heavily contributing to the high SO2 levels. The maximum daily mean SO2 concentration for this period was 15.34ppb, corresponding to 29th July. The monthly average SO2 concentration was 1.8±0.56σ ppb, where
σ =0.28, for July, 1.5±0.595σ ppb, where σ =0.26, for August and in September was 1.2±0.95σ ppb, where σ =0.76.
The available value for recorded SO2 hourly concentrations in this period was about 91.75% for year 2001. There was no observed violation exceeding 170 ppb, the specified limit of KEPA for SO2 concentration in this period. The maximum hourly SO2 concentration was around 134 ppb at 11:00Hr on 5th September where the corresponding temperature was 47.6ºC, relative humidity 13.78%, wind speed 2.43 ms-1 from NW direction (299o). The most probable source was the Doha power station, confirming the fact that the power plants run at peak loads during summer. The maximum daily mean SO2 concentration for this period was 16.02ppb, corresponding to 5th September. The monthly average SO2 concentration in July was 1.4±0.62σ ppb, where σ =0.175, August 1.3±0.7σ ppb, where σ =0.163 and in September was 3.7±0.66σ ppb, where σ =0.395.
Autumn: The available values for recorded SO2 hourly concentrations in autumn period (October to December) for year 2004 was 63.53 % and there was no obvious violation exceeding 170 ppb specified limit of KEPA for SO2 concentration in this period. The maximum hourly SO2 concentration was around 23.25 ppb at 11:00Hr on 27th December where the corresponding temperature was 12.6ºC, relative humidity 55.2%, wind speed 3.01 ms-1 from WNW direction (290o). The most probable source is the Doha power station, working in peak load in the summers, using heavy fuel containing 4% sulphur. The maximum daily mean SO2 concentration for this period was 9.53ppb, corresponding to 11th December. The monthly average SO2 concentration in October was 2.8±0.91σ ppb, where σ =0.166, and in December was 3.4±0.81σ ppb, where σ =0.279.
The available values for recorded SO2 hourly concentrations in this period for year 2001 was approximately 98.45%, and there was no observed violation exceeding 170 ppb specified limit of KEPA for SO2 concentration in this period. The maximum hourly SO2 concentration was around 114.7 ppb at 20:00Hr on 21st November where the corresponding temperature was 20.7Cº, relative humidity 52.5%, wind speed 0.73 ms-1 from SE direction (142.5o). The most probable source is the high traffic load at the junction of the Gazalli expressway, and 6th ring road. The maximum daily mean SO2 concentration for this period was 35.68ppb, corresponding to 21st November. The monthly average SO2 concentration in October was 2.8±0.63σ ppb, where σ =0.307, November 4.2±0.35σ ppb, where σ =0.68 and in December was 1.4±0.84σ ppb, where σ =0.97.
Overall, it can be seen that the overall SO2 concentration for the year 2001 was greater than 2004. This can be credited to the growing environmental awareness that has prompted changes like the use of cleaner fuel, treatment prior to discharge, etc. In the year 2004, the trend is opposite, with the highest concentration detected in summer, followed by autumn, spring and lastly winter. This is explained by the growing demand of power to meet the requirements of the nation. With an increased investment in real estate and a boom in the construction business, power requirements have become gargantuan. The summer temperatures escalate the need for comparative cooling causing the power stations to be running at peak loads, and in spite of the favorable dispersion conditions the concentration noticed are comparatively high. In the year 2001, however, the highest concentration detected was in the winter period, followed by autumn, and then spring and lastly summer. This is because the winters in Kuwait portray a low temperature, low inversion layers,
Author Manuscrip
lesser wind movements, which do not promote the dispersion of pollutants, as compared to summers, which have high temperature, high inversion layers, high wind movements and effective distribution and dilution of pollutants._____________________---
O3 sources: It is a secondary pollutant, created in the
presence of sun light, NOx and a pre-curser VOCs. It is complimentary in its action along with NOx, in that in the presence of sunlight, the available concentration of NOx is consumed and used in generation of ozone, while in the absence of sunlight, the reversible reaction prevails, reducing the O3 concentrations, and enhancing the NOx concentrations. The analysis of ozone during the daytime was found to be significantly due to high O3 precursor concentrations generating substantial O3 levels than that of nighttime where only neutralization occurs due to fresh NO production[9].
Winter: The available values for recorded O3 hourly concentrations in winter period (January to March) was about 95 % for year 2004, and no observed violations exceeding 80 ppb, the specified limit of KEPA. The maximum hourly O3 concentration in this period was around 39.42 ppb at 15:00Hr on 1st February, where the corresponding temperature was 18Cº, relative humidity 52.2%, wind speed 2.6 ms-1 from SE direction (115o). The most probable source is the traffic congestion, diverging towards the junction of the Gazalli expressway and 6th ring road. The maximum daily mean O3 concentration for this period was 20ppb, corresponding to 30th March. The monthly average O3 concentration in January was 7.8±0.92σ ppb, where σ =0.39, February 11.1±0.81σ ppb, where σ =0.35 and in March was 12.1±1.1σ ppb, where σ =0.37.
The recorded O3 hourly concentrations in this period in 2001 was about 99.82% and no noticeable violations exceeding 80 ppb specified limit of KEPA. The maximum hourly O3 concentration in this period was 53 ppb at 16:00Hr on 24th March where, the corresponding temperature was 28ºC, relative humidity 74%, wind speed 5.5 ms-1 from SE direction (112o). This confirms the fact that road traffic at the junction of Gazalli expressway, and 6th ring road considerably contributes to the pollutant volumes. The maximum daily O3 concentration for this period was 25.94ppb, corresponding to 24th March. The monthly average O3 concentration in January was 7.2±0.786σ ppb, where σ =0.32, February 10.7±0.81σ ppb, where σ =0.4 and in March was 11.9±0.74σ ppb, where σ =0.42.
Spring: The available values for recorded O3 hourly concentrations in this period, spring (April to June) was about 88 % for year 2004, with no violations exceeding
80 ppb specified limit of KEPA. The maximum hourly O3 concentration in this period was around 43.1 ppb at 13:00Hr on 28th May where the corresponding temperature was 35.5Cº, relative humidity 4.4%, wind speed 3.16 ms-1 from E direction (81o). The probable source is the traffic congestion at the Gazalli expressway. The maximum daily mean O3 concentration for this period was 28ppb, corresponding to 16th April. The monthly average O3 concentration in April was 14.4±0.77σ ppb, where σ =0.533, May 12.2±0.8σ ppb, where σ =0.36 and in June was 11.9±1.5σ ppb, where σ =0.3.
The available data for recorded O3 hourly concentrations for this period, in the year 2001 was about 92.6% and no observed violations exceeding 80 ppb specified limit of KEPA. The maximum hourly O3 concentration in this period was around 51 ppb at 15:00Hr on 11th April where the corresponding temperature was 38Cº, relative humidity 30.5%, wind speed 1.8 ms-1 from W direction (272o). The most probable sources are the numerous transport offices in Ardiya, which has that mobilize goods and exert considerable stress on the environment. The maximum daily mean O3 concentration for this period was 33.1ppb, corresponding to 18th May. The monthly average O3 concentration in April was 1.53±1.026σ ppb, where σ =0.594, May 15.6±0.86σ ppb, where σ =0.59 and in June was 20.2±0.92σ ppb, where σ =0.38. Summer: The available data for O3 hourly concentrations in this period, summer (July to September) was about 92 % for year 2004, with a violation of 0.095% exceeding 80 ppb specified limit of KEPA for O3 concentration. The maximum hourly O3 concentration in this period was around 90.6 ppb at 14:00Hr on 18th September where the corresponding temperature was 36.7ºC, relative humidity 2.31%, wind speed 1.88 ms-1 from NE direction (46o). The most probable source is the Subyia power station, running at peak load in summers enhancing the pollution load. The maximum daily mean O3 concentration for this period was 26ppb, corresponding to 17th September. The monthly average O3 concentration in July was 14.4±0.87σ ppb, where σ =0.34, August 16.1±0.86σ ppb, where σ =0.45 and in September was 17.9±1.1σ ppb, where σ =0.48.
The available values for O3 hourly concentrations for this period, in the year 2001 was about 91.88% with a violation of 0.091% exceeding 80 ppb specified limit of KEPA for O3 concentration. The maximum hourly O3 concentration in this period was around 112 ppb at 13:00Hr on 25th July where the corresponding temperature was 49.9Cº, relative humidity 29%, wind speed 2.33 ms-1 from ENE direction (68o). This
Author Manuscrip
confirms that the Subyia power station, running at peak load in summers exerts a sizeable stress on the environment. The maximum daily mean O3 concentration for this period was 38.2ppb, corresponding to 3rd July. The monthly average O3 concentration in July was 20.5±0.85σ ppb, where σ =0.793, August 12.7±0.86σ ppb, where σ =0.546 and in September was 11±0.77σ ppb, where σ =0.484.
Autumn: The available values for recorded O3 hourly concentrations in this period, (October to December) was about 92 % for year 2004, with no violations exceeding 80 ppb specified limit of KEPA for O3 concentration. The maximum hourly O3 concentration in this period was around 60ppb at 15:00Hr on 1st October where the corresponding temperature was 37.4ºC, relative humidity 6.9%, wind speed 1.5 ms-1 from NNE direction (12o). The most probable source is the traffic congestion, at the 5th ring road, enhancing the pollution loads. The maximum daily mean O3 concentration for this period was 22ppb, corresponding to 10th October. The monthly average O3 concentration in October was 11.6±0.85σ ppb, where σ =0.54, and in December was 9.4±0.8σ ppb, where σ =0.26.
The available values for recorded O3 hourly concentrations for this period, in the year 2001 was about 91.88% with a violation of 0.091% exceeding 80 ppb specified limit of KEPA for O3 concentration. The maximum hourly O3 concentration in this period was around 59.3ppb at 15:00Hr on 13th October where the corresponding temperature was 40.6ºC, relative humidity 54%, wind speed 2.22 ms-1 from ENE direction (82.5o). The most probable source is the prevalent traffic congestion, at the junction of Gazalli expressway, and 5th ring road, enhancing the stress on the environment. The maximum daily mean O3 concentration for this period was 38.2ppb, corresponding to 4th October. The monthly average O3 concentration in October was 10±0.846σ ppb, where σ =0.4, November 8.3±0.83σ ppb, where σ =0.349 and in December was 5.4±0.83σ ppb, where σ =0.36.
Overall, it can be seen that the O3 concentrations in 2001 were comparatively higher than those in 2004. The increasing number of cars supports this very well over the years that have escalated the NO concentrations over the years, and NO being contradictory to O3,brings down its concentrations. In 2004, the highest concentration were seen in spring, followed by summer, autumn, and lastly winter. In 2001, also, the highest concentration recorded was in summer, and autumn followed by spring, and lastly winter. This is because O3 being a product of photochemical oxidation, is highly dependant on solar radiation, and winters have shorter day hours, and are
more cloudy, leading to poor solar radiation, hence winter has a poor show with respect to O3 concentrations.
NO2 sources: The most obvious sources are cars,
combustion sources, power stations, flares, etc. Also, under normal temperatures, and the presence of an oxidizing agent like O3, OH- the oxidation of NO to NO2 takes place.
Winter: The available data for recorded NO2 hourly concentrations in this period, (January to March) was about 98.6 % for year 2004, with no violations exceeding 100 ppb specified limit of KEPA for NO2 concentration. The maximum hourly NO2 concentration in this period was around 64.17 ppb at 17:00Hr on 15th March where the corresponding temperature was 20ºC, relative humidity 7.14%, wind speed 2.6 ms-1 from WNW direction (300o). The most probable source is the traffic congestion, at the junction of 5th ring road and Ardiya area, enhancing the pollution load. The maximum daily mean NO2 concentration for this period was 36.35ppb, corresponding to 5th January. The monthly average NO2concentration in January was 18.3±0.88σ ppb, where σ =0.57, February was 18.4±0.77σ ppb, where σ =0.41 and in March was 22±0.82σ ppb, where σ =0.61.
The available values for recorded NO2 hourly concentrations for this period, in the year 2001 was about 3.7% with no violation exceeding 100 ppb specified limit of KEPA for NO2 concentration. The maximum hourly NO2 concentration in this period was around 53.1ppb at 14:00Hr on 2nd January where the corresponding temperature was 25.13ºC, relative humidity 68.5%, wind speed .66 ms-1 from SE direction (146o). The most probable source is the prevalent traffic congestion at the junction of Gazalli expressway, and 6th ring road, enhancing the stress on the environment. The maximum daily mean NO2 concentration for this period was 38.2ppb, corresponding to 2nd January. The monthly average NO2 concentration in January was 17.6±0.77σ ppb, where σ =0.37, February was 17.4±0.82σ ppb, where σ =0.428 and in March was 17.3±1.46σ ppb, where σ =0.417.
Spring: The available values for recorded NO2 hourly concentrations in this period, (April to June) was about 95.5 % for year 2004, with no violations exceeding 100 ppb specified limit of KEPA for NO2 concentration. The maximum hourly NO2 concentration in this period was around 55.6 ppb at 18:00Hr on 19th June where the corresponding temperature was 38.95ºC, relative humidity 1.14%, wind speed 2.33 ms-1 from NW direction (307o). The most probable source is the Doha
Author Manuscrip
power plant, which is working at near peak load resulting in high pollutant concentrations. The maximum daily mean for NO2 concentration for this period was 35.5ppb, corresponding to 3rd April. The monthly average NO2 concentration in April was 18.5±0.96σ ppb, where σ =0.61, May was 17.9±0.77σ ppb, where σ =0.4 and in June was 23.7±0.87σ ppb, where σ =0.5.
The available values for recorded NO2 hourly concentrations for this period, in the year 2001 was about 88.55% with no violation exceeding 100 ppb specified limit of KEPA for NO2 concentration. The maximum hourly NO2 concentration in this period was around 88.7ppb at 10:00Hr on 1st April where the corresponding temperature was 39.7ºC, relative humidity 33.7%, wind speed 0.86 ms-1 from ESE direction (117o) The most probable source is the building traffic congestion, at the junction of Gazalli expressway, and Farwaniya, and enhancing the stress on the environment. The maximum daily mean NO2 concentration for this period was 31.83ppb, corresponding to 24th April. The monthly average NO2 concentration of in April was 18.6±1.1σ ppb, where σ =0.565, May was 15.8±0.99σ ppb, where σ =0.426 and in June was 15.7±0.91σ ppb, where σ =0. 346.
Summer: The available data for recorded NO2 hourly concentrations in this period, (July to September) was about 99 % for year 2004, with no violations exceeding 100 ppb specified limit of KEPA for NO2 concentration. The maximum hourly NO2 concentration in this period was around 86.6 ppb at 17:00Hr on 25th September where the corresponding temperature was 34.6ºC, relative humidity 3.8%, wind speed 1.4 ms-1 from NE direction (47.5o). The most probable source is the Subiya power plant, which is working at peak load in summer, resulting in high pollutant concentrations. The maximum daily mean NO2 concentration for this period was 40.6ppb, corresponding to 26th September. The monthly average concentration of NO2 in July was 26.6±0.86σ, where σ =0.0052, August was 20.3±0.72σ, where σ =0.00343 and in September was 24.3±1.06σ, where σ =0.0068.
The available values for recorded NO2 hourly concentrations for this period, in the year 2001 was about 89.43 % with a violation of 0.045% exceeding 100 ppb specified limit of KEPA for NO2 concentration. The maximum hourly NO2 concentration in this period was around 100.75 ppb at 11:00Hr on 25th September where the corresponding temperature was 47.6ºC, relative humidity 15.9%, wind speed 1.13 ms-1 from ENE direction (73o) The most probable source is the building of traffic congestion, at the junction of Gazalli expressway, and 5th ring road, and enhancing
the stress on the environment. The maximum daily mean NO2 concentration for this period was 50.85ppb, corresponding to 26th September. The monthly average NO2 concentration in July was 16.8±0.94σ ppb, where
σ =0.49, August was 14.2±0.79σ ppb, where σ =0.513 and in September was 17.9±0.76σ ppb, where σ =0.125.
Autumn: The available values for recorded NO2 hourly concentrations in this period (October to December) was about 67 % for year 2004, with no violations exceeding 100 ppb specified limit of KEPA for NO2 concentration. The maximum hourly NO2 concentration in this period was around 61 ppb at 19:00Hr on 1st October 2004 where the corresponding temperature was 31.7ºC, relative humidity 15.9%, wind speed 1.2 ms-1 from NE direction (40o). The most probable source is the Subiya power plant, which is working at near peak load, resulting in high pollutant concentrations. The maximum daily mean NO2 concentration for this period was 25.81ppb, corresponding to 12th October. The monthly average NO2 concentration in October was 14.8±0.83σ ppb, where σ =0.47, and in December was 3.1±0.78σ ppb, where σ =0.31.
The available values for recorded NO2 hourly concentrations for this period, in the year 2001 was about 98.5 % with a violation of 1.9% exceeding 100 ppb specified limit of KEPA for NO2 concentration. The maximum hourly NO2 concentration in this period was around 161.4 ppb at 10:00Hr on 15th October 2001 where the corresponding temperature was 41.5ºC, relative humidity 50.1%, wind speed 0.98ms-1 from ESE direction (104o). The most probable source is the developing traffic congestion at the junction of Gazalli expressway, and 6th ring road, which is responsible for the enhanced pollutant load. The maximum daily mean for NO2 concentration for this period was 79.58ppb, corresponding to 10th October. The monthly average NO2 concentration in October was 34.9±0.85σ ppb, where σ =0.199, November was 15.9±0.796σ ppb, where σ =0.51 and in December was 15.3±0.96σ ppb, where σ =0.381.
In the case of NO2, the overall concentrations were higher in 2001, as compared to 2004. In 2004, the highest concentration detected was in summer, followed by winter, then spring, and lastly autumn. In the year 2001, the highest concentration was seen in autumn, followed by summer, winter, and lastly spring. This is simply because the increase in the number of vehicles over the years, have scaled up the production of NO, subduing the ozone production, which inevitably subdues NO2 formation.
Author Manuscrip
To asses the air quality in Rabia area, air pollution data for two years, 2001 and 2004 for this area in the state of Kuwait were obtained from a monitoring station located at the top of polyclinic. The pollutants under observation were O3, SO2, NO2, CO and NO. When considering the sources of these pollutants, the location of Rabia is very crucial. It is flanked by three major highways on three of its sides, 5th ring road to the north, 6th ring road to the south, and Gazalli highway to the east, while the fourth side is shared with Ardiya area, which houses transport offices that have come up substantially over the years. These offices mobilize goods using heavy transport vehicles and trailers. Further north, is the industrial areas of Rai and Shuwaikh, which house numerous garages, and metal processing workshops. There are two large power plants, Doha complex 16km to the northwest and Subyia power plant 25km to the northeast, which use heavy oil for the production of power that contains about 4% sulfur. Also, there is airport 8km to the southeast. The east and west boundaries accommodate two fuel dispersing stations. In the close vicinity of the monitoring station is also located a restaurant that use coal fires for the roasting of meat as part of its daily activities. Taking all these sources into consideration, the stress on the air quality in this area is quite significant. In order to understand the impact on the environment a detailed examination of the seasonal and diurnal variations was carried out, the results of which are quite crucial.
With respect to the standards set by the Kuwait EPA Table (1), all pollutants come within the set limits with no observations of any violations during the study period. All of the primary pollutants show higher concentration levels in winter months as compared to the summer months except in the case of NO2 in the year 2004. This can be attributed to the fact that high temperatures, high winds, high inversion layer, and a very significant dispersion rate of pollutants characterize the summer in the state of Kuwait. Winter season is characterized by the exact opposite features, namely low temperatures, low winds; a low set inversion layer, and poor dispersion of pollutants. Kuwait ranking as one of the highest oil producing countries in the world also has a large number of related industries for the refining and processing of this oil and its various fractions. This is the main source of SO2, along with power stations, and vehicle emission. The SO2 emissions also show high concentrations in summer, when the power stations are running at peak load to meet the power needs of the country. NO2, CO and NO are also released by the same sources. The
major sources of SO2 emission in Kuwait are the electrical power generation stations and water desalination plants. The prevailing wind in Kuwait is almost from northwest, so that the Doha complex, which consists of Doha east and Doha west power stations located near the residential areas, makes the highest contribution of about 49% of the total SO2 emitted in Kuwait[10].
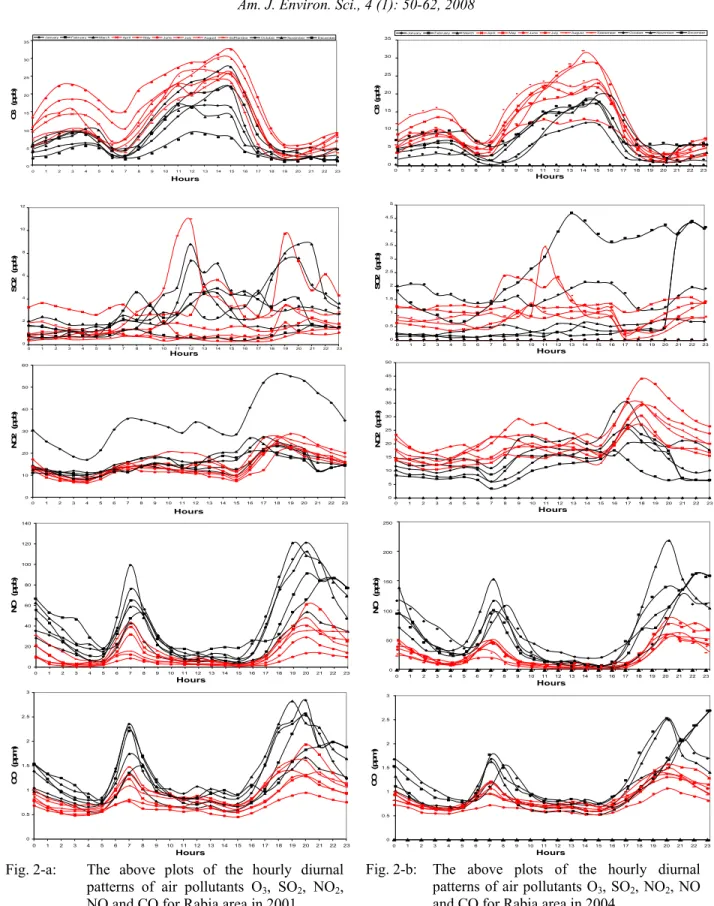
In the 24-hour trend for these pollutants Fig. (2-a, 2-b), we see two distinct peaks, which is a characteristic feature of urban regions. The first one occurs between 6:00hr and 8:00hr, which represents the traffic congestion caused by people commuting to work, and children commuting to school. The second peak is comparatively longer, from 16:00hr to 21:00hr, and represents people driving out to meet friends, shopping malls, or just out for some fresh air. O3 on the other hand, being a secondary pollutant, with a high dependence on photochemical oxidation shows a single stretched peak limited to the daytime, and two characteristic troughs. This is linked to the antagonistic behavior of O3 towards NO, where the NO concentrations are depleted in the presence of NO concentrations are depleted in the presence of sunlight and O3 precursor gases. The reverse is true in the absence of sunlight. NO concentrations nose dive after the first morning peak, with increasing solar radiation, remains dormant until 16:00hr and then begins to climb of the second peak. These concentrations remain elevated with fresh emissions from vehicles and reverse conversion of ozone to NO, until 7:00hr the next day morning.
Another characteristic feature in the observations for the two years data is the higher values of SO2 in the year 2001 as compared to the year 2004. This is due to the rising awareness towards the environment that has brought about radical changes, which can be seen in the use of better quality of oil in all the various processes, as well as treatment processes to curb the discharges. The same is the case for NO2, and CO, but the reduction is comparatively mild. This is because of the increase in the number of vehicles over the years, personal, as well as commercial, which is of importance to this area, since numerous transport offices with strong fleets of goods carriers have come up in neighboring Ardiya. This increase is reflected quite strongly in the case of NO, where the concentrations have nearly doubled. The concentrations remain unchanged in the case of O3, considering that it thrives totally on photochemical oxidation, and there are no alterations in the prevalent climatic conditions in this region.
Author Manuscrip
0 5 10 15 20 25 30 35
0 1 2 3 4 5 6 7 8 9 10 11 12 13 14 15 16 17 18 19 20 21 22 23
Hours
O
3
(ppb)
January February March April May June July August SePtember October November December
0 2 4 6 8 10 12
0 1 2 3 4 5 6 7 8 9 10 11 12 13 14 15 16 17 18 19 20 21 22 23
Hours S O 2 ( ppb) 0 10 20 30 40 50 60
0 1 2 3 4 5 6 7 8 9 10 11 12 13 14 15 16 17 18 19 20 21 22 23
Hours NO 2 ( ppb) 0 20 40 60 80 100 120 140
0 1 2 3 4 5 6 7 8 9 10 11 12 13 14 15 16 17 18 19 20 21 22 23
Hours N O ( p p b ) 0 0.5 1 1.5 2 2.5 3
0 1 2 3 4 5 6 7 8 9 10 11 12 13 14 15 16 17 18 19 20 21 22 23
Hours C O ( p p m )
Fig. 2-a: The above plots of the hourly diurnal patterns of air pollutants O3, SO2, NO2, NO and CO for Rabia area in 2001.
0 5 10 15 20 25 30 35
0 1 2 3 4 5 6 7 8 9 10 11 12 13 14 15 16 17 18 19 20 21 22 23
Hours
O
3
(ppb)
January February March April May June July August Sebtember October November December
0 0.5 1 1.5 2 2.5 3 3.5 4 4.5 5
0 1 2 3 4 5 6 7 8 9 10 11 12 13 14 15 16 17 18 19 20 21 22 23
Hours SO 2 ( ppb) 0 5 10 15 20 25 30 35 40 45 50
0 1 2 3 4 5 6 7 8 9 10 11 12 13 14 15 16 17 18 19 20 21 22 23
Hours NO 2 ( ppb ) 0 50 100 150 200 250
0 1 2 3 4 5 6 7 8 9 10 11 12 13 14 15 16 17 18 19 20 21 22 23
Hours N O ( ppb) 0 0.5 1 1.5 2 2.5 3
0 1 2 3 4 5 6 7 8 9 10 11 12 13 14 15 16 17 18 19 20 21 22 23
Hours C O ( p p m )
Fig. 2-b: The above plots of the hourly diurnal patterns of air pollutants O3, SO2, NO2, NO and CO for Rabia area in 2004.
Author Manuscrip
y = 0.9355x
R2 = 0.6201
y = 0.9488x
R2 = 0.7429
0 20 40 60 80 100 120
0 20 40 60 80 100 120
midweek W edn es da y NO O3
y = 0.5534x R2 = 0.1832
y = 1.0222x R2 = 0.7741
0 20 40 60 80 100 120
0 20 40 60 80 100 120
Midweek T hur s da y NO O3
y = 0.5418x R2 = 0.1269 y = 1.1473x
R2 = 0.6939
0 20 40 60 80 100 120
0 20 40 60 80 100 120
Midweek Fr id a y NO O3
y = 1.0185x R2 = 0.6019
y = 0.8392x R2 = 0.8263
0 20 40 60 80 100 120
0 20 40 60 80 100 120
Midweek Sa tu rd a y NO O3
Fig. 3-a: Correlation plots of the monthly average of the mean hourly O3 and NO mixing ratios on Saturday,
Wednesday, Thursday and Friday VS. the corresponding mixing ratios, for each daylight hour between 07:00 and 21:00, during midweek (Sunday, Monday and Tuesday) occurred in year 2001.
y = 0.9774x R2 = 0.3511
y = 0.8848x R2 = 0.7762
0 20 40 60 80 100 120 140
0 20 40 60 80 100 120
midweek W ednesda y NO O3
y = 1.1666x
R2 = 0.4723
y = 0.873x
R2 = 0.7234
0 20 40 60 80 100 120
0 20 40 60 80 100 120
Midweek T hur s d a y NO O3
y = 0.986x R2 = 0.4467
y = 0.8584x R2 = 0.783
0 20 40 60 80 100 120
0 20 40 60 80 100 120
Midweek Fr id a y NO O3
y = 1.475x
R2 = 0.6061
y = 0.856x
R2 = 0.8937
0 20 40 60 80 100 120 140 160 180 200
0 20 40 60 80 100 120
Midweek Sa tu rd a y NO O3
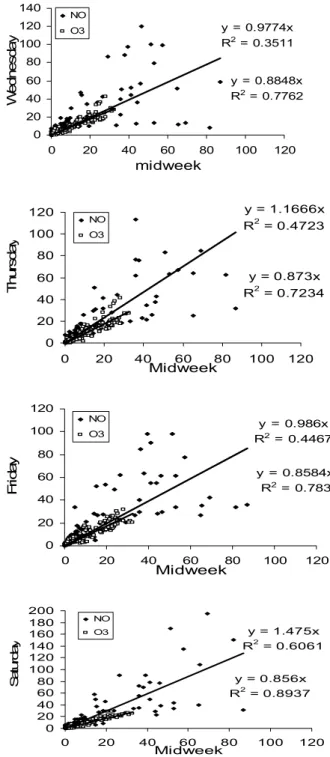
Fig. 3-b: Correlation plots of the monthly average of the mean hourly O3 and NO mixing ratios on Saturday, Wednesday, Thursday and Friday VS. the corresponding mixing ratios, for each daylight hour between 07:00 and 21:00, during midweek (Sunday, Monday and Tuesday) occurred in year 2004.
Author Manuscrip
Table: 2: Regression equations of the summer mean hourly O3 and NO mixing ration at Rabia during midweek (X) VS the
corresponding mean hourly O3 and NO on Wednesday, Thursday, Friday and Saturday (Y) for each daylight hour
between 7:00 and 19:00
2001 2004
Equation R2 Equation R2
Wednesday, O3 Y = 0.9488 X 0.7429 Y = 0.8848 X 0.7762
Wednesday, NO Y = 0.9355 X 0.6201 Y = 0.9774 X 0.3511
Thursday, O3 Y = 1.0222 X 0.7741 Y = 0.8730 X 0.7234
Thursday, NO Y = 0.5534 X 0.1832 Y = 1.1666 X 0.4723
Friday, O3 Y = 1.1473 X 0.6939 Y = 0.8584 X 0.7830
Friday, NO Y = 0.5418 X 0.1269 Y = 0.9860 X 0.4467
Saturday, O3 Y = 0.8392 X 0.8263 Y = 0.8560 X 0.8937
Saturday, NO Y = 1.0185 X 0.6019 Y = 1.4750 X 0.6061
In year 2001, the slopes of linear regressions showed that during Wednesdays and Thursdays, O3 levels were similar to those existing during midweek days. During Fridays, O3 levels were higher compared to midweek days by about 15% but on Saturdays O3 levels dropped almost 16% lower than midweek days. In year 2004, O3 levels for Wednesdays, Thursdays, Fridays and Saturdays were recorded 12-14% lower than the midweek days.
For year 2001, Wednesdays and Saturdays NO levels were similar to those experienced during midweek days, while Thursdays and Fridays NO levels were 45% lower than the midweek NO concentrations. In year 2004, Wednesdays and Fridays NO levels were similar to those occurring during midweek days. During Thursdays, NO levels increased by 17% than midweek concentrations while Saturdays NO levels showed 48% increase over midweek levels. The variation in NO levels as high as 15% is not considered significant due to diurnal and seasonal disparity[6]. These results indicate well-pronounced weekend effect in year 2001, reflecting a 45% decrease in NO levels on Thursdays and Fridays, which is explained in the following section. In year 2004, an increase of 48% in NO levels on Saturdays had been recorded, while weekend effect is not that conspicuous. Based on O3 concentrations there is a 14-16% decrease on weekends as compare to weekdays.
O3 and NOx behavior is very complex, high NOx levels restrain the O3 formation due to NO titration of O3 and reaction of NO2 and OH to result in HNO3
deposition that results into decrease in O3 levels with reduction in NOx emissions as compare to VOCs. In VOCs sensitive region, (abundance of NOx relative to VOCs) O3 levels show an increase with the decrease in NOx levels due to reduced titration and HNO3 deposition reactions.
Blanchard and Tanenbaum[15] have discussed O3 levels increase in VOCs limited zone and is supported from the results of Riga-Karandinos et al.,[6] for VOCs sensitive locations, Patras and Volvos, coastal cities in Greece. In the present study, O3 levels for year 2001 showed an increase on Fridays similar to the reported results for all mega-cities, Los Angeles, San Francisco etc. while in year 2004, O3 levels decreased with a recorded increase in NOx levels on Saturdays. It is obvious that due to oil production, refining and dispensing activities, VOCs levels are high and NOx sensitive regions are prevailing. NOx emissions from power plants and high traffic density have strong influence on the O3 levels for weekday/weekend. On Saturdays, NO levels increase almost 48% due to the above-mentioned reasons. There is no apparent deviation of O3 and NO concentrations for Fridays to weekend for daytime hours 7:00hr to 19:00hr for April to September Month for 2001.
acts as a sink for both radicals. O3 levels are not linearly related to the concentrations of precursors. The abundance of VOCs relative to NOx in the NOx sensitive region
Author Manuscrip
0 10 20 30 40 50 60 70
0 1 2 3 4 5 6 7 8 9 10 11 12 13 14 15 16 17 18 19 20 21 22 23
Hour (Apr.-Sep.)
N
O
a
nd
O
3
m
ix
ing
r
a
ti
os
(
ppb
)
NO-2004 O3-2004 NO-2001 O3-2001
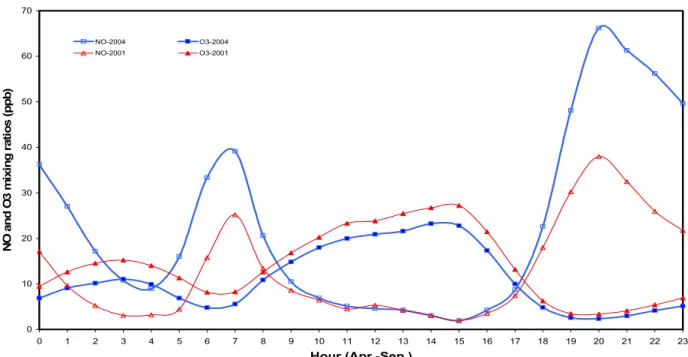
Fig. 4: The average diurnal pattern of O3 and NO in 2001(triangle) and 2004 (square) in summer period (April to September)
Rate of Ozone accumulation: Ozone (O3) concentration is governed by its precursor concentration in the presence of sufficient sunlight. The nitrogen oxide (NO) is the most influencing pollutant that controls the concentration of ozone (O3) before sunrise and it neutralizes the concentration of ozone present in the ambient air. The concentration of ozone gradually increases due to the photo dissociation of nitrogen dioxide (NO2), mainly coming from automobile exhaust and because of combination of atomic oxygen (O) and molecular oxygen (O2) which is present abundantly in
the atmosphere [16]. The building up of ozone (O3) commences when
the mixing ratios of ozone (O3) and nitrogen oxide (NO) are equal and is known as termination of the morning inhibition period[11, 14]. The accumulation rate of ozone (O3) can be calculated from the slope of ozone (O3) concentration profile reacting to the highest value. This data analysis for ozone (O3) and nitrogen oxide (NO), showed that, the high rate of ozone accumulation (O3) was in summer period (April - September) in both years Fig. (4). As shown in Fig. (4), the crossover in year 2001 occurs about 45 minutes earlier than year 2004 for Rabia area. Riga- Karandinos and Saitanis [6] have presented O3 and NO mixing ratio in two Mediterranean coastal cities. The crossover in Volos area has occurred about one hour earlier than Patras area. The difference in the crossover time between two
years came from the high rate of NO in year 2004 compared to year 2001. The reduction of NO from its peak value to the corresponding point took a longer time but in year 2001, the value of NO is lower than year 2004 hence taking lesser time to reduce NO to crossover point.
As shown in the Fig. (4), the high rate of accumulation of O3 value for year 2001 occurred faster between 8:00hr and 11:00hr and followed by a slow increase between 11:00hr to 15:00hr, reaching to the highest value at 15:00hr. For year 2004, the O3 accumulation was identical to year 2001 reaching the maximum value at 15:00hr. The rate of accumulation of Ozone in year 2001 was slightly higher than year 2004. The accumulation rate of ozone (O3) and nitrogen oxide (NO) showed similar trend as observed by Riga-Karandinos and Saitanis[6].
CONCLUSION
The results of this study show that the concentration of all the pollutants for the year 2001 was greater than 2004 and the levels of pollutants in autumn and winter period are higher than summer and spring period for Rabia area. In the year 2001, however, the highest concentration of SO2 detected was in the winter period. This is because the winters in Kuwait portray a low temperature, low inversion layers, lesser wind
Author Manuscrip
movements, which do not promote the dispersion of pollutants as compared to summers, which have high temperature, high inversion layers, high wind movements and effective distribution and dilution of pollutants. In the year 2004, the trend is opposite, with the highest concentration detected in summer. This can be explained by the highest demand of power generated from power plants to meet the requirements of the nation resulting into high emissions.
Overall, the concentration of ozone in 2001 is greater than 2004 so that the increasing number of cars increase NOx emissions that neutralize O3 resulting to lower values. In 2001, the highest concentration of O3 was in summer and for year 2004; the highest concentration recorded was in spring. This is because O3 being a product of photochemical oxidation, is highly dependant on solar radiation, and O3 precursor concentrations. In winter, days are short and are cloudier, leading to lower photo-oxidation reactions. In the case of NO2, the overall concentrations were higher in 2001, as compared to 2004. In 2004, the highest concentration detected was in summer and in year 2001; the highest concentration was in autumn. This is simply because the increase in the number of vehicles over the years, have scaled up the production of NO, subduing the ozone production, which inevitably subdues NO2 formation.
Weekdays/weekend effect on O3 and NO has been investigated for both years 2001 and 2004 for the day hours from 7:00hr to 21:00hr for April to September periods. It was found that on weekend, O3 levels are high due to lower volumes of traffic while on weekdays O3 was neutralized by the excessive NO produced by high traffic density.
ACKNOWLEDGMENT
The authors wish to thank the Kuwait Environmental Protection Authority (KEPA) for the field data used in this study (2001, 2004).
REFERENCES
1. Al-Temeemi, A.S., 1995. Climatic design techniques for reducing cooling energy consumption in Kuwait houses. Energy and Building, 23: 41-48. 2. Brunekreef, B. and S.T. Holgate, 2002. Air pollution
and health. Lancet, 360: 1233-1242.
3. Bouhamra, W.S., 1995. Estimation of Volatile Organic Compounds in Kuwaiti houses after the Gulf war. Environmental Pollution, 105: 221-229.
4. Bouhamra, W.S., S.S. BoHamra and M.S. Thomsom, 1997. Determination of Volatile Organic Compounds in indoor and outdoor air of residences in Kuwait. Environment International, 23: 197-204. 5. Bouhamra, W.S. and S.A. Abdul-Wahab, 1999.
Description of outdoor air quality in a typical residential area in Kuwait. Environmental Pollution, 90: 121-125.
6. Riga-Karandinos, A.N. and C. Saitanis, 2005. Comparative assessment of ambient air quality in two typical Mediterranean coastal cities Greece. Chemosphere, 59: 1125-1136.
7. Pont, V. and J. Fontan, 2001. Comparison between weekend and weekday ozone concentration in large cities in France. Atmospheric Environment, 35: 1527-1535.
8. Vecchi, R. and G. Valli, 1999. Ozone assessment in the southern part of the Alps. Atmospheric Environment, 33: 97-109.
9. Abdul-Wahab, S.A., and S.M. Al-Alawi, 2002. Assessment and prediction of tropospheric ozone concentration levels using artificial neural networks. Environmental Modeling and Software, 17: 219-228.
10. Al-Rashidi, M.S., V. Nassehi, R.J. Wakeman, 2005. Investigation of the efficiency of existing air pollution monitoring sites in the state of Kuwait. Environmental Pollution, 138: 219-229.
11. Pun, B.K., Ch. Seigneur, and W. White, 2003. Day-of-week behavior of atmospheric Ozone in three US cities. J. Air Waste Manag. Assoc., 53: 789-801.
12. Marr, L., and R.A. Harley, 2002. Spectral analysis of weekday-weekend differences in ambient Ozone, Nitrogen Oxide and non-Methane hydrocarbons time series in California. Atmospheric environment, 36: 2327-2385.
13. Vandaele, A.C., A. Tsouli, M. Carleer, and R. Colin, 2002. UV Fourier transforms measurements of tropospheric O3, NO2, SO2, benzene and toluene. Environmental Pollution, 116: 193-201. 14. Fujita, E.M., W.R. Stockwell, D.E. Campbell, R.E.
Keislar, and D.R. Lawson, 2003. Evolution of the magnitude and spatial extend of the weekend ozone effect in California’s south coast air basin, 1981-2000. J. Air Waste Manag. Assoc., 53: 802-815. 15. Blanchard, C.L. and S.J. Tanenbaum, 2003.
Differences between weekday and weekend air pollutant levels in southern California. J. Air Waste Manag. Assoc., 53: 816-828.
16. Seinfeld, J. and S. Pandis, 1998. Atmospheric Chemistry and Physics: From Air Pollution to Climate Change. New York: Wiley Interscience