SAGE Open
October-December 2016: 1 –11 © The Author(s) 2016 DOI: 10.1177/2158244016676296 sgo.sagepub.com
Creative Commons CC-BY: This article is distributed under the terms of the Creative Commons Attribution 3.0 License (http://www.creativecommons.org/licenses/by/3.0/) which permits any use, reproduction and distribution of
the work without further permission provided the original work is attributed as specified on the SAGE and Open Access pages (https://us.sagepub.com/en-us/nam/open-access-at-sage).
Article
Introduction
Studies by thousands of scientists have established that human activities are changing the Earth’s climate, princi-pally through raising the concentration of radiatively active (greenhouse) gases in the atmosphere. Reports from the Intergovernmental Panel on Climate Change (IPCC; 2013) bring much of this evidence together. National science acad-emies, and organizations representing hundreds of thousands of scientists, have issued their own statements or reports on the risks of anthropogenic climate change (ACC; National Aeronautics and Space Administration [NASA], 2016). Direct surveys of scientists find levels of agreement on the reality of ACC ranging from 87% among American Association for the Advancement of Science members gen-erally, to 93% among working PhD Earth scientists (Pew Research Center, 2015) or 97% among active climate research scientists (Anderegg, Prall, Harold, & Schneider, 2010; Doran & Zimmerman, 2009). Two analyses of pub-lished research similarly report high-90s agreement on the reality of ACC (Cook et al., 2013; Oreskes, 2004). Synthesizing recent studies, Cook et al. (2016) observe that the level of consensus rises with expertise of the scientists
considered: Agreement is strongest among the most active researchers.
In contrast to the overwhelming consensus among scien-tists, acceptance of ACC remains stubbornly lower among the U.S. public—until recently, polling mostly in the mid-50s on surveys (e.g., Hamilton, Hartter, Lemcke-Stampone, Moore, & Safford, 2015; Leiserowitz, Maibach, Roser-Renouf, Feinberg, & Rosenthal, 2015). Similar fractions of the public concede a scientific consensus on the reality of ACC. Individual perceptions that ACC is real, and that most scientists agree on this point, correlate with each other and have similar background predictors (e.g., Hamilton & Saito, 2015), to such an extent they could be two indicators for one underlying dimension (Kahan, 2015a; Kahan, Jenkins-Smith, & Braman, 2011). Other researchers have argued that their correlation reflects causality. According to this view,
676296SGOXXX10.1177/2158244016676296SAGE OpenHamilton research-article2016
1
University of New Hampshire, Durham, USA
Corresponding Author:
Lawrence C. Hamilton, Sociology Department, University of New Hampshire, Durham, NH 03824, USA.
Email: Lawrence.Hamilton@unh.edu
Public Awareness of the Scientific
Consensus on Climate
Lawrence C. Hamilton
1Abstract
Questions about climate change elicit some of the widest political divisions of any items on recent U.S. surveys. Severe polarization affects even basic questions about the reality of anthropogenic climate change (ACC), or whether most scientists agree that humans are changing the Earth’s climate. Statements about scientific consensus have been contentious among social scientists, with some arguing for consensus awareness as a “gateway cognition” that leads to greater public acceptance of ACC, but others characterizing consensus messaging (deliberate communication about the level of scientific agreement) as a counterproductive tactic that exacerbates polarization. A series of statewide surveys, with nationwide benchmarks, repeated questions about the reality of ACC and scientific consensus many times over 2010 to 2016. These data permit tests for change in beliefs and polarization. ACC and consensus beliefs have similar trends and individual background predictors. Both rose gradually by about 10 points over 2010 to 2016, showing no abrupt shifts that might correspond to events such as scientific reports, leadership statements, or weather. Growing awareness of the scientific consensus, whether from deliberate messaging or the cumulative impact of many studies and publicly engaged scientists, provides the most plausible explanation for this rise in both series. In state-level data, the gap between liberal and conservative views on the reality of ACC did not widen over this period, whereas the liberal–conservative gap regarding existence of a scientific consensus narrowed.
Keywords
Table 1. Climate Change Questions, Respondent Characteristics, and Ideology. Dependent variables
Climate—Which of the following three statements do you think is more accurate?
Climate change is happening now, caused mainly by human activities (1; New Hampshire 63%, United States 63%). Climate change is happening now, but caused mainly by natural forces (0; New Hampshire 27%, United States 30%). Climate change is not happening now (0; New Hampshire 4%, United States 3%).
Don’t know/no answer (0; New Hampshire 6%, United States 4%).
Consensus—Which of the following three statements do you think is more accurate?
Most scientists agree that climate change is happening now, caused mainly by human activities (1; New Hampshire 64%, United States 66%).
There is little agreement among scientists whether climate change is happening now, caused mainly by human activities (0; New Hampshire 27%, United States 26%).
Don’t know/no answer (0; New Hampshire 8%, United States 7%). Independent variables
Age—Respondent age in years (range = 18-96 years; New Hampshire M = 48, United States M = 46).
Female—Respondent gender, female (1; New Hampshire = 51%, United States 51%) or male (0; New Hampshire 49%, United States
49%)
Education—Postgraduate (2; New Hampshire 24%, United States 21%), college graduate (1; New Hampshire 33%, United States 30%),
some college or technical school (0; New Hampshire 24%, United States 31%), high school or less (−1; New Hampshire 20%, United States 18%).
Ideology—Conservative (2; New Hampshire 20%, United States 24%), moderately conservative (1; New Hampshire 23%, United States
20%), moderate (0; New Hampshire 15%, United States 16%), moderately liberal (−1; New Hampshire 21%, United States 21%), liberal (−2; New Hampshire 22%, United States 20%).
Note. Shown with codes used for regressions in Table 2, and weighted response summaries from the 2016 New Hampshire and U.S. (POLES) surveys. POLES = Polar, Environment, and Science.
awareness of the scientific consensus comprises a gateway cognition: a key belief or understanding which, if accepted, makes people more likely also to accept that ACC is real, or that action is needed to slow it (van der Linden, Leiserowitz, Feinberg, & Maibach, 2014). Experimentally, consensus messaging or providing information about the extent of sci-entific agreement can increase subsequently expressed acceptance of ACC (Lewandowsky, Gignac, & Vaughan, 2013; Maibach, Myers, & Leiserowitz, 2014; van der Linden, Leiserowitz, Feinberg, & Maibach, 2015; van der Linden, Leiserowitz, & Maibach, 2016). Some analyses of survey questions about consensus and climate report findings con-sistent with this gateway role (Ding, Maibach, Zhao, Roser-Renouf, & Leiserowitz, 2011; McCright, Dunlap, & Xiao, 2013; also see Aklin & Urpelainen, 2014).
Experimental and survey approaches have complementary strengths and limitations. Experiments can show that certain responses change after exposure to information, which pro-vides good evidence for causality in that context, but does not answer how effects scale up over longer periods in uncontrolled social environments where contrary information is abundant. Non-experimental surveys sample views from such uncon-trolled environments, but provide mainly indirect evidence about causality. The gateway and same-dimension hypotheses need not be mutually exclusive, however. That belief in agree-ment among scientists might in some instances or for some people influence beliefs about ACC, whereas in other cases they measure essentially the same thing, is quite plausible although analytically intractable.
Kahan (2016) takes a position against consensus messaging: “All the ‘social marketing’ of ‘scientific consensus’ does is aug-ment the toxic idioms of contempt that are poisoning our sci-ence communication environment.” In part, his view is based on data in which public perceptions about the scientific consensus show less polarization than perceptions about ACC itself. Also, the degree of polarization (the gap between people with oppo-site ideologies or worldviews) tends to be widest among those with higher education or information by several measures. More basically, he argues that there has been little movement in con-sensus or ACC perceptions despite “a decades-long social mar-keting campaign” to inform people (Kahan, 2015b).
But has there been recent movement on either question? Is polarization consistently rising? These questions are test-able with data from a lengthening time series of random-sample surveys covering one northeastern U.S. state since 2010. The surveys carried two basic questions assessing pub-lic thoughts on the reality of ACC and agreement among sci-entists. Benchmarked by nationwide surveys that asked the same questions, the statewide data provide unique temporal resolution for tracking change.
Survey Data
Hamilton 3
question (climate); the order of response choices is rotated by telephone interviewers to avoid possible bias. One of these choices—climate change is happening now, caused mainly by human activities—corresponds to the central point of many statements by scientific organizations (e.g., the first sentence in American Geophysical Union [AGU], 2013). As of summer 2016, this question had been asked in more than 15,000 inter-views in 26 New Hampshire surveys, plus a similar number of interviews in other regional or national surveys (Hamilton et al., 2015; Hamilton, 2016).
A second question with parallel wording (consensus) asks whether respondents think most scientists agree that climate change is happening now, caused mainly by human activi-ties. This question appeared on 11 of the New Hampshire surveys. Table 1 gives probability-weighted response per-centages for climate and consensus from the most recent year of New Hampshire surveys (2016), and for comparison also the same questions on the U.S. nationwide Polar, Environment, and Science (POLES) survey conducted in August 2016 (Hamilton, 2016). Background characteristics
age, gender, education, and ideology are summarized for both surveys as well.
Figure 1 graphically compares the climate and consensus
responses. Sixty-three percent of both New Hampshire and U.S. respondents think that climate change is happening now, caused mainly by human activities; and 64% or 66%
think that most scientists agree on this point. The visual simi-larity between climate and consensus beliefs is striking, and its implication of substantial overlap is true. Of those who think that climate change is happening now, caused mainly by human activities, 85% (New Hampshire) or 86% (United States) also think that most scientists agree on this point.
How representative are the New Hampshire data? In terms of the overall percentages, Figure 1 suggests they are close. Hamilton et al. (2015) show overlapping confidence intervals across a larger set of New Hampshire and national surveys that asked the same climate question. A Gallup sur-vey in March 2016, with differently worded questions, pro-vides another national benchmark: 59% ± 4% believe the effects of global warming have already begun and 65% ± 4% believe that increases in global temperatures over the past century are due more to human activities than to nature (Saad & Jones, 2016). Although mildly inconsistent with each other, either Gallup result roughly agrees with the 63% ± 2% of New Hampshire respondents choosing now/human. Both Gallup percentages in 2016 were the highest for at least 8 years. The 63% now/human responses to climate on the 2016 POLES survey likewise is notably higher than on national surveys that had asked this question in 2011, 2012, or 2014. New Hampshire results conform to a similar pattern, with 2016 percentages that are highest in the 7-year history of this question.
Figure 1. Response to climate-change and scientific-agreement questions on New Hampshire and U.S. nationwide surveys in 2016.
From these comparisons and others, it appears that New Hampshire provides a usable proxy, giving similar-to-national overall percentages on climate issues although generally wider-than-national divisions by political party (Hamilton et al., 2015). The regional scope of the New Hampshire sur-veys is a limitation, but they also have strengths: sharper (quarterly) temporal resolution than national counterparts, with consistent frames, wording, and methods under the same investigators throughout the whole series.
Changing Views on Climate and
Consensus
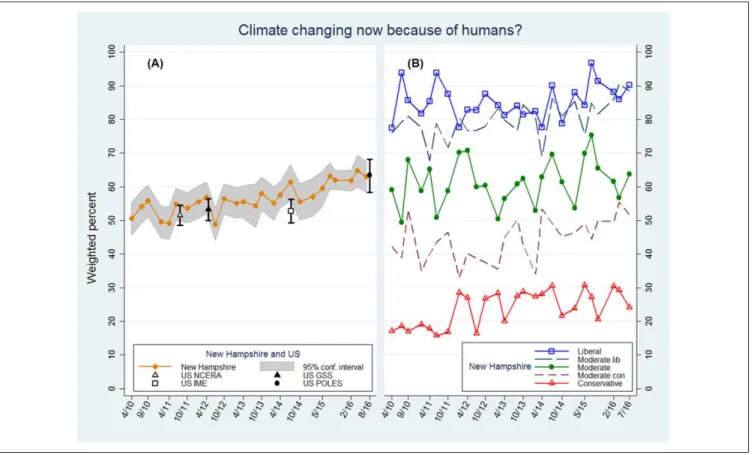
Figure 2A graphs the percentage of now/human responses to cli-mate on 26 New Hampshire surveys (n = 15,931) from April 2010 to July 2016, along with four national surveys. A July 2016 New Hampshire survey and the August 2016 U.S. POLES sur-vey form the two rightmost data points in Figure 2A. This plot suggests an uneven upward trend in acceptance of ACC, amount-ing to about 10 points over this period. New Hampshire’s confi-dence intervals overlap with each of the four national surveys.
National Community and Environment in Rural America (NCERA) is a representative 50-state telephone survey orga-nized by University of New Hampshire researchers in sum-mer 2011 (n = 2,006).
General Social Survey (GSS) is a representative national survey based on face-to-face interviews, conducted by the National Opinion Research Center, University of Chicago, in 2012 (n = 1,295).
iMediaEthics Poll on Climate Change (IME) is a repre-sentative national telephone survey conducted by Princeton Survey Research Associates International in July 2014 (n = 1,002).
POLES is a representative national telephone survey organized by University of New Hampshire and Columbia University researchers in August 2016 (n = 704).
Hamilton et al. (2015) give references concerning the NCERA, GSS, and IME surveys. The supporting informa-tion archived with that paper includes complete NCERA and IME data sets. The August 2016 POLES survey is described by Hamilton (2016).
Ideological or partisan divisions are a dominant feature of climate-change questions in surveys. For the New Hampshire time series, Figure 2B breaks down the percentage of now/ human responses to climate by ideology, on a 5-point scale from liberal to conservative.2 Percentages based on the smaller subsamples forming each ideological category exhibit more random variation, but show a persistently wide gap between conservatives and liberals. Figure 2B visualizes the strong polarization of climate-change responses in surveys.
Figure 2. Percentage who think climate change is happening now, caused mainly by human activities.
Hamilton 5
The most conservative respondents are farthest from other groups; see Hamilton and Saito (2015) for other instances of that pattern.
Figure 3 employs a similar format to display results for the
consensus question, tracking the percentage of respondents who think most scientists agree that human activities are chang-ing the climate. It bears emphasizchang-ing that this consensus ques-tion asks whether respondents think that most scientists agree about the existence of ACC, not about all of its details where scientific disagreements and new advances naturally occur.
Although based on fewer interviews (n = 5,872 from 11 sur-veys for New Hampshire, along with the NCERA, IME, and POLES national surveys), the consensus results in Figure 3 generally resemble those for climate in Figure 2. There is an uneven upward drift of roughly 10 points overall (Figure 3A). Again, the confidence intervals of New Hampshire results overlap with those of contemporary national surveys. The lib-eral–conservative gap in Figure 3B is slightly narrower than that in Figure 2B: Beliefs about agreement among scientists are marginally less polarized than beliefs about ACC itself.
Individual Background and Ideology Effects
In Figures 2 and 3, climate and consensus beliefs exhibit similar patterns of slow upward drift. To test formally
whether the percentage accepting ACC or recognizing agree-ment among scientists has risen, we can include year in a standard regression framework that has been widely used to model individual-level predictors of climate beliefs.
Table 2 gives results from weighted logit regression of
climate and consensus on respondent age, sex, education, and ideology (questions and coding defined in Table 1).3 Models 1 and 2, based on New Hampshire data, also test for net effects from survey year (2010-2016). Model 1 does so using data from all 26 New Hampshire surveys that carried the climate question (estimation sample, n = 14,265), whereas Model 2 employs only the 11 surveys that asked the
consensus question (estimation sample, n = 5,313). Models 3 and 4 give results from the POLES survey for a national comparison (2016 only). The fit of each model is summa-rized by probability-weighted versions of the count R2 and adjusted count R2 statistics described in Long and Freese (2014).
Interaction effects involving education and ideology have been detected in many survey and experimental data sets. Their common form is that ideological divisions regarding climate change widen with education, such that the best edu-cated partisans stand the farthest apart. This occurs not only with education but also with other information indicators such as self-assessed understanding, or more objective tests
Figure 3. Percentage who think most scientists agree that human activities are changing the climate.
of science literacy, numeracy, cognitive reflection, or science intelligence. It occurs also whether ideology is indicated by respondent’s self-identification on a liberal to conservative scale, political party, religiosity, or more elaborate measures of worldview (e.g., Hamilton, 2008, 2011; Hamilton & Keim, 2009; Hamilton, Cutler, & Schaefer, 2012; Kahan, 2015a; Kahan et al., 2011; McCright & Dunlap, 2011; Shao, Keim, Garland, & Hamilton, 2014). Finally, such interac-tions affect some non-climate views too—for example, regarding evolution, vaccines, scientists, or environmental protection in general (e.g., Hamilton, Colocousis, & Duncan, 2010; Hamilton, Hartter, & Saito, 2015; Hamilton & Safford, 2015; Hamilton & Saito, 2015).
The models in Table 2 fit reasonably well (adjusted count
R2 from 18%-34%) and confirm that climate-change and consensus beliefs have mostly the same individual-level pre-dictors. Coefficients shown are odds ratios, or multiplicative effects on the odds of thinking that humans are changing the climate (climate = 1) or that most scientists agree (consensus
= 1). The odds of thinking that humans are changing the cli-mate, or that most scientists agree on this, decline with age. Women more often than men accept that humans are chang-ing the climate, but gender makes little difference in percep-tions of the scientific consensus. Odds ratios significantly above 1.0 for the main effect of education indicate that among moderate respondents (ideology = 0), the odds of accepting ACC, or that scientists agree, increase with higher education. Odds ratios below 1.0 for the main effect of ideol-ogy indicate that among respondents with technical school or some college education (education = 0), the odds of accept-ing ACC, or that scientists agree, decline as ideology becomes more conservative.
Figure 4 visualizes the New Hampshire education × ide-ology interaction effects, which are significant and similar in the U.S. POLES data as well. These adjusted marginal plots
(Mitchell, 2012) depict probabilities and 95% confidence intervals. Their right-opening megaphone shapes resemble those found in many studies cited above. Here, we see that among liberals and moderates, the probability of thinking that humans are changing the climate, or that most scientists agree on this point, rises with education. Among moderately conservative respondents, however, education has virtually no effect. Among the most conservative, belief that humans are changing the climate or that most scientists agree declines with higher education.
Viewing plots of this general type, some analysts have concluded that information itself causes polarization. Given the occurrence of similar patterns with diverse information or education indicators, however, it seems more plausibly attributed to general processes of biased assimilation
(Corner, Whitmarsh, & Xenias, 2012; McCright & Dunlap, 2011), elite cues (Brulle, Carmichael, & Jenkins, 2012; Darmofal, 2005), and related concepts (Campbell & Kay, 2014; Kahan et al., 2011; Taber & Lodge, 2006; Wood & Vedlitz, 2007). Better educated or informed individuals more actively acquire information, which sometimes involves fil-tering to support ideological beliefs. In reactions to experi-mental scenarios, such processes might appear left/right symmetrical, with opposite bias affecting both ends of the spectrum. In practice, however, it is much easier to find top-ics (such as climate or evolution) where liberal and moderate views align with a major scientific consensus, whereas con-servatives oppose it, rather than the reverse. A corresponding asymmetry appears in survey findings that liberals and mod-erates express greater trust than conservatives regarding sci-ence in general (Gauchat, 2012; Nadelson et al., 2014), or as a source of information in specific domains including not only climate and evolution but also vaccines, nuclear power safety, and genetically modified organisms (Hamilton, 2015; Hamilton et al., 2015).
Table 2. Ideology, Background Characteristics, and Year of Survey as Predictors of Climate-Change and Scientific-Agreement Responses (Variables Defined in Table 1).
Model
Predictor 1. NH Climate 2. NH Consensus 3. U.S. Climate 4. U.S. Consensus
Age 0.988*** 0.993** 0.984** 0.985**
Female 1.315*** 1.029 1.463 0.938
Education 1.208*** 1.240*** 1.262* 1.303**
Ideology 0.528*** 0.543*** 0.542*** 0.562***
Education × Ideology 0.828*** 0.837*** 0.725*** 0.849*
Year 1.057*** 1.094*** — —
Estimation sample 14,266 5,313 601 601
F statistic 301.5*** 125.3*** 171.1*** 126.0***
Count R2 .72 .71 .75 .73
Adjusted count R2 .34 .33 .29 .18
Note. Odds ratios from weighted logistic regressions using NH or national POLES (U.S.) survey data. NH = New Hampshire; POLES = Polar, Environment, and Science.
Hamilton 7
Time plots in Figures 2A and 3A suggest that public acceptance of ACC and a scientific consensus have drifted upward over the past 7 years. Models 1 and 2 in Table 2 test this hypothesis by including survey year along with respon-dent characteristics among the predictors. Both find signifi-cant (p < .001) positive effects. The odds of thinking that human activities are changing the climate increased about 6% (multiplied by 1.06) per year over this period, whereas the odds of thinking that most scientists agree increased somewhat faster, by about 9% per year. If awareness of the scientific consensus acts as a gateway cognition, then we might expect acceptance of ACC to change a bit more slowly as it seems to do here.
Trends in Polarization
The New Hampshire analysis agrees with national reports that public belief in the reality of ACC, and of a scientific consensus on this point, have recently risen (Saad & Jones, 2016). There also is evidence that national polarization con-currently increased (Dunlap, McCright, & Yarosh, 2016), but in New Hampshire, it appears to have decreased. Figure 5 quantifies polarization as the distance between climate views of liberal and conservative respondents, or between those of moderately liberal and moderately conservative respondents.
Graphed points correspond to distances from lowest to high-est lines (or from second lowhigh-est to second highhigh-est) in Figure 2B. Averaged by simple regression in the graph, the liberal/ conservative gap narrows slightly, and not significantly, from 66 to 58 points. The moderately liberal/moderately conserva-tive gap remains unchanged at about 36.
Figure 6 performs a similar analysis addressing the more contentious (among researchers) issue of polarization about the scientific consensus. In this case, both trend lines show mild but statistically significant narrowing, by about 10 points, of the gap between liberals and conservatives. Thus, our New Hampshire time series indicate that contrary to national trends (Dunlap et al., 2016), polarization regarding ACC did not increase over this period, and regarding the sci-entific consensus it clearly declined.
Although trends in ideological polarization are inconsis-tent, national and state data agree that overall public accep-tance of ACC and consensus has been rising through small gains across the ideological spectrum. Whether ideological divisions have decreased from high levels (as in New Hampshire), or increased from somewhat lower levels (as nationally), they remain presently quite wide. Ideological indicators dominate the variation in individual views, and ideology moderates effects from education, otherwise the second most important background predictor.
Figure 4. Interaction of education and ideology affecting respondents’ beliefs about the reality of ACC (A), and whether most scientists agree on this reality (B).
Discussion
The scientific case for ACC was well developed before these surveys began (Weart, 2008), with evidence from many disci-plines that seemed persuasive to most scientists (Oreskes,
2004). Incremental advances have continued over the past 7 years, but from a public perspective, the contributions of indi-vidual studies are hard to judge, and prominent new studies are quickly dismissed with scientific-sounding counterarguments from contrarians (Dunlap & McCright, 2015). Recognizing
Figure 5. Liberal–conservative and moderately liberal–moderately conservative gap on acceptance of ACC, 26 New Hampshire surveys 2010-2016 (with linear trends).
Note. ACC = anthropogenic climate change.
Hamilton 9
that the general public has limited ability to evaluate research, or weigh contradictory but scientific-sounding claims, a grow-ing number of science organizations and individual scientists engaging with the public have moved to emphasize the extent of scientific agreement (consensus messaging). This is meant as a useful heuristic to help non-scientists sort through com-peting claims, without asserting that whatever scientists agree upon must be true—broad agreement on the reality of ACC reflects scientists’ own evaluations of the evidence, rather than being evidence for climate change in itself.
Some commentators have proposed that people acknowl-edge a scientific consensus, while rejecting the reality of ACC, because they think most scientists are not credible—and that this group of doubters is growing. Accusations of hoax and con-spiracy fuel such a narrative (Dunlap & McCright, 2015; Lewandowsky, Gignac, & Oberauer, 2013), although the parti-san sources making those accusations tend also to deny the exis-tence of a scientific consensus, painting climate research instead as the project of relatively few individuals and organizations.4
In terms of background characteristics, however, survey respondents who say they think that ACC is not happening, but also think most scientists agree that it is (i.e., respond
climate = 0 but consensus = 1) resemble an unsure and pos-sibly transitional group, rather than committed believers. In several data sets, those with mixed views tend to be some-what younger, less educated, and more likely to identify as moderate or liberal, compared with more “consistent” respondents who reject both ACC and consensus (i.e., cli-mate = 0 and consensus = 0).5
Conclusion
Tracked by a series of closely spaced statewide surveys (bench-marked by nationwide surveys), public acceptance of the real-ity of ACC and of scientific agreement rose gradually from the low fifties in 2010 to low sixties by 2016. The observation that acceptance of ACC and consensus both increased is compatible with the proposition that implicitly or explicitly communicat-ing evidence of agreement among scientists encourages public acceptance of ACC itself. It appears incompatible with the reverse, that communicating evidence of scientific agreement could depress overall public acceptance of ACC.
At the individual level, perceptions regarding the reality of ACC and consensus have similar background predictors. Ideology is the strongest of these predictors. Moreover, ideo-logical differences on ACC and consensus tend to be greatest among respondents with higher education. Over 2010 to 2016, the gap between consensus perceptions of liberals and conservatives decreased in New Hampshire, although it increased nationwide, and in both cases remains large.
Has deliberate or incidental communication reinforcing public awareness of the scientific consensus helped to shift people’s views, or raised acceptance of ACC itself? Our survey results cannot establish causality. But given the lack of visible impacts from events, cumulative efficacy in communicating
the scientific consensus appears a plausible explanation for gradually rising public acceptance of the reality of ACC.
Although public acceptance of ACC rose over the years studied, it remains well below the level of agreement among scientists. Public concern also has not translated into voting behavior because parties have become social identities in the United States. People’s social commitment to keeping the other party from power overcomes the mixture of views they might hold on particular issues (Dunlap et al., 2016; Mason, 2015). Our findings give encouragement but no cause for complacency among scientists engaged with the public; if public engagement has had some success, it still has a long way to go. And public opinion, unlike melting ice sheets, can reverse course very quickly. Future surveys in this series will continue monitoring, for good or bad news.
Author’s Note
Opinions, findings, and conclusions or recommendations in this article are those of the author and do not necessarily represent the views of supporting agencies.
Declaration of Conflicting Interests
The author(s) declared no potential conflicts of interest with respect to the research, authorship, and/or publication of this article.
Funding
The author(s) disclosed receipt of the following financial support for the research, authorship, and/or publication of this article: Climate questions on the Granite State Poll have been supported by a grant from the National Science Foundation (New Hampshire EPSCoR EPS-1101245), and by the Carsey School of Public Policy and the Sustainability Institute at the University of New Hampshire. Support for the POLES survey was provided by the PoLAR Partnership grant from the National Science Foundation (DUE-1239783), with additional help from the New Hampshire EPSCoR Safe Beaches and Shellfish project (IIA-1330641). The NCERA survey was supported by a grant from the Ford Foundation.
Notes
1. The Granite State Poll (GSP) employs trained and supervised interviewers, calling randomly selected landline and cell telephone numbers. Interviews last about 15 min and cover approximately 40 questions, including without emphasis a few about climate. Response rates over this period ranged from 16% to 32% by the American Association for Public Opinion Research’s (AAPOR; 2006) defini-tion 4. Probability weights are calculated to allow minor adjustments for design or sampling bias, and applied to all analyses in this article. The GSP faces reality testing with each election, and becomes nation-ally prominent every 4 years in the context of New Hampshire’s presidential primary (Moore & Smith, 2015). It has proven to be a capable platform for basic research (e.g., Hamilton, 2012).
conservative side (6 on the scale where 5 is simply moderate) and somewhat conservative (7) does not seem to be sharp in many people’s minds, judging by the similar answers these two groups give to other questions. We obtain more consistently interpretable results using a simpler scheme with five categories: liberal (origi-nally 9 or 8), moderately liberal (7 or 6), moderate (5), moderately conservative (4 or 3), or conservative (2 or 1). People who say they do not know or otherwise declined to answer the ideology question (about 7% of the total) do not appear to form a coherent group, so are set aside for analyses involving ideology.
3. Some studies employ much longer lists of predictors, but these often reduce precision (raise standard errors and reduce sample size) while showing inconsistent effects. In contrast, the compact set of predictors used here has proven replicable across dozens of independent data sets, often with agreement not only on statistical significance but effect magnitudes (e.g., odds ratios) as well. For example, Hamilton et al. (2015) apply this general regression framework to the climate question asked in 35 separate surveys.
4. Michael Mann (2013) characterizes the politically focused attacks on individual scientists (rather than large organiza-tions or disciplines that hold similar views) as a “Serengeti strategy,” referencing the way African predators separate indi-vidual prey animals from the herd.
5. Similar observations apply to the mirror-image group (about the same size) who accept anthropogenic climate change (ACC) but do not think most scientists agree (climate = 1 and consensus = 0). They likewise tend to be younger, less edu-cated, and more ideologically diverse than others who share their acceptance of ACC.
References
Aklin, M., & Urpelainen, J. (2014). Perceptions of scientific dis-sent undermine public support for environmental policy. Environmental Science & Policy, 38, 173-177. doi:10.1016/j. envsci.2013.10.006
American Association for Public Opinion Research. (2006). Standard definitions: Final disposition of case codes and out-come rates for surveys (4th ed.). Lenexa, KS: Author.
American Geophysical Union. (2013). Human-induced climate
change requires urgent action (position statement). Retrieved from https://sciencepolicy.agu.org/agu-position-statements-and-letters
Anderegg, W. R. L., Prall, J. W., Harold, J., & Schneider, S. H. (2010). Expert credibility in climate change. Proceedings of the National Academy of Sciences, 107, 12107-12109. doi:10.1073/pnas.1003187107
Brulle, R. J., Carmichael, J., & Jenkins, J. C. (2012). Shifting public opinion on climate change: An empirical assessment of factors influencing concern over climate change in the U.S., 2002– 2010. Climatic Change, 114, 169-188.
Campbell, T. H., & Kay, A. C. (2014). Solution aversion: On the relation between ideology and motivated disbelief. Journal of Personality and Social Psychology, 107, 809-824. doi:10.1037/ a0037963
Cook, J., Nuccitelli, D., Green, S. A., Richardson, M., Winkler, B., Painting, R., . . . Skuce, A. (2013). Quantifying the con-sensus on anthropogenic global warming in the scientific lit-erature. Environmental Research Letters, 8, Article 024024. doi:10.1088/1748-9326/8/2/024024
Cook, J., Oreskes, N., Doran, P. T., Anderegg, W. R. L., Verheggen, B., Maibach, E. W., . . . Rice, K. (2016). Consensus on consen-sus: A synthesis of consensus estimates on human-caused global warming. Environmental Research Letters, 11, Article 048002. doi:10.1088/1748-9326/11/4/048002
Corner, A., Whitmarsh, L., & Xenias, D. (2012). Uncertainty, scep-ticism and attitudes towards climate change: Biased assimila-tion and attitude polarisaassimila-tion. Climatic Change, 114, 463-478. Darmofal, D. (2005). Elite cues and citizen disagreement with
expert opinion. Political Research Quarterly, 58, 381-395. Ding, D., Maibach, E. W., Zhao, X., Roser-Renouf, C., &
Leiserowitz, A. (2011). Support for climate policy and soci-etal action are linked to perceptions about scientific agree-ment. Nature Climate Change, 1, 462-466. doi:10.1038/ NCLIMATE1295
Doran, P. T., & Zimmerman, M. K. (2009). Examining the sci-entific consensus on climate change. Earth & Space Science News, 90(3), 22-23. doi:10.1029/2009EO030002
Dunlap, R. E., & McCright, A. M. (2015). Challenging climate change: The denial countermovement. In R. E. Dunlap & R. J. Brulle (Eds.), Climate change and society: Sociological perspec-tives (pp. 300-332). New York, NY: Oxford University Press. Dunlap, R. E., McCright, A. M., & Yarosh, J. H. (2016). The political
divide on climate change: Partisan polarization widens in the U.S. Environment: Science and Policy for Sustainable Development, 58(5), 4-23. doi:10.1080/00139157.2016.1208995
Gauchat, G. (2012). Politicization of science in the public sphere: A study of public trust in the United States, 1974
to 2010. American Sociological Review, 77, 167-187.
doi:10.1177/0003122412438225
Hamilton, L. C. (2008). Who cares about polar regions? Results from a survey of U.S. public opinion. Arctic, Antarctic, and Alpine Research, 40, 671-678.
Hamilton, L. C. (2011). Education, politics and opinions about cli-mate change evidence for interaction effects. Climatic Change, 104, 231-242. doi:10.1007/s10584-010-9957-8
Hamilton, L. C. (2012). Did the arctic ice recover? Demographics of true and false climate facts. Weather, Climate, and Society, 4, 236-249. doi:10.1175/WCAS-D-12-00008.1
Hamilton, L. C. (2015). Conservative and liberal views of science:
Does trust depend on topic? Durham, NH: Carsey School
of Public Policy. Retrieved from http://scholars.unh.edu/ carsey/252/
Hamilton, L. C. (2016). Where is the North Pole? An election-year survey on global change. Durham, NH: Carsey School of Public Policy. Retrieved from http://scholars.unh.edu/carsey/285/ Hamilton, L. C., Colocousis, C. R., & Duncan, C. M. (2010). Place
effects on environmental views. Rural Sociology, 75, 326-347. doi:10.1111/j.1549-0831.2010.00013.x
Hamilton, L. C., Cutler, M. J., & Schaefer, A. (2012). Public knowledge and concern about polar-region warming. Polar Geography, 35, 155-168. doi:10.1080/1088937X.2012.684155 Hamilton, L. C., Hartter, J., Lemcke-Stampone, M., Moore, D.
W., & Safford, T. G. (2015). Tracking public beliefs about anthropogenic climate change. PLoS ONE, 10(9), e0138208. doi:10.1371/journal.pone.0138208
Hamilton 11
Hamilton, L. C., & Keim, B. D. (2009). Regional variation in perceptions about climate change. International Journal of Climatology, 29, 2348-2352. doi:10.1002/joc.1930
Hamilton, L. C., & Safford, T. G. (2015). Environmental views from the coast: Public concern about local to global marine issues. Society & Natural Resources, 28, 57-74. doi:10.1080/ 08941920.2014.933926
Hamilton, L. C., & Saito, K. (2015). A four-party view of US envi-ronmental concern. Environmental Politics, 24, 212-227. doi:10. 1080/09644016.2014.976485
Intergovernmental Panel on Climate Change. (2013). Climate change 2013: The physical science basis (Contribution of Working Group I to the Fifth Assessment Report of the Intergovernmental Panel on Climate Change). Cambridge, UK: Cambridge University Press. doi:10.1017/CBO9781107415324
Kahan, D. M. (2015a). Climate-science communication and the measurement problem. Advances in Political Psychology, 36(Suppl. 1), 1-43. doi:10.1111/pops.12244
Kahan, D. M. (2015b). Against consensus messaging. The Cultural Cognition Project at Yale Law School. Retrieved from http:// www.culturalcognition.net/blog/2015/6/10/against-consensus-messaging.html
Kahan, D. M. (2016). “They already got the memo” part 2: More data on the *public consensus* on what “climate scientists think” about human-caused global warming. The Cultural Cognition Project at Yale Law School. Retrieved from http://culturalcogni- tion.net/blog/2016/2/9/they-already-got-the-memo-part-2-more-data-on-the-public-con.html
Kahan, D. M., Jenkins-Smith, H., & Braman, D. (2011). Cultural cognition of scientific consensus. Journal of Risk Research, 14, 147-174. doi:10.1080/13669877.2010.511246
Leiserowitz, A., Maibach, E., Roser-Renouf, C., Feinberg, G., & Rosenthal, S. (2015). Politics and global warming, Fall 2015. Yale University and George Mason University. New Haven, CT: Yale Program on Climate Change Communication. Retrieved from http://climatecommunication.yale.edu/publications/voters-prefer-candidates-who-support-climate-friendly-policies/ Lewandowsky, S., Gignac, G. E., & Oberauer, K. (2013). The role
of conspiracist ideation and worldviews in predicting rejection of science. PLoS ONE, 8(10), e75637. doi:10.1371/journal. pone.0075637
Lewandowsky, S., Gignac, G. E., & Vaughan, S. (2013). The pivotal role of perceived scientific consensus in acceptance of science. Nature Climate Change, 3, 399-404. doi:10.1038/nclimate1720 Long, J. S., & Freese, J. (2014). Regression models for
categori-cal dependent variables using Stata. College Station, TX: Stata Press.
Maibach, E., Myers, T., & Leiserowitz, A. (2014). Climate scien-tists need to set the record straight: There is a scientific consen-sus that human-caused climate change is happening. Earth’s Future, 2, 295-298. doi:10.1002/2013EF000226
Mann, M. E. (2013). The hockey stick and the climate wars: Dispatches from the front lines. New York, NY: Columbia University Press.
Mason, L. (2015). “I disrespectfully agree”: The differential effects of partisan sorting on social and issue polarization. American Journal of Politics, 59, 128-145. doi:10.1111/ajps.12089 McCright, A. M., & Dunlap, R. E. (2011). The politicization of climate
change and polarization in the American public’s views of global warming, 2001–2010. The Sociological Quarterly, 52, 155-194.
McCright, A. M., Dunlap, R. E., & Xiao, C. (2013). Perceived scientific agreement and support for government action on climate change in the USA. Climatic Change, 119, 511-518. doi:10.1007/s10584-013-0704-9
Mitchell, M. N. (2012). A visual guide to Stata graphics (3rd ed.). College Station, TX: Stata Press.
Moore, D. W., & Smith, A. E. (2015). The first primary: New
Hampshire’s outsize role in presidential nominations.
Lebanon: University of New Hampshire Press.
Nadelson, L., Jorcyk, C., Yang, D., Smith, M. J., Matson, S., Cornell, K., & Husting, V. (2014). I just don’t trust them: The development and validation of an assessment instrument to measure trust in science and scientists. School Science and Mathematics, 114, 76-86. doi:10.1111/ssm.12051
National Aeronautics and Space Administration. (2016). Scientific consensus: Earth’s climate is warming. Author. Retrieved from http://climate.nasa.gov/scientific-consensus
Oreskes, N. (2004). The scientific consensus on climate change. Science, 306, 1686.
Pew Research Center. (2015). An elaboration of AAAS scien-tists’ views. Author. Retrieved from http://www.pewinternet. org/2015/07/23/an-elaboration-of-aaas-scientists-views/ Saad, L., & Jones, J. M. (2016). U.S. concern about global warming
at eight-year high. Gallup. Retrieved from http://www.gallup. com/poll/190010/concern-global-warming-eight-year-high. aspx?g_source=CATEGORY_CLIMATE_CHANGE&;g_ medium=topic&g_campaign=tiles
Shao, W., Keim, B. D., Garland, J. C., & Hamilton, L. C. (2014). Weather, climate, and the economy: Explaining risk percep-tions of global warming, 2001–2010. Weather, Climate, and Society, 6, 119-134. doi:10.1175/WCAS-D-13-00029.1 Taber, C. S., & Lodge, M. (2006). Motivated skepticism in the
evaluation of political beliefs. American Journal of Political Science, 50, 755-769.
van der Linden, S. L., Leiserowitz, A. A., Feinberg, G. D., & Maibach, E. W. (2014). How to communicate the scientific consensus on climate change: Plain facts, pie charts or metaphors? Climatic Change, 126, 255-262. doi:10.1007/s10584-014-1190-4
van der Linden, S. L., Leiserowitz, A. A., Feinberg, G. D., & Maibach, E. W. (2015). The scientific consensus on climate change as a gateway belief: Experimental evidence. PLoS ONE, 10(2), e0118489. doi:10.1371/journal.pone.0118489 van der Linden, S. L., Leiserowitz, A. A., & Maibach, E. (2016).
Communicating the scientific consensus on human-caused cli-mate change is an effective and depolarizing public engage-ment strategy: Experiengage-mental evidence from a large national replication study. Social Science Research Network. Retrieved from http://ssrn.com/abstract=2733956
Weart, S. R. (2008). The discovery of global warming: Revised and expanded edition. Cambridge, MA: Harvard University Press. Wood, B. D., & Vedlitz, A. (2007). Issue definition, information
processing, and the politics of global warming. American Journal of Political Science, 51, 552-568.
Author Biography
Lawrence C. Hamilton is professor of Sociology and senior