Optical Coherence Tomography Identifies
Lower Labial Salivary Gland Surface Density
in Cystic Fibrosis
Jan K. Nowak1*, Ireneusz Grulkowski2, Karol Karnowski2, Maciej Wojtkowski2, Jaroslaw Walkowiak1
1Department of Pediatric Gastroenterology and Metabolic Diseases, Poznan University of Medical Sciences, ul. Szpitalna 27/33, 60–572 Poznan, Poland,2Institute of Physics, Faculty of Physics, Astronomy and Informatics, Nicolaus Copernicus University, ul. Grudziadzka 5, 87–100 Torun, Poland
Abstract
The labial minor salivary glands (LSGs) are easily accessible mucus-secreting structures of the alimentary tract that may provide new information on the basis of gastrointestinal com-plications of cystic fibrosis (CF). It was shown that they are destructed in the course of cystic fibrosis. We employed wide-field, micrometer resolutionin vivooptical coherence tomogra-phy to assess the surface density of LSGs in 18 patients with CF and 18 healthy subjects. The median LSGs’surface densities in CF patients, and in the control group were 4.32 glands/cm2and 6.58 glands/cm2, respectively (p = 0.006; Mann-Whitney U test). A lower LSG surface density is a previously unrecognized CF-related pathology of the
alimentary tract.
Introduction
Cystic fibrosis (CF) is a genetic disease resulting from dysfunction of the CF transmembrane conductance regulator (CFTR) [1]. CFTR-related disruption of transmembrane ion transport affects the exocrine glands and results in intestinal, pancreatic, and hepatobiliary complications [2]. Among the mucus-secreting structures of the alimentary tract affected by CF are the labial salivary glands (LSGs) [3–6].
Optical coherence tomography (OCT) enables non-invasive visualization of the internal structures of tissues. OCT is analogous to ultrasound imaging except that it uses infrared light instead of acoustic waves [7]. High-speed OCT allows for cross-sectional and volumetric imag-ing of tissues at micrometer resolutionin vivoand in real time. OCT was initially used in
oph-thalmology and has also found valuable applications in other medical specialties, including gastroenterology [8–9] and more recently pulmonology [10–11]. Different segments of the ali-mentary tract can be imaged with OCT revealing microstructural details of their mucous mem-branes [12].
a11111
OPEN ACCESS
Citation:Nowak JK, Grulkowski I, Karnowski K, Wojtkowski M, Walkowiak J (2015) Optical Coherence Tomography Identifies Lower Labial Salivary Gland Surface Density in Cystic Fibrosis. PLoS ONE 10(1): e0117517. doi:10.1371/journal. pone.0117517
Academic Editor:Nades Palaniyar, The Hospital for Sick Children and The University of Toronto, CANADA
Received:April 28, 2014
Accepted:December 26, 2014
Published:January 26, 2015
Copyright:© 2015 Nowak et al. This is an open access article distributed under the terms of the
Creative Commons Attribution License, which permits unrestricted use, distribution, and reproduction in any medium, provided the original author and source are credited.
Data Availability Statement:The complete dataset (36 volumetric datasets and a spreadsheet) is available under a Creative Commons licence from Zenodo, hosted at CERN. DOI:10.5281/zenodo. 13257.
Funding:Supported by the Polish National Science Centre grants (JKN—no. 2013/09/N/NZ5/02820;
MW—no. 2011/02/A/ST2/00302)—http://ncn.gov.pl/,
The aim of the study was to assess the differences in LSGs’surface density between CF pa-tients and healthy subjects (HS) by applying a new generation of OCT technology, called swept source OCT (SS-OCT), in thein vivoimaging of the mucosa of the lower lip.
Materials and Methods
Study participants
The sample size of each group (n = 18) was determined at the planning stage assuming a pa-rameter value difference of 30%, a standard deviation of 30%, an alpha error level of 0.05, and the power of 0.84. The inclusion criterion for patients was a diagnosis of CF made according to the Cystic Fibrosis Foundation consensus guidelines [13]. The inclusion criterion for volun-teers was no acute or chronic disease. The exclusion criteria were: smoking, severe dental dis-ease, treatment with levothyroxine, and pregnancy.
The information on genotypes and median forced expiratory volume in 1 second were col-lected from the Polish National Cystic Fibrosis Registry. Exocrine pancreatic insufficiency was diagnosed using fecal elastase-1 concentration measurements and quantitative stool fat assess-ment in order to characterize the patient population [14]. Fecal elastase-1 concentrations were assessed using ELISA (ScheBo Biotech AG, Gießen, Germany) [15]. Seventy-two-hour quanti-tative stool fat test was carried out using the classic Van de Kamer method [16]. The study was approved by the institutional review boards at the Nicolaus Copernicus University in Torun (KB189/2013) and at the Poznan University of Medical Sciences (414/13). The research ad-hered to the tenets of the Declaration of Helsinki. The nature of the study was explained in de-tail to all its participants prior to obtaining their written consent.
Prototype Swept Source OCT instrument
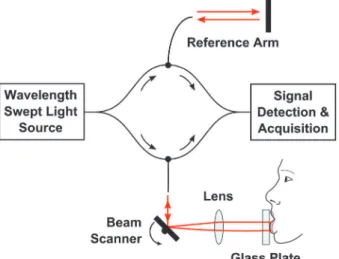
The prototype high-speed SS-OCT instrument with a wavelength tunable light source used in the study is shown schematically inFig. 1. The technical details of the design are given else-where [17]. The axial and transverse resolutions of the instrument were 6.7μm and 20μm in
tissue, respectively. The tissue imaging depth range was 3.4 mm. The instrument had a fiber-optic interferometer configuration. The light was emitted by a wavelength swept light source engine (Axsun Technologies Inc., Billerica, MA) operating at the speed of 50,000 sweeps per
Fig 1. A schematic of the fiber-optic SS-OCT instrument for lip mucosa imaging.
doi:10.1371/journal.pone.0117517.g001 design, data collection and analysis, decision to
publish, or preparation of the manuscript.
second. Therefore, the SS-OCT system could acquire 50,000 A-scans (depth scans) per second. The central wavelength of the light was 1310 nm, which enabled deep penetration of light into tissue. The wavelength tuning range of ~100 nm determined high axial imaging resolution. The incident power on the mucosa was 6.2 mW at 1310 nm wavelength, which is consistent with the American National Standard Institute standards for safe exposure [18]. Two-axis scanning system in the sample arm enabled lateral beam scanning of the tissue. The sterile glass plate (individual for each participant) was included in the interface of the system to in-crease patient comfort and to assure uniform scanning conditions. The patient interface of the system was equipped with a sterile glass plate to enable easy exposition of the lower lip mucosa. Application of the glass plate allowed for optimization of image quality since the light focus po-sition could be controlled. The light coming back from the reference and sample arms generat-ed an interferometric signal. The detection and acquisition unit consistgenerat-ed of a dual-balance photodetector (PDB 110C; Thorlabs Inc., Newton, NJ) and a high-speed analog-to-digital card (Gage Compuscope 14200; Lachine, QC).
Interference fringes recorded in each sweep period carried information on the internal (depth) microstructure of the imaged tissue (A-scan). Therefore, transverse scanning allowed for acquisition of cross-sectional images (B-scans) and volumetric data sets. Volumetric imag-ing is the most comprehensive since it enables three-dimensional reconstruction of the tissue morphology. Analogous to ultrasound, OCT maps the intensity of light backscattered from tis-sue structures that exhibit different optical properties.
Data acquisition and processing
During actual measurement, the subjects gently pressed the inner surface of the lower lip against a sterile glass plate. Three wide-field volumetric OCT data sets consisting of 400×400 A-scans were obtained in each participant by raster scanning over a 1.73 × 1.73 cm2area of the lower lip, yielding a useful imaging surface of 2.43 cm2, which was limited by the lens aperture. The participants removed the head from the chinrest between imaging sessions. Instruction containing the same set of information was provided to all volunteers before their imaging ses-sions. The comfort level was self-assessed by the participants immediately after OCT scanning using a 5-item Likert scale (1 = very bad; 5 = very good).
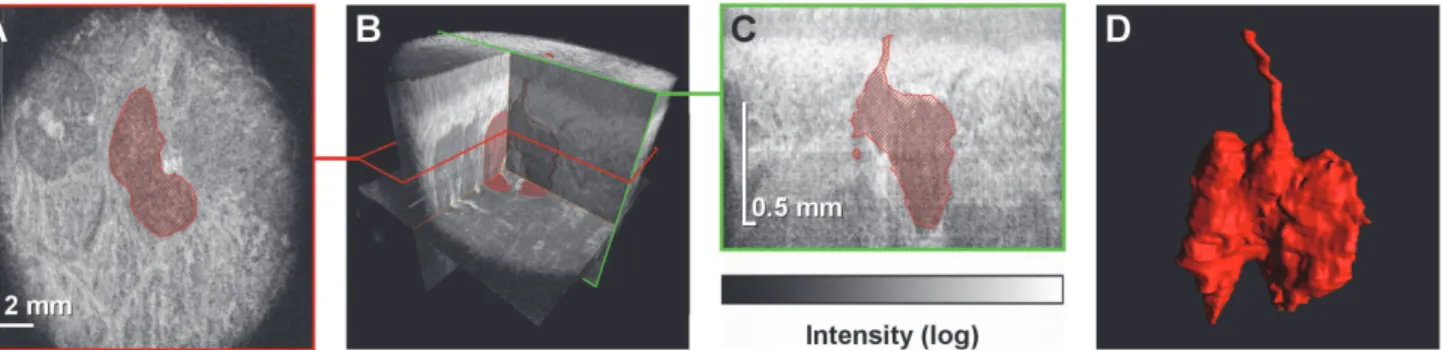
It took 3.2 seconds to acquire a single volumetric data set that consisted of 400×400 A-scans (Fig. 2). Each data set was post-processed to generate a set of B-scans. To generate projection images (C-scans), the mucosal surface was segmented and a tissue flattening procedure was
Fig 2. Identification of a single LSG in a volumetric data set obtained using OCT.(A) A projection image (C-scan) extracted from the volumetric data set.
The LSG is indicated in red. (B) Virtually any section can by extracted from a volumetric OCT data set. (C) A cross-sectional image (B-scan) extracted from the volumetric data set illustrates the high axial resolution of the method, which allows for excretory duct recognition. (D) A three-dimensional reconstruction of the microstructure of the segmented LSG along with its excretory duct.
implemented. Three-dimensional (3-D) rendering of the glands was performed using a 3-D data visualization platform (Amira 5.0; FEI Visualization Sciences Group, Burlington, MA) (S1 Video).
LSG identification and statistical analysis
LSGs were manually identified in OCT images using Fiji image processing software (Fig. 2) [19]. An interactive pen display was used to navigate the volumetric datasets and to delineate the borders of the individual LSG for 3-D gland reconstruction. In order to perform quantita-tive analysis, OCT B-scans were analyzed for the presence of the excretory ducts and the glan-dular tissue. OCT C-scans were then used to verify the initial findings and the LSGs were counted thereafter. In cases of foci of glandular tissue clearly visible at the borders of the useful imaging surface the presence of an excretory duct was not required for LSG identification. Apart from this exception foci of glandular tissue visible on the C-scans could be matched to individual excretory ducts. Intraobserver and interobserver reproducibilities of the gland iden-tification method assessed by calculating the intraclass correlation coefficient were 0.89 and 0.80, respectively. A statistical analysis was carried out using STATISTICA 10 (StatSoft Inc., Tulsa, OK). The Mann—Whitney U test was applied to compare distributions of parameters between the studies groups.
Results
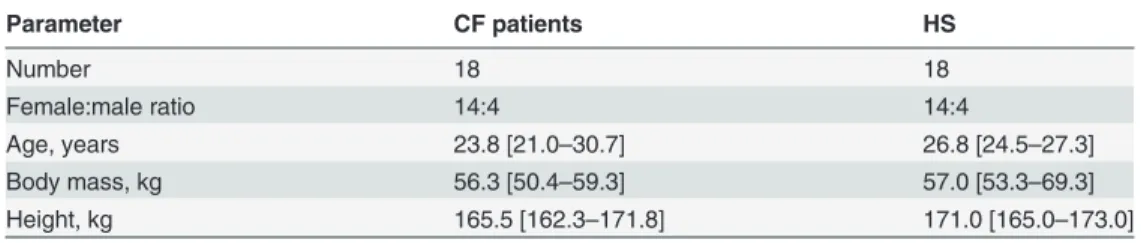
Thirty-six volunteers were enrolled for the study, including 18 patients with CF (Table 1). The diagnosis of CF was made on the basis of clinical presentation, sweat test results, and genetic testing according to the aforementioned guidelines [13]. The patients had the following geno-types: F508del/F508del (c.1521_1523delCTT/c.1521_1523delCTT; n = 10), F508del/3849+10kB C>T (c.1521_1523delCTT/c.3717+12191C>T; n = 4), F508del/unknown (c.1521_1523delCTT/ unknown; n = 2), F508del/CFTRdel2,3 (c.1521_1523delCTT/c.54–5940_273+10250del21kb; n = 1), CFTRdel2,3/3849+10kB C>T (c.54–5940_273+10250del21kb/c.3717+12191C> T; n = 1). Patients’median forced expiratory volume in 1 second was 54% [interquartile range: 36–71%]. Fifteen patients (83%) were diagnosed with exocrine pancreatic insufficiency. On a scale from 1 to 5 (1 being the worst, 5 being the highest), the median [interquartile range] rating of participant comfort level during the examination was 5.0 [5.0–5.0].
Volumetric SS-OCT enabled non-invasive wide-field”optical biopsy”of LSGs demonstrat-ing their comprehensive microarchitectural details. Previous studies have shown that OCT can detect glands in different parts of the alimentary tract as hypointense area, which were later identified as glandular structures by conventional histology technique [20–22]. To confirm ac-curate detection of LSG excretory ducts, OCT images were compared to histological sections of
Table 1. Group characteristics. Median values and interquartile ranges are presented.
Parameter CF patients HS
Number 18 18
Female:male ratio 14:4 14:4
Age, years 23.8 [21.0–30.7] 26.8 [24.5–27.3]
Body mass, kg 56.3 [50.4–59.3] 57.0 [53.3–69.3]
Height, kg 165.5 [162.3–171.8] 171.0 [165.0–173.0]
CF—cysticfibrosis, HS—healthy subjects
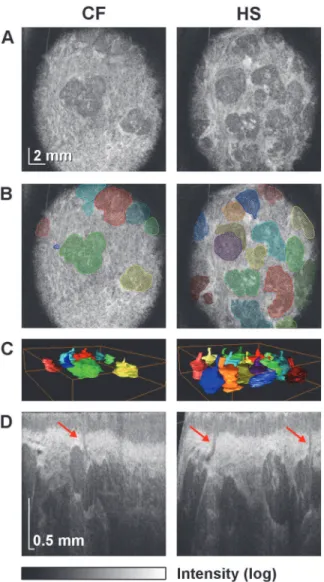
porcine lower lip (Fig. 3). The structures initially identified as LSG excretory ducts by OCT were confirmed as such by histology, validating the gland identification method used in this study. Images of patient lower lip region revealed a layered structure of the mucosa in the cross-sectional images (B-scans), where epithelium and connective tissue could be distin-guished. The glandular tissue appeared as hypointensive compared to the surrounding highly reflective muscular tissue. Such appearance of the glandular tissue in OCT is consistent with high water content in the glandular cells [23]. Three-dimensional reconstructions, projection images, and cross-sectional images of LSGs in a patient with CF and in a HS are shown in Fig. 4. These examples are representative of their respective groups. Excretory ducts and the glandular tissue are clearly discernible in OCT images due to differences in optical properties, allowing for identification of individual LSGs.
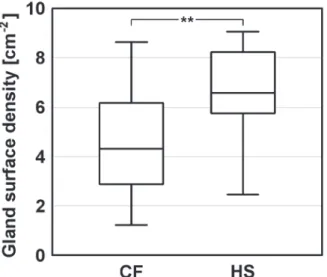
Based on quantitative and statistical analysis of OCT data (the dataset is publicly available [24]) it has been found that LSGs’surface density in CF patients was lower than in HS. The median [interquartile range] values were 4.32 glands/cm2[2.88–6.17] and 6.58 glands/cm2 [5.76–8.23], respectively. The comparison of LSGs’surface density in CF patients and HS re-vealed an effect of group (P = .006) describing the observed differences (Fig. 5).
Discussion
The pathophysiological basis for the above finding is only partially explained by the available evidence. Either a lower number of LSGs develop in patients with CF in the first place, or they are lost in course of the disease. A decreased radioreceptor assay reactivity of epidermal growth factor in the saliva of CF patients argues in favor of the former hypothesis [25]. However,
Fig 3. Cross-sectional OCT image of the mucosa of a porcine lower lip and corresponding histology images.(A) Three labial minor salivary gland excretory ducts are indicated in the OCT image (*,†,‡). (B) The excretory ducts are visible in the histology sample stained with hematoxylin and eosin (10X magnification). Images obtained with magnifications of 40X (C), 200X (D), and 400X (E) reveal typical morphological characteristics of labial minor
salivary gland excretory ducts, including the simple columnar epithelium. The ductal lumen is filled with cellular debris.
CFTR-related LSG dysfunction [26], [27] and the alterations in its ultrastructure revealed by electron microscopy studies [28] lend support to the latter explanation. Whether other excreto-ry glands of the alimentaexcreto-ry tract in patients with CF are affected in a similar manner remains to be determined. Intraluminal OCT would present many advantages in approaching this problem. Further research in the area may yield important information on causes of gastroin-testinal CF complications.
In conclusion, wide-fieldin vivoOCT imaging of the mucosa of the lower lip enabled
identi-fication of a lower LSG surface density in patients with CF, which is a previously unrecognized CF-related pathology of the alimentary tract.
Fig 4. Wide-field OCT imaging of LSGs in a patient with CF (No. 11) and in a HS (No. 30).LSGs’surface densities (4.11 and 6.58 glands/cm2) are representative of their respective groups. (A) Projection images
(C-scans) of the mucosa of the central part of the lower lip at the depth of 750μm. The intensity of signal from
the glandular tissue is lower compared to the surrounding muscular tissue. (B) The C-scans with
superimposed areas indicating individual LSGs. (C) Three-dimensional rendering of the segmented LSGs illustrates the difference in LSGs’surface density between the subjects. (D) Sample cross-sectional images (B-scans). High axial resolution allows for identification of the LSGs and their excretory ducts (indicated by arrows).
Supporting Information
S1 Video. OCT allows for three-dimensional reconstruction of the morphological features of the LSGs.
(MP4)
Acknowledgments
The authors would like to thank the volunteers for their participation in the study, Prof. Prze-myslaw Majewski, M.D., Ph.D., for histological analysis, Agata Nowicka, M.D., Ph.D., for her help with patient recruitment, and Philip Grebowiec, M.D., for editing assistance.
Author Contributions
Conceived and designed the experiments: JKN IG KK MW JW. Performed the experiments: JKN IG KK JW. Analyzed the data: JKN IG KK JW. Contributed reagents/materials/analysis tools: JKN IG KK MW JW. Wrote the paper: JKN IG KK MW JW. Study concept and design, obtained funding: JKN IG KK MW JW. Acquisition of data: JKN IG KK JW. Analysis and in-terpretation of data: JKN IG KK JW. Statistical analysis: JKN IG. Drafting of the manuscript: JKN IG. Critical revision of the manuscript: MW JW. Study supervision: MW JW.
References
1. Kerem B, Rommens JM, Buchanan JA, Markiewicz D, Cox TK, et al. (1989) Identification of the cystic fi-brosis gene: genetic analysis. Science 245: 1073–1080. PMID:2570460
2. Gelfond D, Borowitz D (2013) Gastrointestinal complications of cystic fibrosis. Clin Gastroenterol Hepa-tol 11: 333–342. doi:10.1016/j.cgh.2012.11.006PMID:23142604
3. Meskin LH, Bernard B, Warwick WJ (1964) Biopsy of labial mucous salivary glands in cystic fibrosis. JAMA 188: 82–83. PMID:14107225
4. Wiesmann UN, Boat TF, Di Sant’Agnese PA (1972) Flow-rates and electrolytes in minor-salivary-gland saliva in normal subjects and patients with cystic fibrosis. Lancet 300: 510–512.
5. Bradley PJ, Guntinas-Lichius O (2011) Salivary Gland Disorders and Diseases: Diagnosis and Man-agement. Thieme Medical Publishers.
Fig 5. Box plot of LSGs’surface density in CF patients and HS.Median values, interquartile ranges, and the minimum and maximum values are indicated. The asterisks denote statistical significance (P = .006).
6. Eliasson L, Carlén A (2010) An update on minor salivary gland secretions. Eur J Oral Sci 118: 435–442. doi:10.1111/j.1600-0722.2010.00766.xPMID:20831576
7. Huang D, Swanson EA, Lin CP, Schuman JS, Stinson WG, et al. (1991) Optical coherence tomogra-phy. Science 254: 1178–1181. PMID:1957169
8. Familiari L, Strangio G, Consolo P, Luigiano C, Bonica M, et al. (2006) Optical coherence tomography evaluation of ulcerative colitis: the patterns and the comparison with histology. Am J Gastroenterol 101: 2833–2840. PMID:17227526
9. Wojtkowski M (2010) High-speed optical coherence tomography: basics and applications. Appl Opt 49: D30–61. doi:10.1364/AO.49.000D30PMID:20517358
10. Liu L, Shastry S, Byan-Parker S, Houser G, K Chu K, et al. (2014) An autoregulatory mechanism gov-erning mucociliary transport is sensitive to mucus load. Am J Respir Cell Mol Biol 51: 485–493. doi:10. 1165/rcmb.2013-0499MAPMID:24937762
11. Birket SE, Chu KK, Liu L, Houser GH, Diephuis BJ, et al. (2014) A functional anatomic defect of the cys-tic fibrosis airway. Am J Respir Crit Care Med 190: 421–432. doi:10.1164/rccm.201404-0670OC PMID:25029666
12. Adler DC, Chen Y, Huber R, Schmitt J, Connoly J, Fujimoto JG (2007) Three-dimensional endomicro-scopy using optical coherence tomography. Nat Photonics 1: 709–716.
13. Farrell PM, Rosenstein BJ, White TB, Accurso FJ, Castellani C, et al. (2008) Guidelines for diagnosis of cystic fibrosis in newborns through older adults: Cystic Fibrosis Foundation consensus report. J Pediatr 153: S4–S14. doi:10.1016/j.jpeds.2008.05.005PMID:18639722
14. Walkowiak J (2004) Assessment of maldigestion in cystic fibrosis. J Pediatr 145: 285–287. PMID: 15343173
15. Walkowiak J, Lisowska A, Przyslawski J, Grzymislawski M, Krawczynski M, et al. (2004) Faecal elas-tase-1 test is superior to faecal lipase test in the assessment of exocrine pancreatic function in cystic fi-brosis. Acta Paediatr 2004; 93: 1042–1045. PMID:15456193
16. Van de Kamer JH, Huinink HTB, Weyers HA (1949) Rapid method for determination of fat in feces. J Biol Chem 177: 349–355.
17. Grulkowski I, Nowak JK, Karnowski K, Zebryk P, Puszczewicz M, et al. (2013) Quantitative assessment of oral mucosa and labial minor salivary glands in patients with Sjögren’s syndrome using swept source OCT. Biomed Opt Express 5: 259–274. doi:10.1364/BOE.5.000259PMID:24466492
18. American National Standard for Safe Use of Lasers (2007) Laser Institute of America. ANSI Z136.1–2007.
19. Schindelin J, Arganda-Carreras I, Frise E, Kaynig V, Longair M, et al. (2012) Fiji: an open-source plat-form for biological-image analysis. Nat Methods 9: 676–682. doi:10.1038/nmeth.2019PMID: 22743772
20. Bouma BE, Tearney GJ, Compton CC, Nishioka NS (2000) High-resolution imaging of the human esophagus and stomach in vivo using optical coherence tomography. Gastrointest Endosc 51: 467–474. PMID:10744824
21. Adler DC, Zhou C, Tsai TH, Schmitt J, Huang Q, et al. (2009) Three-dimensional endomicroscopy of the human colon using optical coherence tomography. Opt Express 17: 784–796. PMID:19158891
22. Zhou C, Tsai TH, Lee HC, Kirtane T, Figueiredo M, et al. (2012) Characterization of buried glands be-fore and after radiofrequency ablation by using 3-dimensional optical coherence tomography (with vid-eos). Gastrointest Endosc 76: 32–40. doi:10.1016/j.gie.2012.02.003PMID:22482920
23. Hand AR, Pathmanathan D, Field RB (1999) Morphological features of the minor salivary glands. Arch Oral Biol May 44 Suppl 1: S3–10.
24. Nowak JK, Grulkowski I, Karnowski K, Wojtkowski M, Walkowiak J (2014) Replication Data for: Optical coherence tomography identifies lower labial salivary gland surface density in cystic fibrosis. Zenodo; doi:10.5281/zenodo.13257.
25. Aubert B, Cochet C, Souvignet C, Chambaz EM (1990) Saliva from cystic fibrosis patients contains an unusual form of epidermal growth factor. Biochem Biophys Res Commun 170: 1144–1150. PMID: 2390081
26. Aps JK, Delanghe J, Martens LC (2002) Salivary electrolyte concentrations are associated with cystic fibrosis transmembrane regulator genotypes. Clin Chem Lab Med; 40: 345–350. PMID:12059073
27. Park S, Shcheynikov N, Hong JH, Zheng C, Suh SH, et al. (2013) Irbit mediates synergy between ca(2-+) and cAMP signaling pathways during epithelial transport in mice. Gastroenterology 145: 232–241. doi:10.1053/j.gastro.2013.03.047PMID:23542070