Optical coherence tomography angiography findings in
malignant hypertensive retinopathy
Achados da angiografia por tomografia de coerência óptica na
retinopatia hipertensiva maligna
Berna Dogan1, Melih Akıdan1, Muhammet Kazım Erol1, Deniz Turgut Coban1, Elcin Suren1 1. Department of Ophthalmology, Antalya Education and Research Hospital, Antalya, Turkey.
Submitted for publication: March 7, 2018 Accepted for publication: July 24, 2018
Funding: No specific financial support was available for this study.
Disclosure of potential conflicts of interest: None of the authors have any potential conflicts of interest to disclose.
Corresponding author: Melih Akıdan
Antalya Education and Research Hospital. Department of Ophthalmology - 07050 - Antalya - Turkey - E-mail: [email protected]
ABSTRACT | A 33-year-old male presented to our clinic with low vision in both eyes that started during the previous week. Visual acuity was 20/63 in the right eye and 20/50 in the left eye. Fundus examination revealed signs of hypertensive retinopathy; thus, a multidisciplinary approach was adopted for the diagnosis and treatment of this patient. We consulted the nephrology and cardiology departments on this case. Upon diagnosing malignant hypertension and renal failure, the patient was put on hemodialysis. His visual acuity was 20/20 at 6 months, whereas foveal assessment on optical coherence tomography angiography revealed neither marked superficial and deep capillary density loss and foveal avascular zone enlargement nor a decrease in disc flow and radial peripapillary capillary density. Early diagnosis and treatment of malignant hypertension are critical in preventing progression of end-organ damage including the eyes. Optical coherence tomography angiography may be useful in cases when fundus fluorescein angiography is relatively contraindicated (e.g., renal failure).
Keywords: Malignant hypertension; Tomography, optical cohe-rence; Fluorescein angiography; Hypertensive retinopathy
RESUMO | Um homem de 33 anos apresentou-se à nossa clínica com baixa visão em ambos os olhos que começou uma semana antes. A acuidade visual foi de 20/63 no olho direito e 20/50 no olho esquerdo. O exame de fundo de olho revelou sinais de retinopatia hipertensiva; então, adotou-se uma abordagem multidisciplinar para o diagnóstico e tratamento desse paciente. Consultamos os departamentos de nefrologia e cardiologia neste caso. Ao diagnosticar hipertensão maligna e insuficiência renal, o paciente foi colocado em hemodiálise. Sua acuidade visual era
20/20 aos 6 meses, enquanto a avaliação foveal com angiotomo-grafia de coerência óptica não revelou perda de densidade capilar superficial e profunda acentuada e aumento da zona avascular foveal nem uma diminuição no fluxo de disco e na densidade capilar peripapilar radial. O diagnóstico precoce e o tratamento da hipertensão maligna são fundamentais na preveção da progressão de danos nos órgãos-alvo, incluindo os olhos. A Angiografia por tomografia de coerência óptica pode ser útil nos casos em que a angiografia com fluoresceína do fundo de olho é relativamente contraindicada (por exemplo, insuficiência renal).
Descritores: Hipertensão maligna; Tomografia de coerência óptica; Angiofluoresceínografia; Retinopatia hipertensiva
INTRODUCTION
Malignant hypertension (MHT) is the most seve-re form of hypertensive seve-retinopathy with seve-regard to end-organ damage, whereas optical neuropathy is usua-lly concomitant with choroidopathy and maculopathy(1).
Changes in retinal pigment epithelium (RPE), such as Elschnig spots and Siegrist streaks as well as pigment epithelial detachment and subretinal fluid (SRF), may develop because of choriocapillaris necrosis. In MHT, both the visual prognosis and end-organ damage in the brain, heart, and kidneys are closely related to blood pressure and elapsed time. Therefore, early diagnosis and a multidisciplinary approach are essential.
Optical coherence tomography angiography (OCTA, Optovue, Inc., Fremont, CA, USA) is an imaging method for the in-depth evaluation of retinal and choroidal ves-sels and may be useful in cases when fundus fluorescein angiography (FFA) is relatively contraindicated (e.g., renal failure).
CASE REPORT
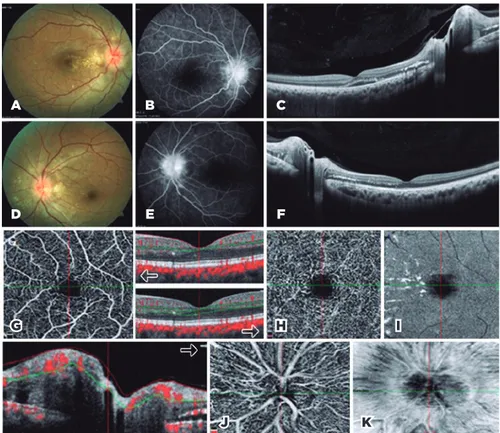
A 33-year-old male presented to our clinic with low vision in both eyes that had started during the previous week. Visual acuity was 20/63 in the right eye and 20/50 in the left eye. Intraocular pressure was 13 mmHg in both eyes, and examination of the anterior segment was normal. Fundus examination showed bilateral optic disc edema, star-like hard exudates around the optic disc and fovea, arteriovenous changes, and a few flame-shaped hemorrhages (Figure 1 A, D). In addition, RPE changes in cluding Elschnig spots were visible outside the arcuate. FFA revealed bilateral optic disc hyperfluorescence in-creasing in the late phase and hypofluorescence in the zones we thought to be Elschnig spots (Figure 1B, E). Macular thickness measurements using SD-OCT revea-led increased thickness. Increased reflectivity and SRF were seen on the nasal side of the macula because of the hard exudates (Figure 1 C, F). Measurements of
subfo-veal choroidal thickness measurements were performed using enhanced depth imaging optical coherence to-mography (EDI-OCT). Retinal nerve fiber layer (RNFL) measurements revealed an increase in each quadrant in favor of optical disc edema (Table 1). OCTA macula was used to evaluate superficial, deep capillary density and en face images (Figure 1 G, H, I). OCTA disc was used to evaluate the nerve head, radial peripapillary capillary density, and en face images (Figure 1 J, K). Vascular flow was assessed in both the macular and disc regions (Tables 1 and 2).
Blood tests revealed a creatinine level of 6 mg/dL and blood urea nitrogen (BUN) level of 65 mg/dL. Serology results were negative. Cardiologic evaluation revealed that his systolic blood pressure was 260 mmHg, and diastolic blood pressure was 140 mmHg. Neurological evaluation was normal. Following the nephrology consul-tation, the patient was diagnosed with MHT and chronic renal failure and thus put on dialysis.
Figure 1. On the first day. A) Fundus image of the right eye; optic disc edema and star-like exu-dation. B) FFA image of the right eye; hyperfluorescence in the optic disc. C) EDI-OCT image of the right eye; SRF and hyper-reflectivity due to hard exudates in the nasal area. D) Fundus image of the left eye; optic disc edema and star-like exudation. E) FFA image of the left eye; hyperfluo-rescence in the optic disc. F) EDI-OCT image of the left eye; no marked SRF, hyper-reflectivity in the nasal area due to exudates. G) OCTA image of the superficial capillary plexus in the left eye (right arrow, B-scan image). H) OCTA image of the deep capillary plexus in the left eye (left arrow, B-scan image). I) En face OCTA image of the deep capillary plexus in the left eye. J) OCTA image of a radial peripapillary capillary cross-section in the left eye (left arrow, B-scan image). K) En face OCTA image of the radial peripapillary capillary in the left eye.
A
D
G
B
E
H
J K
C
F
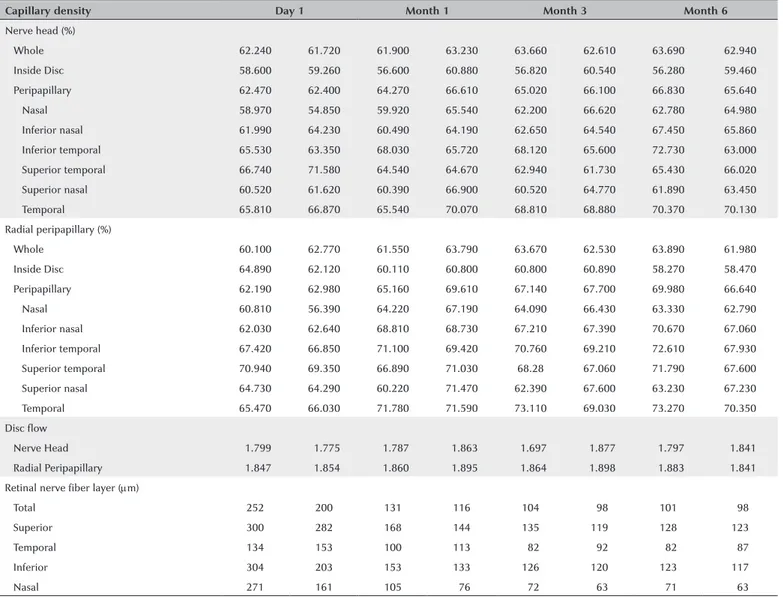
Table 1. OCT and OCTA optic disc findings in malignant hypertensive retinopathy on the first day and the first 3 and 6 months
Capillary density Day 1 Month 1 Month 3 Month 6
Nerve head (%)
Whole 62.240 61.720 61.900 63.230 63.660 62.610 63.690 62.940
Inside Disc 58.600 59.260 56.600 60.880 56.820 60.540 56.280 59.460
Peripapillary 62.470 62.400 64.270 66.610 65.020 66.100 66.830 65.640
Nasal 58.970 54.850 59.920 65.540 62.200 66.620 62.780 64.980
Inferior nasal 61.990 64.230 60.490 64.190 62.650 64.540 67.450 65.860
Inferior temporal 65.530 63.350 68.030 65.720 68.120 65.600 72.730 63.000
Superior temporal 66.740 71.580 64.540 64.670 62.940 61.730 65.430 66.020
Superior nasal 60.520 61.620 60.390 66.900 60.520 64.770 61.890 63.450
Temporal 65.810 66.870 65.540 70.070 68.810 68.880 70.370 70.130
Radial peripapillary (%)
Whole 60.100 62.770 61.550 63.790 63.670 62.530 63.890 61.980
Inside Disc 64.890 62.120 60.110 60.800 60.800 60.890 58.270 58.470
Peripapillary 62.190 62.980 65.160 69.610 67.140 67.700 69.980 66.640
Nasal 60.810 56.390 64.220 67.190 64.090 66.430 63.330 62.790
Inferior nasal 62.030 62.640 68.810 68.730 67.210 67.390 70.670 67.060
Inferior temporal 67.420 66.850 71.100 69.420 70.760 69.210 72.610 67.930
Superior temporal 70.940 69.350 66.890 71.030 68.28 67.060 71.790 67.600
Superior nasal 64.730 64.290 60.220 71.470 62.390 67.600 63.230 67.230
Temporal 65.470 66.030 71.780 71.590 73.110 69.030 73.270 70.350
Disc flow
Nerve Head 01.799 01.775 01.787 01.863 01.697 01.877 01.797 01.841
Radial Peripapillary 01.847 01.854 01.860 01.895 01.864 01.898 01.883 01.841
Retinal nerve fiber layer (µm)
Total 252 200 131 116 104 098 101 098
Superior 300 282 168 144 135 119 128 123
Temporal 134 153 100 113 082 092 082 087
Inferior 304 203 153 133 126 120 123 117
Nasal 271 161 105 076 072 063 071 063
Cells are divided into two columns to show the results of the right and left eyes separately.
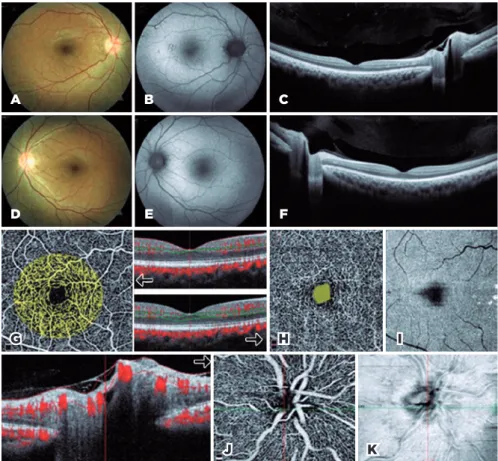
At 6-month follow-up, bilateral visual acuity was 20/20. Fundus autofluorescence imaging revealed regression in the signs of MHT (Figure 2 A, B, D, E), and FFA was not performed on the advice of the nephrology department. SD-OCT macular thickness measurements revealed thinning and total resolution of SRF (Figure 2 C, F). RNFL measurements showed regression of optical disc edema in all quadrants (Table 1). Subfoveal choroidal thickness in the right eye was 337 µm on the first day and 328 µm at 6 months and in the left eye was 402 µm on the first day and 343 µm at 6 months.
OCTA macula and disc were used to evaluate flow, fo-veal avascular zone (FAZ), density, and en face images at 6 months (Figure 2G, H, I). OCTA macula measurements did not show capillary density loss. OCTA foveal flow measurements were increased in all segments except
the outer segment (Table 2). No enlargement was found either in the superficial or deep FAZ. OCTA disc mea-surements did not show a marked nerve head or loss of radial peripapillary capillary density (Figure 2 J, K). Flow measurements revealed increased choroidal flow and no perfusion loss in the other segments (Table 1).
At 6-month follow-up, a systemic assessment of the patient revealed that blood pressure was normal, crea-tinine was 3.2 mg/dL, and BUN was 38 mg/dL. Renal transplantation was performed at an external center.
DISCUSSION
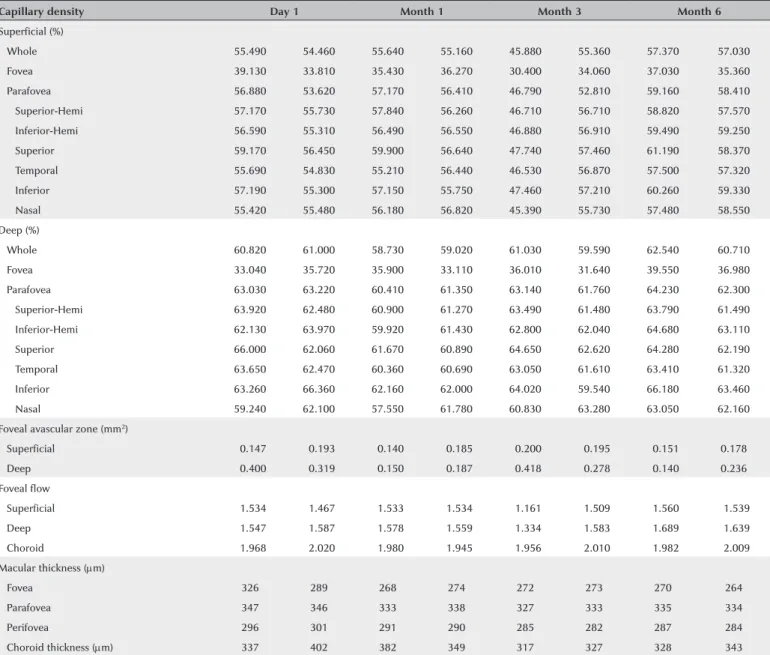
Table 2. OCT and OCTA-macular findings in malignant hypertensive retinopathy on the first day and the first 3 and 6 months
Capillary density Day 1 Month 1 Month 3 Month 6
Superficial (%)
Whole 55.490 54.460 55.640 55.160 45.880 55.360 57.370 57.030
Fovea 39.130 33.810 35.430 36.270 30.400 34.060 37.030 35.360
Parafovea 56.880 53.620 57.170 56.410 46.790 52.810 59.160 58.410
Superior-Hemi 57.170 55.730 57.840 56.260 46.710 56.710 58.820 57.570
Inferior-Hemi 56.590 55.310 56.490 56.550 46.880 56.910 59.490 59.250
Superior 59.170 56.450 59.900 56.640 47.740 57.460 61.190 58.370
Temporal 55.690 54.830 55.210 56.440 46.530 56.870 57.500 57.320
Inferior 57.190 55.300 57.150 55.750 47.460 57.210 60.260 59.330
Nasal 55.420 55.480 56.180 56.820 45.390 55.730 57.480 58.550
Deep (%)
Whole 60.820 61.000 58.730 59.020 61.030 59.590 62.540 60.710
Fovea 33.040 35.720 35.900 33.110 36.010 31.640 39.550 36.980
Parafovea 63.030 63.220 60.410 61.350 63.140 61.760 64.230 62.300
Superior-Hemi 63.920 62.480 60.900 61.270 63.490 61.480 63.790 61.490
Inferior-Hemi 62.130 63.970 59.920 61.430 62.800 62.040 64.680 63.110
Superior 66.000 62.060 61.670 60.890 64.650 62.620 64.280 62.190
Temporal 63.650 62.470 60.360 60.690 63.050 61.610 63.410 61.320
Inferior 63.260 66.360 62.160 62.000 64.020 59.540 66.180 63.460
Nasal 59.240 62.100 57.550 61.780 60.830 63.280 63.050 62.160
Foveal avascular zone (mm2)
Superficial 00.147 00.193 00.140 00.185 00.200 00.195 00.151 0.178
Deep 00.400 00.319 00.150 00.187 00.418 00.278 00.140 0.236
Foveal flow
Superficial 01.534 01.467 01.533 01.534 01.161 01.509 01.560 01.539
Deep 01.547 01.587 01.578 01.559 01.334 01.583 01.689 01.639
Choroid 01.968 02.020 01.980 01.945 01.956 02.010 01.982 02.009
Macular thickness (µm)
Fovea 326 289 268 274 272 273 270 264
Parafovea 347 346 333 338 327 333 335 334
Perifovea 296 301 291 290 285 282 287 284
Choroid thickness (µm) 337 402 382 349 317 327 328 343
Cells are divided into two columns to show the results of the right and left eyes separately.
to other organs. In their study, Ahn et al., used fundos-copy and OCT in combination and reported that visual prognosis was correlated with SRF level rather than fun-doscopic images in patients with severe hypertension, and blood pressure control also resulted in regression of retinal and choroidal thickness(2).
Manjunath et al. found that choroidal thickness in healthy individuals measured 272 ± 81 µm, and Os-manbasoglu et al. obtained measurements of 308.7 ± 64.5 µm(3,4). In our case, subfoveal choroidal thickness
in the right eye measured 337 µm on the first day and 328 µm at 6 months and in the left eye 402 µm on the first day and 343 µm at 6 months. Following the
impro-vement in blood pressure and decrease in choroidal per meability, we observed a fast regression in SRF and reduced retinal and choroidal thickness.
Figure 2. At 6 months. A) Fundus image of the right eye; total resolution of optic disc edema and minimal exudation. B) Autofluorescence of the right eye; defective hyperautofluorescence secondary to choroidopathy. C) EDI-OCT image of the right eye; hyper-reflectivity in the nasal area due to minimal hard exudation. D) Fundus image of the left eye; total resolution of optic disc edema and exudation. E) Autofluorescence in the left eye. F) EDI-OCT image of the left eye; total resolution of hyper-reflectivity. G) OCTA flow area image of the superficial capillary plexus in the right eye (right arrow, B-scan image). H) OCTA image of the foveal avascular zone of the deep plexus in the right eye (left arrow, B-scan image). I) En face OCTA image of the deep plexus. J) OCTA image of the optical nerve head in the right eye (left arrow, B-scan image). K) En face OCTA image of the optical nerve head.
A B C
F E
D
G H
J K
I Ghassemi et al. reported that superficial FAZ
measu-red 0.22 ± 0.08 mm2 and deep FAZ was 0.31 ± 0.11 mm2
in normal eyes in their study(6). In our case, superficial
FAZ was 0.147 mm2 on the first day and 0.151 mm2 at
6 months in the right eye, and it was 0.193 mm2 on the
first day and 0.178 mm2 at 6 months in the left eye. Deep
FAZ measured 0.400 mm2 on the first day and 0.140 mm2
at 6 months in the right eye, and it was 0.319 mm2 on
the first day and 0.236 mm2 at 6 months in the left eye.
No significant superficial and deep phase enlargement was observed after 6 months of follow-up.
Coscas et al. evaluated macular density and flow in healthy subjects using 3 × 3 mm OCTA examinations. Their findings included superficial layer-whole 53.91 ± 2.09 and deep layer-whole 59.36 ± 1.74(7). In our case,
capillary density loss was not significant at the end of the sixth month, and there was no decrease in OCTA
disc density and flow measurements at the end of the sixth month.
Rotsos et al. assessed choroidal blood flow at Elschnig points with OCTA and reported the results at 1 month(8).
Similarly, Saito et al. compared focal choroidal ischemic areas and reperfusion in hypertensive choroidopathy following treatment with en face OCTA images(9). Both
studies did not assess capillary density, FAZ, or flow. Grossi et al. compared OCTA results between the arterial hypertensive and normotensive group. Patients in the normotensive group had thicker choroids, whereas no vascular density differences were found(10). They
em-phasized that OCTA was potentially useful for detecting early pathological damage and assessing progression.
study will contribute to our current knowledge regarding MHT with OCTA results such as angiodisc and capillary density. Further studies on using OCTA more effectively for the diagnosis, staging, treatment, and prognosis of hypertensive retinopathy are needed.
REFERENCES
1. Stryjewski TP, Papakostas TD, Eliott D. Multimodal imaging of elschnig spots: a case of simultaneous hypertensive retinopathy, choroido-pathy, and neuropathy. Semin Ophthalmol. 2017;32(4):397-9. 2. Ahn SJ, Woo SJ, Park KH. Retinal and choroidal changes with severe
hypertension and their association with visual outcome. Invest Ophthalmol Vis Sci. 2014;55(12):7775-85.
3. Manjunath V, Taha M, Fujimoto JG, Duker JS. Choroidal thickness in normal eyes measured using cirrus-hd optical coherence tomogra-phy. Am J Ophthalmol. 2010;150(3):325-9.
4. Osmanbasoglu OA, Alkın Z, Ozkaya A, Ozpınar Y, Yazıcı AT, Demirok
A. Diurnal choroidal thickness changes in normal eyes of turkish people measured by spectral domain optical coherence tomography. J Ophthalmol. 2013;2013:687165.
5. Falavarjani KG, Al-Sheikh M, Darvizeh F, Sadun AA, Sadda SR. Retinal
vessel calibre measurements by optical coherence tomography angiography. Br J Ophthalmol. 2017;101(7):989-92.
6. Ghassemi F, Mirshahi R, Bazvand F, Fadakar K, Faghihi H, Sabour S. The quantitative measurements of foveal avascular zone using optical coherence tomography angiography in normal volunteers. J Curr Ophthalmol. 2017;29(4):293-9.
7. Coscas F, Sellam A, Glacet-Bernard A, Jung C, Goudot M, Mierre A, et al. Normative data for vascular density in superficial and deep capillary plexus of healty adults assessed by optical coherence tomo-graphy angiotomo-graphy. Invest Ophthalmol Vis Sci. 2016;57(9):211-23. Comment in: Invest Ophthalmol Vis Sci. 2016;57(15):6713. 8. Rotsos T, Andreanos K, Blounas S, Brouzas D, Ladas DS, Ladas
ID. Multimodal imaging of hypertensive chorioretinopathy by swept-source optical coherence tomography and optical coherence tomography angiography. Medicine. 2017;96(39):e8110.
9. Saito M, Ishibazawa A, Kinouchi R, Yoshida A. Reperfusion of
the choriocapillaris observed using optical coherens tomography angiography in hypertensive choroidopathy. Int Ophthalmol. 2017 Sep 11, doi: 10.1007/s10792-017-0705-1.