A Network View on Psychiatric Disorders:
Network Clusters of Symptoms as
Elementary Syndromes of
Psychopathology
Rutger Goekoop1,2*, Jaap G. Goekoop3
1. Department of Mood Disorders, PsyQ Psychomedical Programs, The Hague, The Netherlands, 2. Parnassia Group, The Hague, The Netherlands, 3. Department of Psychiatry, Leiden University Medical Center, Leiden University, Leiden, The Netherlands
Abstract
Introduction: The vast number of psychopathological syndromes that can be
observed in clinical practice can be described in terms of a limited number of elementary syndromes that are differentially expressed. Previous attempts to identify elementary syndromes have shown limitations that have slowed progress in the taxonomy of psychiatric disorders.
Aim: To examine the ability of network community detection (NCD) to identify
elementary syndromes of psychopathology and move beyond the limitations of current classification methods in psychiatry.
Methods:192 patients with unselected mental disorders were tested on the
Comprehensive Psychopathological Rating Scale (CPRS). Principal component analysis (PCA) was performed on the bootstrapped correlation matrix of symptom scores to extract the principal component structure (PCS). An undirected and weighted network graph was constructed from the same matrix. Network
community structure (NCS) was optimized using a previously published technique.
Results: In the optimal network structure, network clusters showed a 89% match
with principal components of psychopathology. Some 6 network clusters were found, including "DEPRESSION", "MANIA", ‘‘ANXIETY’’, "PSYCHOSIS", "RETARDATION", and "BEHAVIORAL DISORGANIZATION". Network metrics were used to quantify the continuities between the elementary syndromes.
Conclusion:We present the first comprehensive network graph of
psychopathology that is free from the biases of previous classifications: a ‘Psychopathology Web’. Clusters within this network represent elementary syndromes that are connected via a limited number of bridge symptoms. Many
OPEN ACCESS
Citation:Goekoop R, Goekoop JG (2014) A Network View on Psychiatric Disorders: Network Clusters of Symptoms as Elementary Syndromes of Psychopathology. PLoS ONE 9(11): e112734. doi:10.1371/journal.pone.0112734
Editor:Sven Vanneste, University of Texas at Dallas, United States of America
Received:June 7, 2014
Accepted:October 14, 2014
Published:November 26, 2014
Copyright:ß2014 Goekoop, Goekoop. This is an
open-access article distributed under the terms of theCreative Commons Attribution License, which permits unrestricted use, distribution, and reproduction in any medium, provided the original author and source are credited.
Data Availability:The authors confirm that all data underlying the findings are fully available without restriction. All relevant data are within the paper and its Supporting Information files.
Funding:RG received funding of Parnassia Academy (http://www.parnassia-academie.nl/) that allowed him to devote some of his time (0.2fte) to doing research instead of providing healthcare as a clinical psychiatrist. The funders had no role in study design, data collection and analysis, decision to publish, or preparation of the manuscript.
problems of previous classifications can be overcome by using a network approach to psychopathology.
Introduction
The term ‘‘psychopathology’’ is reserved for a type of illness that involves an acute disturbance of mental functions, leading to a significant decline in (inter)personal functioning with respect to a previously attained level of functioning. If
recognized and treated well, this type of illness is usually temporary (a ‘dip’). In contrast, ‘personality pathology’ refers to a type of illness that involves a failure to develop habits and mental traits that are required for an adequate regulation of these mental functions in the course of life. Personality pathology therefore involves long-term disabilities in (inter)personal functioning that generally began development in early childhood or puberty. The focus of the current paper is on psychopathology. More specifically, it centers on psychopathology as it occurs at a single moment in time in a heterogeneous sample of patients (a cross-sectional analysis). The temporal evolution or outcome of psychopathology is not the focus of the current paper. Below, we will provide a short overview of previous descriptions of psychopathology with their respective merits and weaknesses. After that, we will provide a redefinition of psychopathology in terms of the mutual relationships between individual symptoms of psychopathology as represented in a network graph.
A short history of psychopathology
The major syndromes of mental illness have successively been described in three global ways. The first definition is associated with the names of the German physicians Ernst Albrecht Von Zeller and Edward Griesinger (1871), who conceived the whole of psychopathology as different manifestations of a single disorder called ‘‘Einheitspsychosis’’ (usually translated as ‘‘Unity Psychosis’’). This was a time in which the soul was considered to be an undividable whole, hence different afflictions of the soul could only be due to a single underlying disorder and ‘brain disease’ [1]. To explain the heterogeneity of clinical pictures that could nonetheless be observed (the ‘‘phenotypes’’), Griesinger assumed that these were due to variations in the intensity of the Einheitspsychosis. Thus, he posited a one-dimensional model of psychopathology in which depression (with anxiety and psychomotor retardation) reflected low-intensity Einheitspsychosis, mania with delusions and rage involved intermediate-intensity levels, and ‘madness’ (with disorganization) and various forms of dementia represented high-intensity levels of Einheitspsychosis [1]. The second global concept of psychopathology is a response to this one-dimensional view of psychopathology and is associated with the German psychiatrist Emil Kraepelin (1892). Kraepelin noted that
‘dementia praecox’ (nowadays called schizophrenia) could well appear at once, without necessarily being preceded by lower-intensity syndromes such as depression. Hence, a single-parameter view of psychopathology seemed to fall short of an adequate description of psychopathology. Instead, Kraepelin assumed the existence of multiple disease entities [2]. Each of these ‘‘natural disease entities’’ was marked by its own distinct etiology and corresponding neuro-pathology, which worked its way towards a unique phenotypical expression of illness, which was characterized by its own long-term course and outcome [3]. With this division of the soul into several parts came all the potential complexities of a systems science, since the various neuropathologies and etiologies allowed for a large number of possible interactions. At the time, scientists were not ready for such a view. Indeed, Kraepelin himself must have felt some initial perplexity when referring to the ‘‘confusing swarm’’ of psychotic patients that constituted ‘‘the Labyrinth of Psychiatry’’ [3]. Perhaps as an attempt to reduce complexity, Kraepelin assumed strict demarcations between the various etiologies, neuro-biological pathologies and phenotypes. Although he later recognized that certain neurobiological changes and personality traits could produce considerable phenotypical overlap, the original Kraepelinian view on psychopathology is one that precludes relationships between psychiatric disorders [3]. This idea of mental disorders as distinct phenotypical expressions has formed the basis of the third Diagnostic and Statistical Manual of Mental Disorders (DSM-III) of the American Psychiatric Association published in 1980 [4]. Since then, new diagnostic categories have been added to provide a more comprehensive description of the plethora of psychiatric disorders that have been discerned in clinical practice. The DSM of today (which has recently seen its 5th update) contains over 300 disease categories, which are still based on the original Kraepelinian view of categories as phenotypically separable mental disorders (e.g. ‘schizophrenia’).
Limitations of the categorical approach
The ‘categorical view’ has been subjected to serious forms of critique in the past [5–8]. Much of this critique has focused on the untenability of strict demarcations between the disease categories. Previous studies of the co-occurrence of symptoms found no evidence for the proposed categories. The strict phenotypical
continuous view of psychopathology were met with serious resistance, since the absence of strict boundaries between syndromes was thought to make articulated clinical decisions next to impossible [9]. Clinical practice requires
well-operationalized diagnostic demarcations as a basis for therapeutic interventions, since such decisions influence important aspects of human lives. Many experts therefore feared that diagnostic systems that assumed continuities between syndromes would render clinical interventions unfocused and powerless. Unfortunately, the possibility of defining well-operationalized demarcations for clinical interventions in a real continuum was not considered. Secondly, the publication of the DSM-III in 1980 was the first attempt at defining standardized diagnostic criteria for mental disorders worldwide. As such, it answered a strong need for diagnostic reliability, even if this went at the cost of validity [10]). Attempts to formulate alternative disease descriptions with a better construct validity were answered by a fear of returning to the chaos of the pre-DSM-III area, in which each school of psychiatry formulated its own diagnostic criteria. Even recently, experts have warned of ‘‘pushing psychiatry into chaos’’ if one were to let go of the grip furnished by the diagnostic categories of the DSM [11]. Such conservative forces have acted as a considerable force of resistance to nosological improvements in the past decades. Meanwhile, the categorical system became so deeply entrenched in government policy and clinical practice that attempts to change it have stranded because of a lack of adaptability. Despite such
developments, the past decade has seen a growing consensus amongst mental health care experts that the categorical system overshoots its primary function as a diagnostic tool because of its coarse delineations and lack of validity [12]. However, no consensus yet exists with respect to the adoption of a more suitable view of the structure of mental illness. This seems to be due to limitations of the previous alternatives, which will be shortly discussed below.
Principal Component Analysis
Historically, studies of human disease have involved studies of collections of symptoms that have a tendency to co-occur. The term ‘‘syndrome’’ has been reserved for such collections of symptoms (from Greek ‘‘syn’’ meaning
‘‘together’’, and ‘‘dromos’’ meaning ‘‘course’’). Since the 1950s, researchers have used statistical tests to examine the degree to which symptoms of psychopathology actually co-occur to form syndromes. Most of these studies have used principal component analysis (PCA), in which large numbers of symptoms are grouped together based on their tendency to covary within large numbers of individuals [13]. Thus, collections of significantly covarying symptoms are identified (e.g. low mood, concentration difficulties, excessive worrying), which are called ‘principal components’ or ‘dimensions’ (e.g. ‘Depression’). The total number of
single component score, which is usually calculated by summing the scores on all the symptoms that constitute the component. By expressing the whole of symptom activity within a particular patient as a series of component scores (a ‘multidimensional profile’), complex mental states can be given highly compact descriptions with a minimal loss of information. Each component in a
multidimensional profile contributes partly to the overall picture of the clinical syndrome [14]. When a component structure is obtained from a dataset derived from an unselected and heterogeneous sample of patients, these components apply to all patients of that population. Hence, they can be considered ‘universal’ components of psychopathology. Like primary colors on a painter’s palette, component scores can be mixed to paint the full landscape of psychopathology in all its subtle gradations. Thus, universal principal components can be viewed as ‘elementary’ syndromes of psychopathology. This approach allows a description of psychopathology that is highly parsimonious and based on empirical
measurements. By principle, it avoids the selection bias inherent to diagnostic categories and does not involve rigid cutoffs, exactly meeting the main criticisms of DSM categories. This ‘multidimensional’ view of psychopathology is a third way of describing mental disorders, which has been proposed by the psychiatrist and philosopher Karl Jaspers as far back as 1913 [15].
Principal components of psychopathology: a weak reception
To date, most of the experience with PCA has been gained in the field of personality psychology. Several elementary personality traits have been identified that allow compact descriptions of the complex personalities of individual subjects. The multidimensional view of human personality has greatly improved the validity, reliability, and descriptive power of personality rating scales [16,17]. The success of multidimensional ratings of personality has resulted in a
producing the same heterogeneity of mental disorders as provided by the DSM itself. Because of their limited scope, such components did not reach the status of elementary syndromes of psychopathology that are common to all patients with psychopathology (the purpose of such dimensions has primarily been to assess symptom severity within DSM categories). Additionally, previous component structures of psychopathology differ from each other because of methodological differences, the selection of different patient groups and the use of different rating scales to measure psychopathology. Many of these scales did not cover some of the most clinically relevant symptoms, such as post-traumatic symptoms or
symptoms of disorganization. Studies that do report the component structure of a comprehensive part of psychopathology in unselected samples of patients are rare [14,19]. This can partly be explained by the fact that clinicians often fear that a broad profiling of disease phenotypes will overburden either their patients or their staff. As a result of the above, an incomplete picture of the elementary syndromes of psychopathology has emerged, which failed to convince clinicians of its potential usefulness.
Limitations of principal component analysis
model of latent variables that explain the covariance observed between (sets of) symptoms, PCA does not [13]. Instead, PCA identifies aggregates of variables that explain most of the variance in the individual variables themselves, without the use of any model. Since almost all multidimensional studies of human personality and psychopathology have used PCA, the objection to the use of latent variables is of less concern in these fields. To summarize, the multidimensional view of psychopathology has been weakly received as an alternative to the categorical view on psychopathology due to conceptual errors and a fundamental inability of PCA to provide an accurate description of the relationships between individual symptoms and syndromes. Hence, it seems worthwhile to examine whether techniques other than PCA can provide a more complete picture of the general structure of psychopathology.
Network theory and psychiatry
In the past decade, advances in physics and the computer sciences have led to the development of new and powerful tools that enable studies of datasets with very large numbers of variables. Modern network science allows an explicit study of the billions of relationships that may exist between millions of variables in a single network model [27]. In such networks, nodes represent variables (e.g. molecules, organelles, cells, neural systems, symptoms, individual people) and links between the nodes represent their mutual connections (e.g. bonds, ties, correlations). Concepts from network theory are currently pervading different fields of
biological science from genetics to sociology and the neurosciences [28,29]. This has led to a transformation of the way in which we think about biological systems. One of the most important findings from such studies is that biological systems are characterized by a so called ‘‘Small World’’ network topology (e.g. an average of only 6 degrees of separation lie between any two persons in this world, hence the term ‘‘Small World’’ [30]). Connections in such networks are unevenly distributed across the nodes. Most nodes have few connections to other nodes, but some nodes have many. Such richly connected nodes are called ‘hubs’. Because of the existence of hubs, information may travel fast from one part of the network to the other, across a highway of interconnected hubs. Hubs interconnect large numbers of nodes and thus contract certain parts of the network into
Recently, the science of networks has been applied to psychiatry [32–34]. Network graphs have been generated of the relationships between symptom scores (e.g. correlations) and these relationships have been transformed into network graphs. In such ‘Psychopathology Webs’, psychiatric symptoms turn out to be vastly interconnected. Individual symptoms have disparate roles in maintaining both local and global connectivity. In psychopathology networks, network clusters (syndromes) can be observed that represent collections of densely interacting symptoms. Symptom clusters are interconnected by individual symptoms (‘bridge symptoms’) that form the boundaries between the various basic syndromes of psychiatric disorders. It turns out that such boundaries are neither discrete nor diffuse [34]. Instead, a limited number of bridge symptoms appears to be responsible for most communication between the basic syndromes (network clusters) [35]. These bridge symptoms may be important in describing the continuities between the syndromes and explaining comorbidity rates. Network analysis methods allow for a detailed quantification of the specific roles that individual symptoms play in maintaining both local and global connectivity in Psychopathology Webs. Since both categorical and multidimensional methods lack the ability to provide such information, this attribute makes network theory a promising candidate as a successor to categorical and multidimensional methods of disease description.
Current study
Previous network studies have examined only parts of the full symptom space of psychopathology, or only part of the full spectrum of psychiatric patients [35]. Most studies either used non-empirical data [34] or psychometric instruments that were biased by categorical thinking in some way or another (e.g. by skipping certain questions of a rating scale if patients fail to score on a minimum of symptoms that are supposed to belong to the same disease category or diagnostic group according to the DSM). Current literature therefore lacks a view on the network structure of a comprehensive part of psychopathology outside of the zone of influence of the DSM. The current study aimed to provide such a view by studying the nature of the continuities between network clusters (syndromes) observed within a comprehensive network of symptoms of psychopathology. Since DSM thinking has so dominated the field of psychiatry, it is very hard to find data outside of its zone of influence. Our study 1. examined the broadest scope of the psychiatric symptom space that is currently available using a single validated questionnaire 2. examined the broadest scope of psychiatric patients so far examined, and 3. used a rating scale that is unbiased by previous disease classifications. The Comprehensive Psychopathological Rating scale (CPRS) [36,37] was chosen, which measures symptom scores on a large set of psychiatric symptoms (65). Since it was developed outside of the zone of influence of the DSM, it is one of the few validated rating scales that can provide an unbiased view on the relationships between psychiatric symptoms. The CPRS has good
measures [36,37]. The CPRS measures both reported symptoms and observed signs and symptoms. This allows detection of components such as Retardation and Disorganization that would otherwise go unnoticed when using rating scales that only measure reported symptoms (e.g. the SCL-90). To avoid the narrow view on psychopathology that has resulted from studies that examined patient groups that were selected to conform to predefined DSM criteria, we examined a heterogeneous sample of 192 psychiatric patients suffering from some form of psychopathology as defined in the beginning of the Introduction. Thus, we steered clear of any sample selection biases inherent to previous classifications of mental disorders. From this dataset, a network graph was constructed of the correlational relationships between all symptoms of psychopathology: a ‘Psychopathology Web’. To identify clusters of preferentially co-occurring symptoms, we used a previously published procedure to optimize the community structure of weighted networks, by having PCA and network community detection (NCD) inform each other with respect to the optimal network community structure (modularity) of the dataset [38]. In this previous study, we showed that NCD seems to outperform PCA with respect to its ability to detect plausible modules in datasets with relatively small N. Thus, we expected CPRS symptoms to show clear network communities that represent major syndromes of psychopathology. We expected these communities to be valid in the sense that they showed a good match with the principal component structure of the same dataset, as well as principal component structures of psychopathology published in previous studies. Contrary to categorical or multidimensional descriptions, we expected a rich view on the continuities between the major syndromes of psychopathology. Specifically, we examined the Psychopathology Web for the presence of bridge symptoms that connect the various network clusters of psychopathology. The various roles of individual symptoms in maintaining both local and global connectivity in the Psychopathology Web were quantified and key symptoms were identified as potential targets for treatment. Thus, we aimed to illustrate how a network view of psychopathology can move beyond the limitations of previous methods of disease description such as the categorical and multidimensional views. Finally, the added value of the Psychopathology Web for use in clinical practice was discussed.
Materials and Methods
Ethics Statement
Patient group
In a previous study in 1992, a heterogeneous group of 192 Dutch patients suffering from ‘some form of acute mental illness’ as defined in the beginning of the Introduction was selected for a study of the component structure of mental disorders. The major inclusion criterion was the ability to sustain a clinical interview of about 40 minutes. The major exclusion criterion was insufficient mastery of the Dutch language. This group consisted of 40 newly referred outpatients, 47 patients acutely admitted to a closed department, 73 patients admitted to a short-stay treatment department, and 32 patients residing in medium- and long-stay departments of the same psychiatric hospital. A total of 75
men and 117 women participated (mean age 543 years, SD56.1 years, range
518–86 years). This group was an extension of the group of 99 patients that had
previously been described in a report on the inter-rater reliability of the Dutch version of the CPRS [37]. Both DSM-diagnoses and CPRS scores were recorded for all patients. Overall, 45 patients were diagnosed according to the DSM-III within the group of schizophrenic and other primary psychotic disorders, 102 patients had affective disorders (both acute and chronic), 33 had anxious, dysthymic or adjustment disorders and 12 patients suffered predominantly from psychopathology associated with a personality disorder.
Assessment of symptoms
Patients were screened by different raters in different clinical settings to avoid setting- and rater-specific biases in the correlational structure of the dataset. All raters were trained to administer the CPRS. The training involved the rating of three videotaped or live interviews. During each interview, patients were rated both by an independent clinical psychiatrist that was not responsible for treating the patient and by a research psychiatrist who supervised all ratings and
participated in the study. Clinical psychiatrists and the research psychiatrist held consensus meetings after each assessment to improve the consistency of item ratings across the entire sample. CPRS item scores ranged between 0 and 6, which is different from the 0 to 3 scoring used conventionally. This was done to increase item variance, which facilitates the extraction of component structures, and to make these scores compatible with the item grading used for intensity rating scales that have been derived from the CPRS (e.g. MADRS [39]). To our knowledge, our study is unique in the adoption of a data collection procedure that conforms to these high standards. The interview covered the time span of the preceding week and took about 40 minutes to complete for each patient. For raw data, see Information S1.
Data preprocessing
(0.6%), SD51.5 (0.7%) and were replaced by column mean scores. Next, the 63663 bivariate (Pearson) correlation matrix of the item scores was bootstrapped
(resampled with replacement, n510.000 iterations [40]) using SPSS 18, in order
to provide a more accurate estimation of the correlation coefficients and p values. Subsequent analyses of the component structure and network cluster structure of the psychopathology dataset were performed on this bootstrapped correlation matrix.
Construction of network graphs
A network graph was constructed from the bootstrapped symmetrical univariate correlation matrix of item scores, with rows and column names referring to items. No threshold was applied to the matrix to allow inclusion of all correlations between CPRS item scores. This matrix was filled with the corresponding correlation coefficients (r) and transformed into an undirected and weighted network graph by means of NodeXL [22]. In this network graph, ‘nodes’ (vertices) refer to items, ‘links’ to significant correlations between the items, and the ‘weights’ of the links to the corresponding correlation coefficients.
Network community detection
In order to identify network clusters, we used the Wakita-Tsurumi NCD algorithm integrated within NodeXL [23]. This algorithm is a more efficient variant of the Clauset Newman Moore (CNM) algorithm that finds community structure (‘‘cliquishness’’) of nodes within networks in a bottom-up manner, ‘‘greedily’’ optimizing on the modularity of the network graph [24]. The optimal network community structure (NCS) is found by iteratively merging individual pairs of nodes into clusters (and these clusters into superclusters and so on), until maximum ‘modularity’ is reached. Modularity is defined as a measure that expresses the quality of the modular structure of a dataset, with modularity defined as the extent to which ‘‘internal’’ connectivity measures of network clusters are higher than those of the surrounding (external) network. Groups of nodes that share a maximum of connections amongst themselves rather than with their surroundings are high modularity clusters (i.e. high-quality clusters). The Wakita-Tsurumi algorithm implemented in NodeXL deviates from the original version by not including the ‘‘heuristics’’ that help network communities grow in a balanced way. For further details, see [23].
Optimization of the Psychopathology Web
In contrast to computer networks or the internet, links in correlational network graphs are present with a certain probability, or ‘significance’. The p-score of a correlation (or network link) expresses the probability that the correlation is unjustified (i.e. the link is not there). Hence, the smaller p, the higher the chance of a connection being present. The identification of an optimal network
graph of the CPRS dataset) involves the identification of a level of probability p for the significance of a link at which the NCS of the network is optimal. A definitive way of defining a p value at which a NCS is optimal has been lacking from the international literature. Recently, however, we have published a
procedure to optimize NCS by means of its principal component structure [38]. This procedure attempts to find the level of significance of network links
(correlation coefficient or p value) at which the network community structure of the Psychopathology Web shows an optimal fit with one out of a number of candidate principal component structures (e.g. confirmatory 5, 6, 7, 8, 9, and 10 component PCA; component solutions were rotated using the Varimax criterion). The global threshold for the significance of links is gradually raised in the order of increasing significance (i.e. lowly significant links are successively pruned from the network) until the NCS shows an optimal match with a candidate PCS of the dataset. To express this cluster-to-component match, we used a mismatch (dissimilarity) measure that expresses the absolute number of items within a given network cluster that did not match with the items within a given principal component. This absolute number was divided by the maximum possible mismatch score for that comparison (the sum of the component size and cluster size) to produce a relative mismatch score that varied between 0 (total match) and 1 (total mismatch).
In contrast to the Personality Web described previously in [38], raising the global threshold for the significance of a link in the Psychopathology Web caused some nodes with low correlation coefficients to drop off the network before an optimal match was found. Such ‘isolates’ are weakly connected nodes that during pruning lose their last link to the ‘‘main connected component’’ (i.e. the total body of remaining nodes that are all still interlinked). To avoid an unbalanced match between NCSs and PCSs, a new PCA was performed on the dataset each time a node (item) dropped off the network during pruning (thus, this item was not included in both NCD and PCA). The NCS that showed the closest match with any of the candidate PCSs was kept as the optimized NCS. Its corresponding network graph represented the optimized Psychopathology Web.
Calculating network metrics
derive a log-linear distribution (yielding ln_w_D, ln_w_BS, ln_w_CS). Next, network measures were compared between network clusters (to identify clusters with specific roles in maintaining network connectivity) and between bridge symptoms and core symptoms (to examine the nature of the continuity between the major syndromes of psychopathology). Bridge symptoms and core symptoms were identified by examining all network nodes for cross-cluster connections. As soon as one or more cross-cluster connections were present, a node was classified as a bridge symptom. Else, nodes were classified as core symptoms. In order to compare network measures statistically, we specified a multivariate general linear model (GLM) in which logtransformed and weighted network measures (ln_w_D, ln_w_BS, ln_w_CS) were dependent variables and cluster membership
(CLUSTER, 6 possible values) and bridge symptom status (BRIDGE, 2 values: 1 for bridge symptoms, 0 for core symptoms) were fixed factors. To correct for the possibility that bridge symptoms and core symptoms were unequally distributed across clusters (which could bias the effects of CLUSTER or BRIDGE on network measures), we also specified the interaction CLUSTER*BRIDGE to account for this possible confound. Post-hoc tests were performed to examine differences in estimated marginal means for the following contrasts: 1. CLUSTER (comparing mean scores on network measures between clusters) and 2. BRIDGE (comparing means scores between bridge symptoms and core symptoms).
The cluster coefficient was calculated for each node, which is a measure of the extent to which the direct neighbors of that node are interconnected and (hence) tend to form a cluster. Overall network metrics were calculated that included the mean shortest pathlength of the entire graph (i.e. the average number of links that forms the shortest path between any two nodes of the network). Next, a measure was calculated that expresses the degree of ‘Small Worldness’ of the
Psychopathology Web. This measure takes the ratio of the mean clustering coefficient (C) and mean shortest path length (L), which is compared between the empirically derived (CPRS) network and a generalized and randomly connected network graph of the same size ([43]. Since Small World networks are non-randomly connected (with large mean clustering coefficients and short mean pathlengths) this ratio is larger for Small World network than for randomly connected graphs of the same size. Hence, if S.1, the graph can be considered to have Small World properties.
Results
Results of principal component analyses
The Kaiser-Meyer-Olkin (KMO) score of the dataset prior to bootstrapping was 0.731 indicating reasonable sampling adequacy. Bartlett’s test of sphericity showed a Chi square of 4891.5, df51953, p,1.0 10E-12, indicating high sphericity of the dataset.
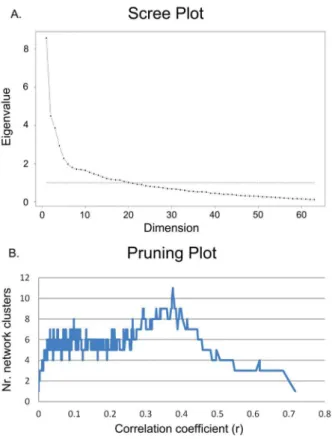
Figure 1A shows the screeplot of the PCA performed on the bootstrapped
resulting from network community structure analyses created during incremental pruning as a function of the correlation coefficient (a ‘pruning plot’). The pruning plot showed that the actual number of clusters in the Psychopathology Web was somewhere between 1 and 11. The screeplot suggested a 10-component structure (10-PCS, data not shown), which deviated from the 5 or 6-PCS found previously in the current dataset without bootstrapping [14]. The lack of a clear bend in the screeplot (Table 1A) made it difficult to establish a clear cut-off for the total number of components to retain from the PCA. Since PCA may produce unreliable results in smaller datasets, 5 additional bootstrapped PCSs (con-firmatory 5, 6, 7, 8, and 9 PCSs) were calculated that served as alternative candidate structures. These were matched against the NCSs as summarized in the pruning plot to find a ‘winning’ PCS and NCS. Thus, NCD and PCA informed each other with respect to an optimal solution.
Figure 1. Scree-plot (A) and pruning plot (B) of the CPRS dataset.A. Scree-plot of the exploratory principal component analysis of the CPRS dataset, suggesting a 10-component structure. Defining a cut-off for the total number of components to extract was complicated by the lack of a clear bend in the plot. Hence, 5 additional alternative component structures were matched to the total array of possible network community structures of the dataset, to allow identification of an optimal solution. B. Incremental pruning plot of network community structure analyses showing the number of clusters in the Psychopathology Web as a function of the correlation coefficient that defines the threshold for significance of the links in the network. Neighborless nodes (isolates) are removed from the calculation and do not count as clusters.
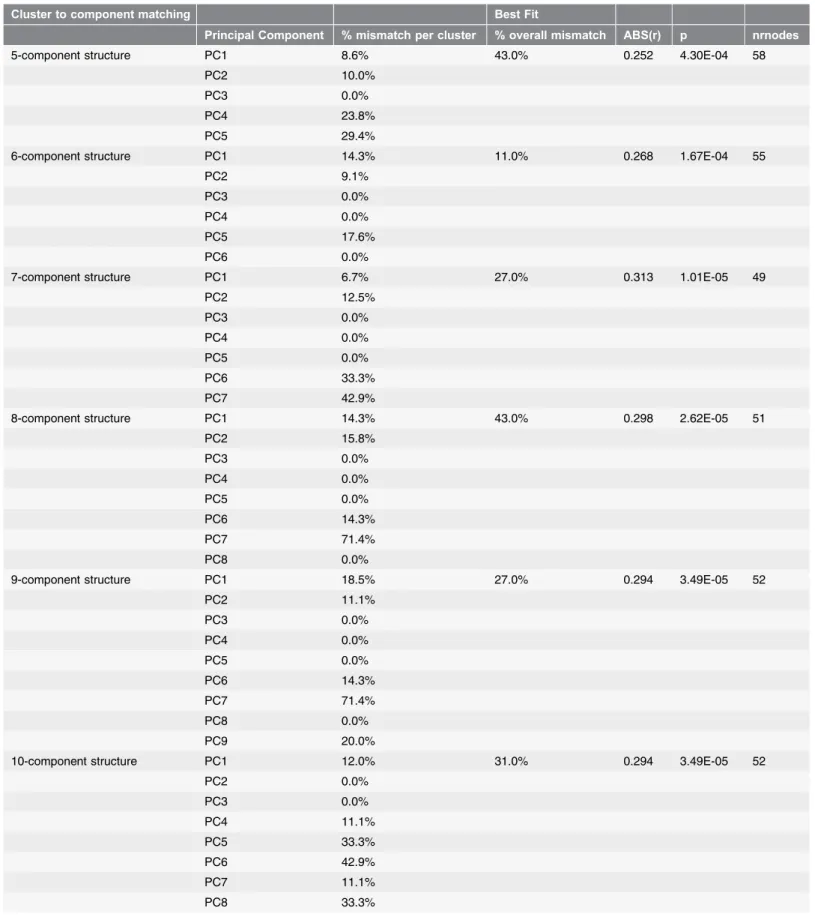
Table 1.Table showing the quantitative results of the cluster-to-component matching procedure.
Cluster to component matching Best Fit
Principal Component % mismatch per cluster % overall mismatch ABS(r) p nrnodes
5-component structure PC1 8.6% 43.0% 0.252 4.30E-04 58
PC2 10.0%
PC3 0.0%
PC4 23.8%
PC5 29.4%
6-component structure PC1 14.3% 11.0% 0.268 1.67E-04 55
PC2 9.1%
PC3 0.0%
PC4 0.0%
PC5 17.6%
PC6 0.0%
7-component structure PC1 6.7% 27.0% 0.313 1.01E-05 49
PC2 12.5%
PC3 0.0%
PC4 0.0%
PC5 0.0%
PC6 33.3%
PC7 42.9%
8-component structure PC1 14.3% 43.0% 0.298 2.62E-05 51
PC2 15.8%
PC3 0.0%
PC4 0.0%
PC5 0.0%
PC6 14.3%
PC7 71.4%
PC8 0.0%
9-component structure PC1 18.5% 27.0% 0.294 3.49E-05 52
PC2 11.1%
PC3 0.0%
PC4 0.0%
PC5 0.0%
PC6 14.3%
PC7 71.4%
PC8 0.0%
PC9 20.0%
10-component structure PC1 12.0% 31.0% 0.294 3.49E-05 52
PC2 0.0%
PC3 0.0%
PC4 11.1%
PC5 33.3%
PC6 42.9%
PC7 11.1%
Incremental pruning
As a result of the incremental pruning of network links, individual nodes (symptoms) were marked by unique thresholds (correlation coefficients) at which they lost their final connections with the central connected component of the network. These correlation coefficients (and hence the order of disappearance of nodes or symptom items from the network) correlated positively with the frequency of occurrence of these symptoms (as measured by the percentage of zero intensity symptom scores, r50.373, p50.003, n5192). Similarly, component loadings turned out to correlate significantly with frequency of occurrence of the symptoms (r50.250, p50.048, n5192). Hence, at least some of the weakly connected items dropped off early during incremental pruning (and showed low component loadings) because of a low frequency of occurrence (this is an inevitable phenomenon in studies of psychopathology, see discussion). Similarly, a trend towards early drop-off was found for items with higher numbers of missing values (r50.216, p50.089, n5192) and a similar trend was found for the
relationship between component loadings and missing values (r520.222,
p50.081, n5192). Hence, missing values may partly have contributed to the loss of nodes during incremental pruning.
Results of network community structure optimization
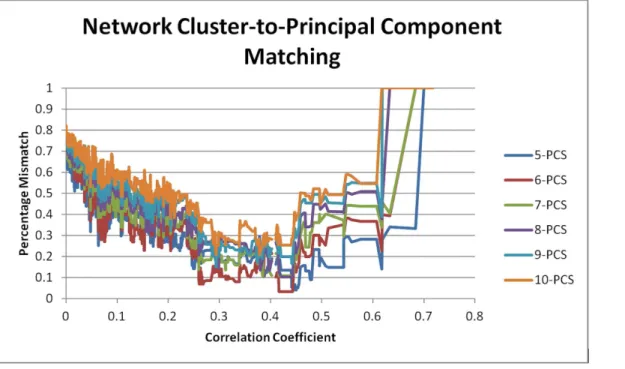
Figure 2 shows the results of matching the full range of network community structures produced by incremental pruning of the Psychopathology Web to 6 alternative component structures (numbered 5–10) of the CPRS dataset. Despite a better global fit of 5-PCS templates, a maximum ‘‘local fit’’ (minimum mismatch scores around a discrete threshold, i.e. a dip) was found with a 6-PCS template. This maximum fit (3.3% mismatch) occurred at r50.427, p51.80 E-09, after 1904 lesser significant links had been removed from the network (Figure 2). At this threshold, some 35 nodes (isolates) dropped off the network, leaving a total of 28 nodes. At this threshold, the network had fallen apart into several connected components (i.e. percolation occurred). The corresponding 6-component matching template of 28 nodes showed no resemblance to any of the original
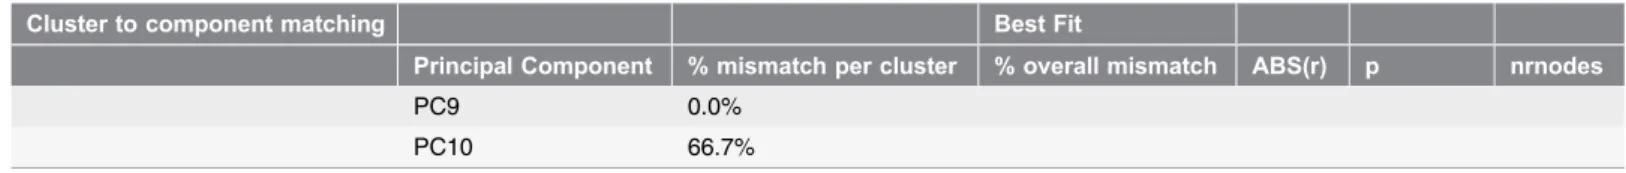
PCS-Table 1.Cont.
Cluster to component matching Best Fit
Principal Component % mismatch per cluster % overall mismatch ABS(r) p nrnodes
PC9 0.0%
PC10 66.7%
Table shows the network community structures (NCS) that were most similar to the confirmatory 5, 6, 7, 8, 9, and 10 principal component structure (PCS) of the CPRS dataset. Component structure: the component structure that was matched against the candidate network community structures obtained from the incremental pruning procedure (see Materials and Methods). Principal Component: the number of the principal component from this component structure. % mismatch per cluster: the percentage of items in a network cluster of the most similar NCS that did not match the item content of its corresponding principal component. % overall mismatch: the percentage of items in the entire NCS that did not match its corresponding PCS. ABS(r): the absolute value of the correlation coefficient at which the optimal match with a NCS was found. p: the corresponding p value. Nrnodes: number of nodes left in the NCS at this threshold (some nodes dropped off the network due to incremental pruning, see text).
templates derived from the whole dataset of 63 items. For these reasons, this ‘maximum’ fit between NCS and PCS was not chosen as an optimal fit with PCS. Instead, the second best fit was chosen, which also involved a 6-component template matching to a 6-network community structure. This second best fit occurred at r50.27, p51.67E-04, after 1767 lesser significant links had been removed from the network. This unpercolated network consisted of a single connected component, and the original 6-PCS of the unpruned dataset could still be largely recognized in the corresponding 6-component factor structure. This solution was stable for 3 consecutively pruned links (r50.2675, to 0.2683, p51.75 E-04 to 1.67 E-04). Similar NCS solutions with slightly lesser fits were found across a broad range of correlation coefficients surrounding the optimal threshold (Figure 2). At this threshold, some 8 nodes (isolates) dropped off the network, leaving a total of 55 nodes for the central connected component of the network. NCS and PCA differed with respect to the placement of 5 out of these 55 items (11% mismatch, 89% match). CLUSTER 1 showed a 14.3% mismatch, CLUSTER 2 a 9.1% mismatch and CLUSTER 5 a 17.6% mismatch with their corresponding components (Table 1). The remaining 3 network clusters (clusters 3, 4, 6) showed a complete match (0% mismatch) with their corresponding principal compo-nents. Hence, the average mismatch score per component/cluster was 6.8% (SD
Figure 2. Results of optimizing the network community structure of the CPRS dataset with respect to its principal component structure.Results of the NCS-to-PCS matching procedure for 6 different components structures of the CPRS dataset. X-axis shows the correlation coefficient r as a threshold for significance of a link in the network graph (as r increases to the right, more links are pruned from the network). Y-axis shows dissimilarity (mismatch) scores. Dark blue: 5-PCS, dark red: 6-PCS, green: 7-PCS, purple: 8-PCS, turquoise: 9-PCS, orange: 10-PCS. Mismatch scores collapse at r50.27 (p51.67E-04), indicating an optimal threshold for the Psychopathology Web and a corresponding six-cluster solution. For details, see text andTables 1and2.
8.0%) (Table 1).Table 2compares the item content of network clusters with that of its matching 6-PCS template.
The Psychopathology Web
Figure 3 shows the optimized network graph of the CPRS (the Psychopathology
Web). With respect to the general topology of the Web, a value of S51.94 was
found for the Small Worldness measure, indicating that the Psychopathology Web was characterized by a Small World network structure (i.e. network metrics were non-randomly distributed across network nodes). The Psychopathology Web showed a 6-cluster structure. Based on the co-occurrence of items within the network clusters and components and previous findings in the international literature, the following designations were reserved for the network clusters: Cluster 1: DEPRESSION, Cluster 2: PSYCHOSIS, Cluster 3: RETARDATION, Cluster 4: BEHAVIORAL DISORGANIZATION, Cluster 5: ANXIETY, Cluster 6: MANIA. Clusters were interconnected by a limited number of bridge symptoms. In subsequent analyses, we examined how network measures were distributed across individual nodes (symptoms), clusters (syndromes), bridge symptoms and core symptoms.
Network metrics of nodes and clusters
Table 3 shows network metrics of all symptoms of the Psychopathology Web. Each symptom was marked by unique scores on network metrics, indicating that each symptom in the Psychopathology Web had its own unique role in
maintaining network connectivity. Items with above 95% confidence scores for weighted degrees (number of connections) were items 01, 05, 06, 07, 09, 13, 14, 15, 16 18, and 41 (DEPRESSION), items 02, 42, 53, 56, and 59 (MANIA), items 03 and 25 (ANXIETY) and item 60 (RETARDATION). Items with above 95% confidence scores for weighted betweenness centralities were it19 (ANXIETY) items 12, 28, 29, 30, 37, 39, 40 (PSYCHOSIS), items 39, 49, 45, 54
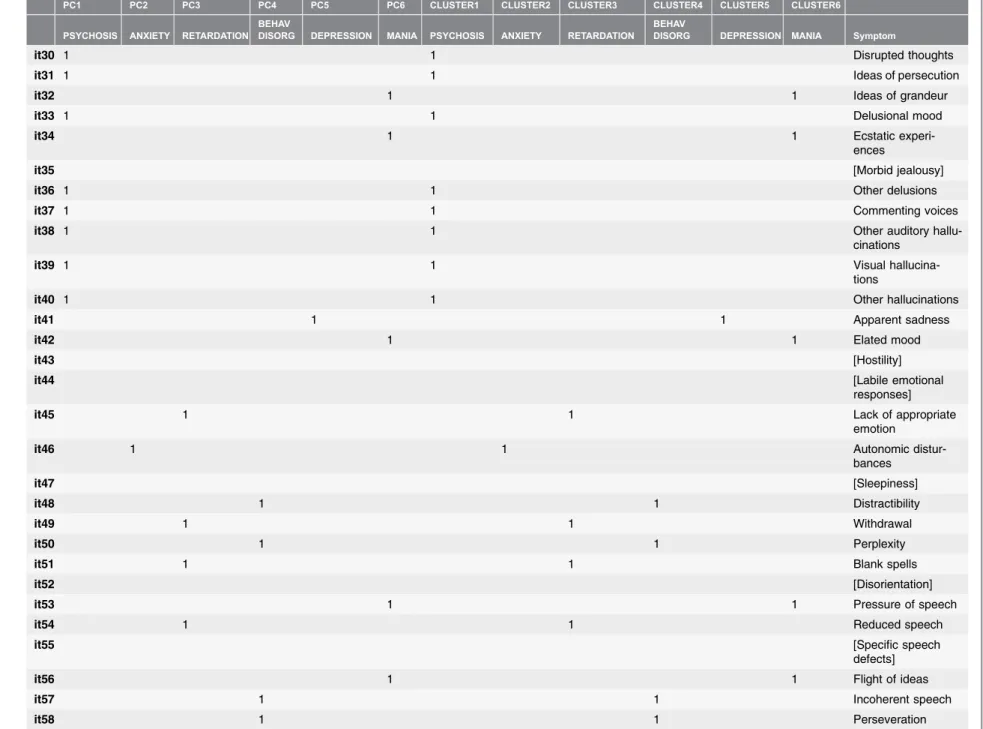
Table 2.Table comparing the component memberships and network cluster memberships of items of the CPRS for the optimal 6-network cluster structure and corresponding 6-component structure.
PC1 PC2 PC3 PC4 PC5 PC6 CLUSTER1 CLUSTER2 CLUSTER3 CLUSTER4 CLUSTER5 CLUSTER6
PSYCHOSIS ANXIETY RETARDATION BEHAV
DISORG DEPRESSION MANIA PSYCHOSIS ANXIETY RETARDATION
BEHAV
DISORG DEPRESSION MANIA Symptom
it01 1 1 Sadness
it02 1 1 Elation
it03 1 1 Inner tension
it04 1 1 Hostile feelings
it05 1 1 Inability to feel
it06 1 1 Pessimistic
thoughts
it07 1 1 Suicidal thoughts
it08 [Hypochondriasis]
it09 1 1 Worrying over trifles
it10 [Compulsive
thoughts]
it11 1 1 Phobias
it12 1 1 Rituals
it13 1 1 Indecision
it14 1 1 Lassitude
it15 1 1 Fatiguability
it16 1 1 Concentration
difficul-ties
it17 1 1 Failing memory
it18 1 1 Reduced appetite
it19 1 1 Reduced sleep
it20 1 1 Increased sleep
it21 1 1 Reduced sexual
interest
it22 1 1 Increased sexual
interest
it23 1 1 Autonomic
distur-bances
it24 1 1 Aches and pains
it25 1 1 Muscular tension
it26 1 1 Loss of sensation or
movement
it27 1 1 Derealization
The
Psychopatho
ONE
|
DOI:10.13
71/journal.p
one.01
12734
November
26,
Table 2.Cont.
PC1 PC2 PC3 PC4 PC5 PC6 CLUSTER1 CLUSTER2 CLUSTER3 CLUSTER4 CLUSTER5 CLUSTER6
PSYCHOSIS ANXIETY RETARDATION BEHAV
DISORG DEPRESSION MANIA PSYCHOSIS ANXIETY RETARDATION
BEHAV
DISORG DEPRESSION MANIA Symptom
it30 1 1 Disrupted thoughts
it31 1 1 Ideas of persecution
it32 1 1 Ideas of grandeur
it33 1 1 Delusional mood
it34 1 1 Ecstatic
experi-ences
it35 [Morbid jealousy]
it36 1 1 Other delusions
it37 1 1 Commenting voices
it38 1 1 Other auditory
hallu-cinations
it39 1 1 Visual
hallucina-tions
it40 1 1 Other hallucinations
it41 1 1 Apparent sadness
it42 1 1 Elated mood
it43 [Hostility]
it44 [Labile emotional
responses]
it45 1 1 Lack of appropriate
emotion
it46 1 1 Autonomic
distur-bances
it47 [Sleepiness]
it48 1 1 Distractibility
it49 1 1 Withdrawal
it50 1 1 Perplexity
it51 1 1 Blank spells
it52 [Disorientation]
it53 1 1 Pressure of speech
it54 1 1 Reduced speech
it55 [Specific speech
defects]
it56 1 1 Flight of ideas
it57 1 1 Incoherent speech
The
Psychopatho
ONE
|
DOI:10.13
71/journal.p
one.01
12734
November
26,
PC1 PC2 PC3 PC4 PC5 PC6 CLUSTER1 CLUSTER2 CLUSTER3 CLUSTER4 CLUSTER5 CLUSTER6
PSYCHOSIS ANXIETY RETARDATION BEHAV
DISORG DEPRESSION MANIA PSYCHOSIS ANXIETY RETARDATION
BEHAV
DISORG DEPRESSION MANIA Symptom
it59 1 1 Overactivity
it60 1 1 Slowness of
move-ment
it61 1 1 Agitation
it62 1 1 Involuntary
move-ments
it63 1 1 Muscular tension
it64 [Mannerisms and
postures]
it65 [Hallucinatory
beha-vior]
It01 etc: item 1 of the CPRS. Left: matching template of the 6-component structure consisting of 55 nodes. Items were assigned to a single component using a forced-choice filter based on the highest component loadings. Right: the 6-cluster network structure showing an optimal match with the matching template. 15member of this component or cluster, blank5not a member. Items that dropped off the network during the incremental pruning procedure or that were discarded from further analyses (it35 and it55, no scores) are shown in [brackets]. Items that were allocated differently by PCA and NCD are shown inbold.See alsoFigure 3.
doi:10.1371/journal.pone.0112734.t002
The
Psychopatho
ONE
|
DOI:10.13
71/journal.p
one.01
12734
November
26,
network. Network clusters of psychopathology therefore seemed to have their own roles in maintaining global connectivity. A further specification of the exact roles roles of individual cluster could not be provided due to the low numbers of items in several clusters (e.g. RETARDATION and BEH DIS), which prohibited a reliable comparison of mean scores on network metrics between the various clusters.
Network metrics of bridge symptoms and core symptoms
Bridge symptoms were identified that formed direct links between the clusters of the Psychopathology Web. In total, some 34 bridge symptoms were found (Table 3), which is 62% of the total number of nodes in the network. Some 21 symptoms (38%) had only internal connections to their corresponding clusters and were termed ‘core symptoms’ (Table 3). The maximum number of external clusters that was bridged by a single bridge symptom was 3 (Table 3). Network metrics were compared between bridge symptoms and core symptoms. Thus, we were able to perform a detailed analysis of the nature of the continuities between the major syndromes of psychopathology as defined by network clusters. Bridge symptoms showed significantly higher log-transformed and weighted degrees than core symptoms (F518564, df51, p59.5 E-5). Additionally, bridge symptoms had
larger log-transformed and weighted within-cluster degrees (mean 51.19,
SE50.08) than core symptoms (mean 50.88, SE50.13), indicating that the
internal connections of bridge symptoms were stronger than those of core
symptoms (F519225, df51, p54.2 E-4). Thus, bridge symptoms had a stronger
within-cluster influence than core symptoms. Bridge symptoms also showed significantly higher log-transformed and weighted betweenness centralities than
core symptoms (F519005, df51, p58.0 E-5). Additionally, bridge symptoms
showed significantly higher log-transformed and weighted closeness centralities
(mean 525.0, SE50.021) than core symptoms (mean525.2, SE50.033),
indicating that bridge symptoms were more easy to reach by all other nodes in the
network than core symptoms (F537441, df51, p52.46 E-7). Thus, bridge
symptoms had a stronger global influence than core symptoms.
Discussion
This study presents the first comprehensive network graph of the relationships between symptoms of psychopathology that exist in a heterogeneous group of patients: a ‘Psychopathology Web’. This graph is free of any preconceived conceptual biases of the categorical system of the DSM. It turns out that all symptoms of psychopathology are interconnected. Connections are
Figure 3. The Psychopathology Web.Network graph of the correlational relationships between 55 items (symptoms) of the CPRS, which form a 6-cluster structure. Node5CPRS item (symptom), link5significant correlation. The threshold for the significance of network links has been optimized using the procedure described above. Red links: positive correlations. Blue links: negative correlations. The thickness of the links reflects the strength of their corresponding correlation coefficient (weight). It01 etc: item number of the CPRS. Nodes are positioned according to the Hagel-Koren Fast Multiscale layout algorithm. The color of the nodes shows their network cluster membership. Yellow: ANXIETY, Light Blue: DEPRESSION. Orange: MANIA, Green: PSYCHOSIS, Grey: RETARDATION, Brown: BEHAVIORAL DISORGANIZATION. NCD and PCA differ with respect to the placement of items 03, 04, 25, 27, and 28. These mismatches occur at the boundaries between the DEPRESSION cluster and the PSYCHOSIS cluster, and between the DEPRESSION cluster and the ANXIETY cluster and can be interpreted as ‘border disputes’ between NCD and PCA. Spheres: bridge symptoms. Closed diamonds: core symptoms. Node size denotes betweenness centrality score of the node (a measure of its involvement in connecting the various parts of the
Psychopathology Web through shortest paths). Smaller and larger loops can be observed that run within and between the various network clusters. See text for further details.
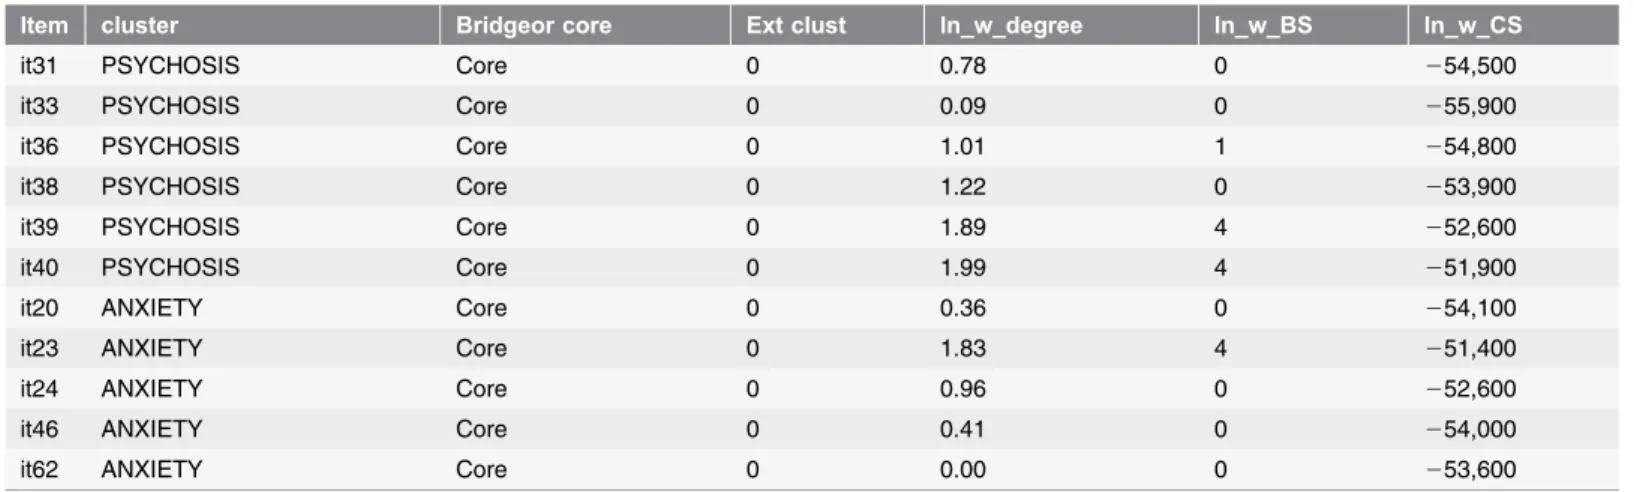
Table 3.Network metrics of individual symptoms of the Psychopathology Web.
Item cluster Bridgeor core Ext clust ln_w_degree ln_w_BS ln_w_CS
it50 BEH DIS Bridge 1 1.04 3 253,700
it57 BEH DIS Bridge 1 1.75 4 252,000
it61 BEH DIS Bridge 1 1.35 3 253,100
it01 DEPRESSION Bridge 2 3.48 6 247,000
it05 DEPRESSION Bridge 3 3.19 1 247,700
it06 DEPRESSION Bridge 2 2.85 0 248,600
it07 DEPRESSION Bridge 2 3.11 4 247,800
it09 DEPRESSION Bridge 2 2.32 5 248,700
it11 DEPRESSION Bridge 2 1.46 0 249,800
it13 DEPRESSION Bridge 2 2.62 0 248,800
it14 DEPRESSION Bridge 3 3.24 5 247,400
it15 DEPRESSION Bridge 1 2.76 4 248,800
it16 DEPRESSION Bridge 2 3.01 2 248,400
it18 DEPRESSION Bridge 3 3.15 5 248,100
it41 DEPRESSION Bridge 3 3.32 5 247,000
it45 RETARDATION Bridge 1 1.66 4 251,000
it49 RETARDATION Bridge 1 1.87 4 251,100
it54 RETARDATION Bridge 1 2.06 4 249,700
it60 RETARDATION Bridge 2 2.44 5 248,900
it02 MANIA Bridge 1 3.01 4 248,600
it32 MANIA Bridge 1 1.64 1 251,300
it34 MANIA Bridge 1 1.97 2 250,300
it42 MANIA Bridge 2 3.06 5 248,200
it53 MANIA Bridge 2 2.44 0 249,500
it56 MANIA Bridge 2 2.58 5 249,200
it59 MANIA Bridge 2 2.29 4 250,500
it12 PSYCHOSIS Bridge 1 1.53 5 251,100
it27 PSYCHOSIS Bridge 1 1.00 0 250,800
it28 PSYCHOSIS Bridge 1 1.89 5 249,800
it37 PSYCHOSIS Bridge 1 1.59 4 252,500
it03 ANXIETY Bridge 2 3.11 5 247,900
it19 ANXIETY Bridge 1 1.32 4 251,400
it25 ANXIETY Bridge 1 2.49 4 249,500
it63 ANXIETY Bridge 1 1.95 4 250,100
it48 BEH DIS Core 0 1.34 1 254,400
it58 BEH DIS Core 0 1.46 3 253,800
it04 DEPRESSION Core 0 0.09 0 251,800
it17 DEPRESSION Core 0 1.76 0 250,500
it21 DEPRESSION Core 0 2.02 0 250,000
it26 DEPRESSION Core 0 0.11 0 252,500
it51 RETARDATION Core 0 0.80 0 253,000
it22 MANIA Core 0 1.65 0 251,200
it29 PSYCHOSIS Core 0 1.86 4 251,500
states and behavioral disturbances. Hence, we confirm previous findings of PCA studies that psychopathology has a multimodular structure. Network clusters corresponded strongly to principal components of psychopathology (89%). In contrast to categorical or multidimensional methods, network analysis allows for a detailed analysis of the relative contributions of distinct symptoms in promoting the local clustering of symptoms into syndromes and in connecting the major syndromes of psychopathology. These findings and their clinical significance will be discussed in more detail below.
The Psychopathology Web
All symptoms of psychopathology were part of a single ‘connected component’. In other words, a global continuity was found between all symptoms and syndromes of psychopathology, which is a finding that argues against the categorical view of psychopathological syndromes as disconnected phenotypes. Yet within this globally connected structure, network clusters were identified that represented a relative autonomy (or segregation) of symptoms with respect to other clusters and the network structure at large. It therefore seems that proponents of segregated psychopathological syndromes and those that favor a more integrated view can reconcile their views by showing that they may have emphasized different aspects of the same multimodular network structure. Below, we will compare the network clusters that were found in the current study with principal components of psychopathology that were identified in previous studies and with related categories of the DSM-IV-TR. Next, we will discuss the benefits of a network view on psychopathology when compared to multidimensional and categorical systems.
Table 3.Cont.
Item cluster Bridgeor core Ext clust ln_w_degree ln_w_BS ln_w_CS
it31 PSYCHOSIS Core 0 0.78 0 254,500
it33 PSYCHOSIS Core 0 0.09 0 255,900
it36 PSYCHOSIS Core 0 1.01 1 254,800
it38 PSYCHOSIS Core 0 1.22 0 253,900
it39 PSYCHOSIS Core 0 1.89 4 252,600
it40 PSYCHOSIS Core 0 1.99 4 251,900
it20 ANXIETY Core 0 0.36 0 254,100
it23 ANXIETY Core 0 1.83 4 251,400
it24 ANXIETY Core 0 0.96 0 252,600
it46 ANXIETY Core 0 0.41 0 254,000
it62 ANXIETY Core 0 0.00 0 253,600
Item: item of the CPRS. Cluster: name of the network cluster to which the symptom belongs (one of 6 network clusters identified in the CPRS dataset). Bridge or core: specifies whether the symptom is a bridge symptom or a core symptom. Ext. clust.: number of external clusters that the (bridge) symptom connects with. Ln_w_D: logtransformed and weighted degree. Ln_w_BS: logtransformed and weighted betweenness centrality. Ln_w_CS: logtransformed and weighted closeness centrality.
Elementary syndromes of psychopathology
We identified six network clusters that received the following designations based on a review of the multidimensional literature: DEPRESSION, MANIA,
PSYCHOSIS, ANXIETY, RETARDATION and BEHAVIORAL
DISORGANIZATION. For a more detailed characterization of each of these clusters (and for a comparison of the symptom content of network clusters to that of DSM categories and principal components of psychopathology reported in previous studies), we refer to Information S2. To summarize, the symptom content of the network clusters was highly similar to that of principal components reported in previous studies. Since the 1950s, only two studies have reported a component structure of psychopathology in an unselected sample of acutely admitted patients. These studies have found either 10 or 11 components [20,44] of which some 6 dimensions were largely retrieved in the current study (with previous labels differing somewhat from those used here).
PCA studies of a more narrow selection of patients using the SCL-90 rating scale have reported separate components for (Retarded) Depression [45–48], Somatic Anxiety/Somatization [45–48], Anger-Hostility/Irritability [45–48], Phobic Anxiety [45,46,48], Paranoid Psychoticism [45,48], Obsessive-Compulsive symptoms [45,48], Functional Impairment [46] and Attention Problems [47] (the latter two being similar to Obsessive Compulsive symptoms). Notably, none of the SCL-90 studies produced separate components for RETARDATION,
DISORGANIZATION and MANIA. For MANIA, this is likely due to the fact that the corresponding items are missing in the SCL-90. Additionally, the SCL-90 does not measure observed items, which is known to prevent detection of
RETARDATION and DISORGANIZATION components.
studied, or the clustering technique that was used). These reasons are discussed in more detail in the Information S2.
Apart from psychometric or methodological issues, the observation that certain clinical pictures cannot be mapped to a single principal component or network cluster may have a more fundamental reason. Multidimensional studies have long shown that psychiatric disorders do not represent unitary syndromes at all, but rather result from the recombination of a limited number of principal
components. When such components are extracted from large and unselected patient samples, they are to some degree common to all patients in the sample and can hence be considered to represent ‘universal’ components of psychopathology. Most crucially, however, since the same syndromes can be a part of many different clinical pictures, they can be considered as ‘elementary’ components of
psychopathology. For instance, schizophrenia is known to constitute the combined activity of the components of Psychosis (Positive symptoms), Retardation (Negative symptoms) and Disorganization (of behavior and
thoughts), with the possible addition of affective components such as Mania or Depression [49–51]. Similarly, unipolar melancholic depression according to DSM-IV-TR involves the combined activity of Depression, Retardation and Anxiety [24]. Other subtypes of unipolar depression may be obtained through the admixture of several additional components, such as Psychosis or Anger [52]. Bipolar disorders involve the successive scoring on Depression and Mania components (with low scores on Retardation and high scores on
Disorganization). Patients with cyclothymia, hypomania, or mania show differential activity in Mania, Anger, Depression and Retardation components, producing combinations of symptoms that differ in their intensity and severity [53,54]. Mixed-type bipolar patients may show simultaneous activity within Depression, Mania, Anger, Anxiety and Retardation components [52,55–57]. Schizoaffective disorders represent the (de)synchronized activity of affective components (e.g. Depression, Mania, Anger, Anxiety) and a Psychosis component [58,59]. Similarly, catatonia represents the combined activity of the Retardation component (e.g. slowness of movement or waxy flexibility), along with Anxiety (high arousal and muscle tension) and Disorganization components (e.g.
agitation, perplexity, perseveration) [60,61]. In all these disorders, the same basic syndromes reappear in different configurations. Thus, the full landscape of psychopathology can be explained by the activity of a limited number of elementary syndromes (typically about 10).
Elementary syndromes versus previous classifications of
psychopathology
increasing the number of disease entities, which is an impractical solution. As such, the DSM is much like a list of all colors you can possibly discern, or an inventory of all forms of matter you can possibly encounter, whereas it should actually be more like a list of the primary colors that explain the subtleties in all observable colors through their relative admixtures, or the periodic system of elements in chemistry, which explains all variance in observable matter in terms of the recombination of a limited number of chemical elements. Similarly, the DSM should list all elementary syndromes (primary colors, elements) and provide epidemiological data on the most relevant combinations of these syndromes (color blends, forms of matter). Of course, the most prevalent or relevant of combinations of elementary syndromes can still be given unique names for ease of designation (e.g. ‘retarded-disorganized psychosis’, ‘vegetative-retarded depres-sion’ or ‘vegetative anxiety syndrome’).
Another problem of the DSM is that is has attempted to capture the multitude of causal factors that may contribute to psychiatric disorders into a multitude of distinct disease entities. For example, the DSM recognizes the existence of a ‘‘Mood Disorder due to substance abuse’’, a ‘‘Psychiatric Disorder due to a physical condition’’, or a ‘‘Psychiatric Disorder due to relational problems’’. Thus, previous versions of the DSM have attempted to solve the problem of
multifactorial etiologies of psychiatric disorders again by increasing the quantity of disease entities. As a result, the total number of DSM diagnoses has increased even further. Since the number of possible causes of psychiatric illness is near infinite, increasing the number of diagnostic entities is not the solution. One of the most important findings in the past decades has been the fact that the nature of the causal factors that contribute to psychiatric disorders (if known at all) is only relevant to these disorders up to a certain point [62]. The sheer inexhaustible number of biological vulnerabilities, substances and social situations that may afflict the mind ultimately lead to the expression of only 10 elementary syndromes (and about an equal number of basic personality domains). It is as if the brain only has a limited number of global circuits that can be affected by internal or external influences. The total number of discernible syndromes can therefore be drastically reduced, which may significantly add to the clarity of the field.
As a general classification of psychiatric disorders, DSM-5 provides a short list of about 20 main categories. On a first glance, these main categories more closely resemble elementary syndromes (e.g. Depressive Disorders, Bipolar Disorders, Psychotic Disorders). However, such main categories still represent categories that suffer from the limitations discussed above (nonvalid demarcations,
From the point of view of elementary syndromes, the problem of current multidimensional research also becomes more clear. With only a few minor exceptions, previous studies invariably examined principal component structures within patient populations or rating scales predefined by the diagnostic categories of the DSM. To use the above analogy, multidimensional research has much been like color specialists attempting to isolate primary colors from narrowly defined color blends such as Orange, Turquoise or Olive Green. As a result, an incomplete view of the elementary syndromes of psychopathology has emerged, which failed to convince clinicians of their potential value. In the same analogy, the use of a heterogeneous sample of patients to extract elementary syndromes is the statistical equivalent of using ‘white light’, which contains a balanced number of all primary colors. The current study is one of the very few studies worldwide that have attempted to provide such a balanced picture. However, we know of no single validated questionnaire that covers all major elementary syndromes of
psychopathology and human personality. All current rating scales (including the CPRS) provide an incomplete view of the full landscape of elementary syndromes of psychopathology. We therefore call for the creation and validation of a novel comprehensive rating scale for psychopathology that incorporates all comple-mentary symptoms from previous scales. This scale should be administered in a large and unselected group of patients to extract the full number of elementary components of psychopathology and personality. A large epidemiological survey could then produce the required data on the most prevalent or salient
combinations of elementary syndromes and personality domains in different populations of psychiatric patients and the general population.
Network metrics: not all combinations of symptoms are equally
likely
So far, we have shown that network clusters are very similar to principal
components and that network clusters of psychopathology qualify as elementary syndromes that can recombine within individual patients to generate a multitude of clinical pictures. This line of thought is not new, nor unique to network theory [15]. Below, we will show that the network approach has additional benefits that are not available using any of the previous methodologies.
are connected indirectly through a number of intermediate symptoms and connections. This asymmetry in the wiring of symptoms indicates that constraints are put on the likelihood of all possible combinations between symptoms and elementary syndromes. As a result, specific collections of symptoms and
syndromes show preferential patters of association (i.e. comorbidity patterns). In a previous (non-empirical) study, Borsboom et al showed that network metrics (preferential connections) between DSM symptoms predicted comorbidity patterns in a realistic manner [34]. Similarly, studies in empirical networks may produce network metrics of bridge or core symptoms that could realistically predict comorbidity patterns. Network analysis allows for a precise quantification of the various roles of individual symptoms and elementary syndromes in generating connectivity across different scale levels of observation and in shaping the general landscape of psychopathology. This will be discussed below.
Network metrics: defining the local and global influence of
symptoms
To examine the local influence of nodes within network structures, a common measure is the weighted degree of these nodes (also called the ‘strength’ or ‘local influence’ of a node). To measure the influence of individual nodes at larger distances, a common measure is weighted betweenness centrality, which is a measure of the number of (weighted) shortest paths that crosses the node, or the degree to which a node is central in mediating traffic between different areas of the network. Finally, a measure of the global influence of symptoms across the network is weighted closeness centrality, which is a measure of the ease with which a particular symptoms can be reached by all other symptoms in the network through weighted shortest paths. In each cluster of the Psychopathology Web, symptoms could be identified with highest weighted degrees and centrality measures for that cluster, indicating that these symptoms played unique roles in generating local (within-syndrome) coherence and/or in knitting the
This is a general issue in empirically derived Psychopathology Webs. Since some network clusters were too sparsely sampled to allow reliable comparisons of mean scores on network metrics, we were unable to verify whether indeed MANIA and DEPRESSION clusters showed significant differences in mean influence when compared to other clusters. Nevertheless, since data collection conformed to a number of stringent criteria (see Materials and Methods), we consider the current results to be among the most valid empirical data so far produced on network metrics of psychopathological symptoms. Future studies should aim to capture all relevant elementary syndromes in a single network graph and include many more symptoms per cluster to produce more accurate estimations of network metrics. This would allow a detailed study of the relative importance of specific symptoms and elementary syndromes in generating specific forms of psychopathology.
Our findings somewhat contradict an earlier report of Borsboom et al. that
insomnia has the highest degree of all symptoms of psychopathology, followed by
psychomotor agitation, psychomotor retardation and depressed mood[34]. In our study, insomnia (reduced sleep, it19) rather showed a low degree (as did increased sleep, it20). We do confirm a relatively high degree for psychomotor agitation (agitation: it60) and depressed mood (it01, it41). When compared to the study of Borsboom et al., the CPRS provided a richer sampling of Psychomotor
Retardation, which formed a network cluster of its own. Hence, it is difficult to
compare network metrics of retardation between these two studies. The study of
Borsboom et al. also found that symptoms with the highest (random walk) betweenness centrality wereirritable,distracted,anxiousanddepressed.In contrast, Irritability (hostile feelings (it04) in our study) anddistractibility (it48 in our study) showed relatively low betweenness centralities in our study. We do confirm relatively high levels of betweenness centrality for symptoms of ANXIETY and DEPRESSION (although the later two formed clusters of their own). It is important to note that the results of Borsboom et al. did not involve direct empirical measurements. Instead, a network was made of DSM-based symptoms, in which two symptoms were connected if they featured within the same DSM category. Given the redundancy of the symptom content of DSM categories (see above), higher degrees or betweenness centralities may have been found in some cases. Also, network metrics in the study of Borsboom et al. were not weighted to account for the strength of the relationships between the symptoms. The above factors may have explain several of the differences with our findings.