PANOECONOMICUS, 2013, 6, pp. 725-741
Received: 09 November 2011; Accepted: 13 November 2012.
UDC 336.76 (6) DOI: 10.2298/PAN1306725N Original scientific paper
Matthias Nnadi
School of Management, Cranfield University, UK
Nyema Wogboroma
Department of Business Education, Rivers State University of Science & Technology,
Port Harcourt, Nigeria
Bariyima Kabel
Department of Accountancy, Rivers State University of Science & Technology,
Port Harcourt, Nigeria
We wish to acknowledge funding assistance from the Chartered Insti-tuted of Taxation (CITA).
Determinants of Dividend Policy:
Evidence from Listed Firms in the
African Stock Exchanges
Summary: The study demonstrates that much of the existing theoretical litera-ture on dividend policy can be applied to the emerging capital markets of Afri-ca. Using available financial data of listed firms in the 29 stock exchanges in Africa, the study finds similarities in the determinants of dividend policy in Afri-can firms with those in most developed economies. In particular, agency costs are found to be the most dominant determinant of dividend policy among Afri-can firms. The finding is non-synonymous with emerging capital markets which have a high concentration of private ownership and trading volumes. Agency cost theory may be important in both emerging and developed capital markets but the nature of the agency problem may be different in each case. Other factors such as level of market capitalisation, age and growth of firms, as well as profitability also play key roles in the dividend policy of listed African firms.
Key words:Dividend policy, African countries, Listed firms, Corporate govern-ance.
JEL: G30, G35.
Dividend policy is primarily concerned with the decisions regarding dividend payout and retention. Ronald C. Lease et al. (2000) described it as the practice adopted by managers in making dividend payout decisions. It details the amount of cash to be distributed to the shareholders and what is to be retained by the bank for further in-vestment. It is a decision that considers the amount of profits to be retained and that to be distributed to the shareholders of the bank. The objective of a firm’s dividend policy is to be consistent in the overall objective of maximising shareholders wealth since it is the aim of every investor to get a return from their investment. Much of dividend policy studies have concentrated on developed economies of Western Europe and North America but with little attention on Africa region. A study of divi-dend policy of listed firms in African has become pertinentin view of the growing investments in the continent. A well regulated stock market is a vehicle for economic development, and should have a spin-off effect on the dividend policy of public companies.
726 Matthias Nnadi, Nyema Wogboroma and Bariyima Kabel
business? Presumably, in taking any course of action, managers should concentrate on how to maximise the wealth of shareholders for whom the firm is being managed. Managers must not only consider the question of how much of the company’s earn-ings is needed for investment but also take into consideration the possible effect of their decisions on share prices.
The discrepancy in the dividend policy of African firms and the implications on the general economic activities and growth has not gone unnoticed. Studies such as Varouj Aivazian, Laurence Booth, and Sean Cleary (2003), Matthias A. Nnadi and Meg E. Akomi (2008) and Gordon N. Asamoah (2010) have focused on various im-plications of dividend policy in developing economies particularly in Africa. The abnormal design of dividend in the region has often been a deliberate management policy. Ashiq Ali (2007) examined listed firms in the Tunisian stock exchange and found that the dividend policy of corporations is significantly different from the widely accepted dividend policy of corporations operating in developed markets. Generally, the dividend policy of firms in developing economies varies in some re-spects with those of developed economies (Shania Taneem and Ayse Yuce 2011).
This paper therefore examines the factors influencing dividend of listed firms in the 29 stock exchanges in Africa. The analysis is based on a panel data set of both dividend-paying and non-dividend-paying firms, since exclusion of the non-dividend paying firms from the analysis may lead to a selection bias. Many of the factors that are found to be significant in the determination of dividend policy are the same as those found in developed capital markets.
1. Review of Empirical Literature
Three main contradictory theories of dividends are commonly identified in finance literature. Some scholars (Kin C. Han, Suk H. Lee, and David Y. Suk 1999; Helen Short, Hao Zhang, and Kevin Keasey 2002) argue that an increase in dividend pay-ments increases a firm’s value. Other views proposed byGareth Morgan and Stephen Thomas (1998), Frankline Allen, Antoniao E. Bernardo, and Ivo Welch (2000) claim that high dividend payouts may destroy a firm’s value. Their assertions are based on the M&M theory that dividend is irrelevant and all effort spent on the dividend deci-sion is wasted. These views are embodied in three theories of dividend policy: the high dividends increase share value theory (or the so-called “bird-in-the-hand” argu-ment), the low dividends increase share value theory (the tax-preference arguargu-ment), and the dividend irrelevance hypothesis.
Dividend debate is not limited to these three approaches. Several other theo-ries of dividend policy have been presented, which further increase the complexity of the dividend puzzle. Some of the more popular of these arguments include the infor-mation content of dividends (signalling), the clientele effects, and the agency cost hypotheses. The dividend irrelevance theory is pitched on the assumption that a per-fect market dividend policy has no efper-fect on either the price of a firm’s stock or its cost of capital. The shareholder is not affected by the dividend decision and therefore would be indifferent between dividends and capital gains.
727
Determinants of Dividend Policy: Evidence from Listed Firms in the African Stock Exchanges
48 companies listed on the Tunisian Stock Exchange for the period 1990 to 1997. Using unbalanced panel data, they estimated a random effects Lintner model in a dynamic setting to test whether the probability of creating future value of the Tuni-sian companies related to dividend policy, financial policy, and profitability. Divi-dend (measured by payout ratio) and financial (measured by debt to total assets) policies were found to be insignificant. Their conclusion supports the M&M irrele-vance propositions of dividend and capital structure. Despite all the empirical work testing the dividend irrelevance hypothesis, the impact of dividend policy on the value of a firm remains unresolved.
An alternative view about the effect of dividend policy on a firm’s value is that dividends increase a firm’s value. In a world of uncertainty and imperfect infor-mation, dividends are valued differently to retained earnings (or capital gains). Inves-tors prefer the “bird in the hand” hypothesis (BIHH) of cash dividends rather than the “two in the bush” of future capital gains. Increasing dividend payments, ceteris pari-bus, may then be associated with increases in a firm’s value. Empirical support for the BIHH as an explanation for paying dividends is generally very limited, and the argument has been challenged especially by M&M (1961) who argued that the re-quired rate of return (or the cost of capital) is independent of dividend policy, sug-gesting that investors are indifferent between dividends and capital gains.
The tax-effect hypothesis suggests that low dividend payout ratios lower the cost of capital and increase the stock price. In other words low dividend payout ratios contribute to maximising the firm’s value. This argument is based on the assumption that dividends are taxed at higher rates than capital gains. Therefore, investors in high tax brackets might require higher pre-tax risk-adjusted returns to hold stocks with higher dividend yield. This relationship between pre-tax returns on stocks and dividend yields is the basis of a posited tax-effect hypothesis. In contrast, Aivazian, Booth, and Cleary (2003) posit that most emerging markets have a more bank-centred financial system, where contracting is not normally at arm’s length, com-pared to firms in Europe and the US.
Clienteles will be attracted to firms that follow dividend policies that best suit their particular situations. Similarly, firms may intentionally attract different clien-teles by their dividend policies. For example, firms operating in high growth indus-tries that usually pay low (or no) dividends attract a clientele that prefers price appre-ciation in the form of capital gains tax to dividends. On the other hand, firms that pay a large amount of their earnings as dividends attract a clientele that prefers high divi-dends. Allen, Bernardo, and Welch (2000) suggest that clienteles such as institutional investors tend to be attracted to invest in dividend-paying stocks because they have tax advantage.
728 Matthias Nnadi, Nyema Wogboroma and Bariyima Kabel
Using a sample of 225 Brazilian firms, Andre Carvalhal-da-Silva and Ricardo Leal (2003) found that government controlled firms have the highest payout ratios with an average of 36 percent, while family-controlled firms have the lowest with 28 percent. Foreign- and institutional-controlled firms have dividend payouts of 35 per-cent and 34 perper-cent respectively. Though their results were not statistically signifi-cant, they do indicate the level of dividend paid by the different strata of owners. Appropriate regulatory framework and control are therefore necessary in maintaining a healthy stock market. Ognjen Radonjić and Miodrag Zec (2010) agree that a tinual and timely updates of the financial markets regulations is panacea to the con-stant crisis observed in most economies. Such regulations should involve proper regulations of corporate dividend polices.
Gang Wie, Zhang Weiguo, and Jason Z. Xiao (2003) showed that ownership structure is an important determinant of corporate dividend policy. They found sig-nificant results in dividend payment by firms owned by the State compared to those owned by individuals. However, using a sample of 133 Finnish listed firms, Benja-min C. Maury and Anete Pajuste (2002) found a positive relationship between indi-vidual and family controlled firms and dividend levels. Firms where the CEO has a controlling power are likely to have low dividend payout ratios.
As seen in the literature, the vast majority of the studies have been published on dividend policy in developed markets but very few studies have examined divi-dend policy of listed firms in the African stock exchanges. This study therefore in-tends to fill the niche by examining the intrinsic determinants of the dividend policy of listed firms in the African region.
2. Research Methodology
The study used available accounting data of listed firms in the 29 stock exchanges in Africa from the period 1998-2009. Table 1 contains a list of the stock exchanges and the number of listed firms at each one. The data available consists of balance sheets, income statements, financial ratios, and other relevant public information for all quoted companies. From the available financial data, a database containing all rele-vant financial figures for the companies was constructed. However, due to missing data, the panel is unbalanced and the number of observations for each company and country differ.
729
Determinants of Dividend Policy: Evidence from Listed Firms in the African Stock Exchanges
The focus of this study is on payout only in the form of cash dividends rather than share repurchases or stock dividends. The reason for this is because most listed African firms do not repurchase their shares, and stock dividends are not commonly used. Three measures of dividend policy, namely cash dividends, the dividend payout ratio, and dividend yield are used in the study. The cash dividend represents the amount of annual cash distributed to shareholders as most African companies pay dividends on an annual basis. The dividend payout ratio is the ratio of dividend per share to earnings per share. The dividend yield is defined as the dividend per share to market value.
We theorise that age and growth significantly affect firms’ dividend policy. As firms become mature, their growth and investment opportunities shrink, resulting in a decline in their capital expenditures. Thus more free cash flows are available to be paid as dividends. In order to test whether investment opportunities affect dividend policy, the MBR is included in the variables. The idea is that if a firm’s market value is greater than its book value, then it has larger growth opportunities. This proxy has been widely used in finance literature (Nickoaos Travlos, Lenos Trigeorgis, and Nikos Vafeas 2001; Sanjay Deshmukh 2003). The higher the firm’s MBR, the greater the growth options and therefore the less likely is firm is to pay dividends in order to finance that growth.
Table 1 List of Listed Firms in the African Stock Exchanges
Country Stock exchange Number of
listed firms#
Sample used in the study
1 Algeria Bourse d’Alger, Algiers 7 - 2 Botswana Botswana Stock Exchange, Gaborone 44 - 3 Cameroun Douala Stock Exchange 2 - 4 Cape Verde Bolsa de Valores de Cabo Verde - - 5 Cote d’Ivoire Bourse Regionale des Valeurs Mobilieres, Abidjan 39 - 6 Egypt Cairo and Alexandria 378 378 7 Ghana Ghana Stock Exchange, Accra 28 - 8 Kenya Nairobi Stock Exchange 48 - 9 Libya Libyan Stock Market, Tripoli 7 - 10 Malawi Malawi Stock Exchange, Blantyre 8 - 11 Mauritius The Stock Exchange of Mauritius, Port Louis 40 - 12 Morocco Casablanca Stock Exchange 81 81 13 Mozambique Maputo Stock Exchange 3 - 14 Namibia Namibia Stock Exchange, Windhoek 34 - 15 Nigeria Abuja Securities and Commodities Exchange 1 - 16 Nigeria Nigerian Stock Exchange, Lagos 223 223 17 Rwanda Rwanda Over the Counter Exchange, Kigali 2 - 18 South Africa Alternative Exchange Johannesburg 51 51 19 South Africa Bond Exchange of South Africa, Johannesburg 400 400 20 South Africa Johannesburg Securities Exchange Limited 472 472 21 South Africa The South African Futures Exchange Johannesburg 49 - 22 Sudan Khartoum Stock Exchange Khartoum - - 23 Swaziland Swaziland Stock Exchange 10 - 24 Tanzania Dar es Salaam Stock Exchange, Tanzania 11 -
25 Tunisia Bourse de Tunis 56 56
26 Uganda Uganda Securities Exchange 14 - 27 Zambia Agricultural Commodities Exchange of Zambia - - 28 Zambia Lusaka Stock Exchange 16 - 29 Zimbabwe Zimbabwe Stock Exchange 81 81
TOTAL 2018 1742
730 Matthias Nnadi, Nyema Wogboroma and Bariyima Kabel
To examine the extent to which debt can influence dividend policy, the study uses the financial leverage ratio defined as the ratio of total short-term and long-term debt to total shareholders’ equity (DER). Based on the above discussion, a negative association is expected between dividends and financial leverage.
Evidence from emerging markets also supports the proposition that profitabil-ity is one of the most important factors that determines dividend policy. For example, Cahit Adaoglu (2000) found that a firm’s earnings are the main factor in determining dividend decisions in Turkey. Indra M. Pandey (2001) has arrived at a similar con-clusion for Malaysian firms. More recently, Aivazian, Booth, and Cleary (2003), in their study of the dividend policy of emerging market firms and US firms, demon-strated that profitability has a significant impact on dividend payouts for both sam-ples.
Since more than 50 percent of the observations recorded zero dividends, the Heckman selection test is performed on the significant variables of the Tobit regres-sion model to test for the any bias on the sample results. In addition, the Marginal Effects Tobit model specification is used to robustly check the significance of the other dividend policy measures (cash dividends (LogDIV) and dividend-to-total as-sets ratio (DIV/TA)) on the model. The general model is estimated using the Tobit specification, for firm i in the period (mathematical signs indicate the hypothesised impact on dividend policy as measured by dividend yield) can be written as:
DYLD = yo + y1STOCK – y2 AGENCY – y3OWN + y4GOVT +
+ y5ORG + y6 MBR + y7AGE+ y8SHATUR - y9DTAX - y10DER –
– y11CAP - y12EPS + - y12INDUST + ɛ
(1)
(The variables are explained in the Appendix.)
We tested for stationarity by performing a Unit Root Test on the AR(P) model
using the following model:
∆ = + ∑ ∆ + (2)
We augment the DF test by using 4 lags of the dependant variables on the null hypothesis:
Ho = Yt = Yt-1 + Ut (3)
3. Results and Discussion of Findings
3.1 Unit Roots Test Result
731
Determinants of Dividend Policy: Evidence from Listed Firms in the African Stock Exchanges
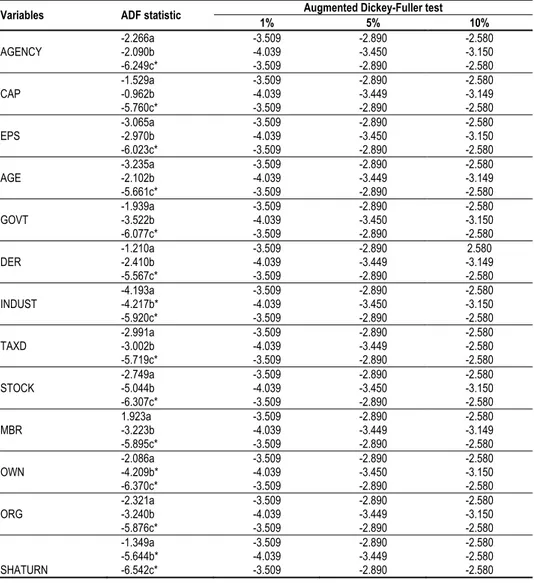
are also obtained with the inclusion of a trend (b) in the equations, with AGENCY, OWN, SATURN and CAP bearing non-stationary features at the three levels of sig-nificance. With the inclusion of a trend also AGE, TAX, EPS, INDUST, STOCK, ORG, DER, GOVT and MBR are all stationary at the three levels of significance. As expected in most macroeconomic data, all the variables are found to be stationary (and integrated to the order one) at their first differences at the three levels of signifi-cance.
Table 2 UnitRoot Tests on the Time Series
Variables ADF statistic Augmented Dickey-Fuller test
1% 5% 10%
AGENCY -2.266a -2.090b -6.249c* -3.509 -4.039 -3.509 -2.890 -3.450 -2.890 -2.580 -3.150 -2.580 CAP -1.529a -0.962b -5.760c* -3.509 -4.039 -3.509 -2.890 -3.449 -2.890 -2.580 -3.149 -2.580 EPS -3.065a -2.970b -6.023c* -3.509 -4.039 -3.509 -2.890 -3.450 -2.890 -2.580 -3.150 -2.580 AGE -3.235a -2.102b -5.661c* -3.509 -4.039 -3.509 -2.890 -3.449 -2.890 -2.580 -3.149 -2.580 GOVT -1.939a -3.522b -6.077c* -3.509 -4.039 -3.509 -2.890 -3.450 -2.890 -2.580 -3.150 -2.580 DER -1.210a -2.410b -5.567c* -3.509 -4.039 -3.509 -2.890 -3.449 -2.890 2.580 -3.149 -2.580 INDUST -4.193a -4.217b* -5.920c* -3.509 -4.039 -3.509 -2.890 -3.450 -2.890 -2.580 -3.150 -2.580 TAXD -2.991a -3.002b -5.719c* -3.509 -4.039 -3.509 -2.890 -3.449 -2.890 -2.580 -2.580 -2.580 STOCK -2.749a -5.044b -6.307c* -3.509 -4.039 -3.509 -2.890 -3.450 -2.890 -2.580 -3.150 -2.580 MBR 1.923a -3.223b -5.895c* -3.509 -4.039 -3.509 -2.890 -3.449 -2.890 -2.580 -3.149 -2.580 OWN -2.086a -4.209b* -6.370c* -3.509 -4.039 -3.509 -2.890 -3.450 -2.890 -2.580 -3.150 -2.580 ORG -2.321a -3.240b -5.876c* -3.509 -4.039 -3.509 -2.890 -3.449 -2.890 -2.580 -3.150 -2.580 SHATURN -1.349a -5.644b* -6.542c* -3.509 -4.039 -3.509 -2.890 -3.449 -2.890 -2.580 -2.580 -2.580
Notes: * Significance at 1, 5, 10 degree confidence levels. Variables with (a) represent the results of the unit root test with constant included in the test equation; those with (b) show results with the inclusion of trend in the test equation; and those with (c) indicate results from testing with first difference. Augmented Dickey Fuller (ADF) tests are significant if their respec-tive calculated absolute values are greater than their critical values, at respecrespec-tive levels of significance.
732 Matthias Nnadi, Nyema Wogboroma and Bariyima Kabel
The above results are consistent with general expectation as macroeconomic data are in most cases non-stationary at their levels. Therefore, differentiating the data to achieve stationarity makes some statistical meaning as trends in the dividend can result in the expectation of future performance of the firm (Michael J. Seiler 2004).
3.2 Descriptive Statistics
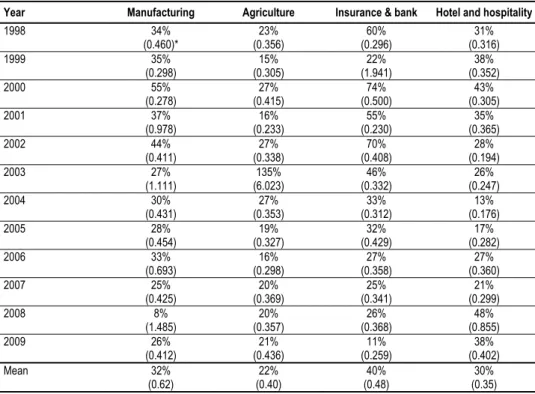
Table 3 shows the dividend payout ratios by sector for the period 1998-2009. Note that the manufacturing sector has the highest average mean percentage cash divi-dends of 32% and yield of 0.62. The agricultural firms have the lowest mean payout ratio of 22% with a dividend yield of 0.40 respectively. The banking and insurance sector have a record of high dividend payouts. The reported high dividend in the sec-tor may be attributed to the growing operational and economic activities undertaken during the period in the sector. For instance, several bank mergers and acquisitions have taken place in the region, most of which have been acquired by foreign and in-ternational firms. The agricultural and other allied industries have remained very much under developed on the continent.
Table 3 Average Mean of Dividend Payout and Yield Ratios by Sector, 1989-2009
Year Manufacturing Agriculture Insurance & bank Hotel and hospitality
1998 34%
(0.460)* 23% (0.356) 60% (0.296) 31% (0.316)
1999 35%
(0.298) 15% (0.305) 22% (1.941) 38% (0.352)
2000 55%
(0.278) 27% (0.415) 74% (0.500) 43% (0.305)
2001 37%
(0.978) 16% (0.233) 55% (0.230) 35% (0.365)
2002 44%
(0.411) 27% (0.338) 70% (0.408) 28% (0.194)
2003 27%
(1.111) 135% (6.023) 46% (0.332) 26% (0.247)
2004 30%
(0.431) 27% (0.353) 33% (0.312) 13% (0.176)
2005 28%
(0.454) 19% (0.327) 32% (0.429) 17% (0.282)
2006 33%
(0.693) 16% (0.298) 27% (0.358) 27% (0.360)
2007 25%
(0.425) 20% (0.369) 25% (0.341) 21% (0.299)
2008 8%
(1.485) 20% (0.357) 26% (0.368) 48% (0.855)
2009 26%
(0.412) 21% (0.436) 11% (0.259) 38% (0.402)
Mean 32%
(0.62) 22% (0.40) 40% (0.48) 30% (0.35)
Notes: * Figures in parentheses are the average yield while the others are the mean payout ratio.
Source: Compiled by the authors.
in-733
Determinants of Dividend Policy: Evidence from Listed Firms in the African Stock Exchanges
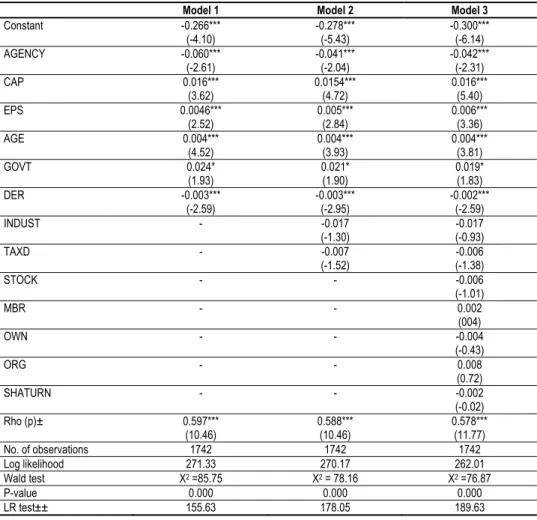
cluded taking a value of one if a firm belongs to the insurance or banking sectors, and zero otherwise (that statistic is 85.75 with a P-value of 0.000, indicating that the explanatory power of the model is significant beyond the 1 percent level). The over-all significance of the model was tested using the Wald test.
The Table 4 shows the result of the random effects Tobit model using the maximum likelihood estimation. It is represented in three models in which dividend policy is measured by the dividend yield (DYLD). The coefficient results are re-ported and the t-statistics are shown in parentheses. Model 3 includes thirteen vari-ables and encompasses all of the models, with 1742 firms’ observations. Only stock exchanges with at least 50 listed firms are included.
Table 4 Result of the Tobit Regression Model(Dependent variable = Dividend yield)
Model 1 Model 2 Model 3
Constant -0.266*** (-4.10)
-0.278*** (-5.43)
-0.300*** (-6.14) AGENCY -0.060***
(-2.61)
-0.041*** (-2.04)
-0.042*** (-2.31) CAP 0.016***
(3.62)
0.0154*** (4.72)
0.016*** (5.40) EPS 0.0046***
(2.52)
0.005*** (2.84)
0.006*** (3.36) AGE 0.004***
(4.52)
0.004*** (3.93)
0.004*** (3.81)
GOVT 0.024*
(1.93)
0.021* (1.90)
0.019* (1.83) DER -0.003***
(-2.59)
-0.003*** (-2.95)
-0.002*** (-2.59)
INDUST - -0.017
(-1.30)
-0.017 (-0.93)
TAXD - -0.007
(-1.52)
-0.006 (-1.38)
STOCK - - -0.006
(-1.01)
MBR - - 0.002
(004)
OWN - - -0.004
(-0.43)
ORG - - 0.008
(0.72)
SHATURN - - -0.002
(-0.02) Rho (p)± 0.597***
(10.46)
0.588*** (10.46)
0.578*** (11.77)
No. of observations 1742 1742 1742
Log likelihood 271.33 270.17 262.01
Wald test X2=85.75 X2= 78.16 X2=76.87
P-value 0.000 0.000 0.000
LR test±± 155.63 178.05 189.63
Notes: *, **, *** significant at 10, 5 and 1 percent levels, respectively; t-statistics are shown in parentheses; ± the proportion of the total variance contributed by panel level variance component; ±±LR test denotes the likelihood ratio test, which pro-vides a test for pooled (Tobit) estimator against the random effects panel estimator.
734 Matthias Nnadi, Nyema Wogboroma and Bariyima Kabel
The regression result shows that the agency cost variable STOCK is not sig-nificantly different from zero, indicating that ownership dispersion does not appear to influence dividend policy in listed African firms. AGENCY is negative and statisti-cally significant at the 1 percent level. These results remain consistent throughout the models. This indicates that insider ownership is an important determinant of corpo-rate dividend policy among African firms. Firms with a higher proportion of insider ownership are likely to be persuaded to engineer a policy that the insider owners, such as the directors, find most suitable. This is consistent with Thomas K. Gugler (2003), which examined a panel of 214 Austrian firms over the period 1991-1999 and concluded that a firm’s ownership and control structure significantly affects its dividend policy. Mark Leary and Roni Michaely (2011) also add that less financial constraint firms are more susceptible to agency conflicts.
Along with STOCK, the two ownership dummies, OWN (family ownership) and ORG (institutional ownership), as well as MBR and SHATURN, were all dropped from the model. However, the existence of the government or its agencies as a con-trolling shareholder seems to influence the level of dividends paid. The positive sig-nificant relationship between dividend yield and GOVT is consistent with the asser-tion that state-controlled firms tend to pay more dividends. The share turnover ratio (SHATURN) is used as a proxy for information asymmetry which is negative and therefore does not provide support for the signalling hypothesis. One possible expla-nation for this result is that the proxy for information asymmetry is weak.
MBR and AGE are used as proxies for growth and investment opportunities. The coefficient of MBR is positive and insignificant, whereas, as predicted, the coef-ficient of AGE is positive and significantly different from zero. These findings indi-cate that the market-to-book value ratio does not affect dividend yield, while firm age is positively related to dividend yield. The positive coefficient on MBR is comparable to that reported by Aivazian, Booth, and Cleary (2003) for emerging markets. These results are consistent with the prior research of RonnyManos and Christopher Green (2001), who found that the age of the firm and the payout level are positively related. The t-statistics of the coefficients on market capitalisation (CAP) for models 1, 2 and 3 are 5.34, 3.62, and 4.72, respectively, which are highly significant at the 1 percent level. The effect of market capitalisation may vary with countries and continents. Mo Azeem, Zeeshan Akbar, and Ahmad Usman (2011) contend that the dividend deci-sions of listed firms in Pakistan are independent of their growth which varies with Turkish firms (Maury and Pajuste 2002).
The coefficients on debt-to-equity ratio (DER) are negative and statistically significant at the 5 and 1 percent levels. The t-statistics of the coefficients on DER
735
Determinants of Dividend Policy: Evidence from Listed Firms in the African Stock Exchanges
These results demonstrate that listed firms performance have greater level of efficiency in relation to their stock performance as measured by their earnings. Stud-ies such as Fotios Pasiouras, Aggelikki Liadaki, and Constantin Zopunidis (2008), Sailesh Tanna, Pasiouras, and Nnadi (2011) have established similar results. A recent study by Saadet Kasman and Adnan Kasman (2011) on the performance of Turkish listed banks supports the argument that stock markets performance is intrinsically link with such performance measures as technical, scale and productivity efficien-cies.
The tax variable (TAXD), takes a value of one for the years 1998-2009 (post-tax period), zero otherwise. The implementation of a basic (post-tax rate on dividends seems to have had no significant influence on corporate dividend policy. The IN-DUST result shows that the dividend policy of the firms is not affected by the type of industry. Firms operating in a low tax environment and with less institutional con-straints will enjoy a distinctive dividend policy (Fabio Braggion and Lyndon Moore 2011).
3.3 Further Check
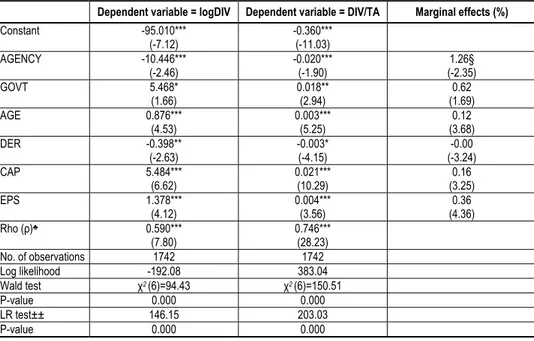
Further checks are performed to robustly check the results obtained earlier. The sig-nificant variables in the Tobit regression are re-estimated by substituting the dividend yield with cash dividends (LogDIV) and dividend-to-total assets ratio (DIV/TA), which are other measures of dividend policy. This will provide invaluable proof of any sensitivity of the result to other measures of dividend policy. More importantly, it eliminates the associated criticism of yield as dividend policy measure (Fama and French 2002).
The results are presented in Table 5 and are consistent with those obtained us-ing the dividend yield (DYLD) as a dependent variable. The Wald test for LogDIV
model is 93.03 and 150.52 for DIV/TA model, indicating that the overall explanatory power of both models using LogDIV or DIV/TA is used as a dependent variable, is significant.
The estimation results show that GOVT, AGE, CAP and EPS have a positive effect on the dividend policy of listed African firms. In both models, the coefficients of those variables are significant at the 1 percent level, with the exception of GOVT
at the 10 percent level in LogDIV model. This indicates that large, profitable, and mature firms with low growth options tend to pay higher levels of dividends. It sug-gests that government-controlled firms tend to have higher payout ratios. A more regulated stock market will be more efficient and reliable (Radonjić and Zec 2010). The variables AGENCY and DER are significant at the 5 and 10 percent levels in the
736 Matthias Nnadi, Nyema Wogboroma and Bariyima Kabel
Table 5 TobitEstimation: Further Check Using Other Dividend Policy Variables
Dependent variable = logDIV Dependent variable = DIV/TA Marginal effects (%)
Constant -95.010*** (-7.12)
-0.360*** (-11.03) AGENCY -10.446***
(-2.46)
-0.020*** (-1.90)
1.26§ (-2.35) GOVT 5.468*
(1.66)
0.018** (2.94)
0.62 (1.69) AGE 0.876***
(4.53)
0.003*** (5.25)
0.12 (3.68) DER -0.398**
(-2.63)
-0.003* (-4.15)
-0.00 (-3.24) CAP 5.484***
(6.62)
0.021*** (10.29)
0.16 (3.25) EPS 1.378***
(4.12)
0.004*** (3.56)
0.36 (4.36) Rho (ρ)♣ 0.590***
(7.80)
0.746*** (28.23) No. of observations 1742 1742 Log likelihood -192.08 383.04 Wald test χ2 (6)=94.43 χ2 (6)=150.51
P-value 0.000 0.000
LR test±± 146.15 203.03
P-value 0.000 0.000
Notes: *, **, *** significant at 10, 5 and 1 percent levels, respectively; t-statistics are parentheses; ± the proportion of the total variance contributed by panel level variance component; LR test ±± denotes the likelihood ratio test, which provides a test for pooled (Tobit) estimator against the random effects panel estimator. ♣Proportion of panel variance. §Marginal effects
contributions and t-statistics in parentheses.
Source: Results obtained by the authors.
The age of the firm (AGE) seems to influence DYLD but only marginally. Re-call that this variable was designed to proxy for growth and investment opportunities. Mature firms with less growth and investment opportunities tend to pay more divi-dends. As a firm becomes one year older, the estimated increase in DYLD is 0.117 percent.
Firm size as measured by market capitalisation, is positively related to DYLD
with marginal effects of 0.480 percent. If, for example, a firm’s market capitalisation increases from US$10 million to US$ 15 million, the expected increase in its DYLD
would be 0.195 percent. In relation to a firm’s capital structures, financial leverage (DER) is negatively related to dividend yield. If a firm’s financial leverage increases by 1 percent, the estimated decrease in dividend yield is 0.066.
3.4 Henchman Selection Test
737
Determinants of Dividend Policy: Evidence from Listed Firms in the African Stock Exchanges
Y* = β1 + β2X + μ (4)
Y = Y* if Y* > 0 (5)
Y = 0 if Y*0 (6)
In the Tobit model, the values of the regressors and the disturbance term de-termine whether or not a firm falls into the participating category (Y > 0) or the non-participating category (Y = 0).
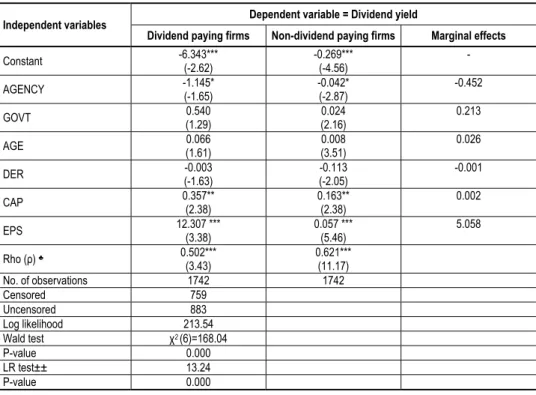
The results obtained in Table 6 justify the inclusion of both paying and non-dividend paying firms in our regression model. The AGENCY, CAP, and EPS vari-ables are consistently significant in both samples.
Table 6 Henchman Selection Test on Tobit Regression
Independent variables Dependent variable = Dividend yield
Dividend paying firms Non-dividend paying firms Marginal effects
Constant -6.343*** (-2.62)
-0.269*** (-4.56)
-AGENCY -1.145*
(-1.65)
-0.042* (-2.87)
-0.452
GOVT 0.540
(1.29)
0.024 (2.16)
0.213
AGE 0.066
(1.61)
0.008 (3.51)
0.026
DER -0.003
(-1.63)
-0.113 (-2.05)
-0.001
CAP 0.357**
(2.38)
0.163** (2.38)
0.002
EPS 12.307 ***
(3.38)
0.057 *** (5.46)
5.058
Rho (ρ) ♣ 0.502***
(3.43)
0.621*** (11.17) No. of observations 1742 1742
Censored 759
Uncensored 883 Log likelihood 213.54 Wald test χ2 (6)=168.04
P-value 0.000
LR test±± 13.24
P-value 0.000
Notes: *, **, *** significant at 10, 5 and 1 percent levels, respectively; t-statistics are parentheses; ± the proportion of the total variance contributed by panel level variance component; LR test ±± denotes the likelihood ratio test, which provides a test for Henchman estimator. ♣Proportion of panel variance and t-statistics in parentheses.
Source: Results obtained by the authors.
4. Conclusion
738 Matthias Nnadi, Nyema Wogboroma and Bariyima Kabel
also found that a firm’s financial leverage has a significant negative effect on its dividend policy. This effect is present in the amount of dividends as tested with the Tobit model. Corporate governance tends to be dominated by inside ownership such that the minority shareholders are not able to exert much influence on dividend pol-icy, and where the degree of outside ownership will often, therefore, not be of much significance. Using the ADF unit root test technique, the study showed that most of the time series data used are non-stationary at their respective levels, but stationary at their respective first differences.
The results also show that the proportion of total shares held by insiders, the second proxy for the agency costs hypothesis, has a negative impact on the level of dividends paid. That is, insider ownership seems to have an impact on the size of dividends, but not necessarily on the decision to pay them. Similarly, the existence of government, or its agencies, in a firm’s ownership structure is found to positively affect its dividend policy. Government controlled firms are synonymous with the high and regular dividend payments in Africa. This is also consistent with the double agency costs notion of government ownership, where the state is also the agent for citizens/taxpayers (Kent H. Baker, Gary E. Powell, and Theodore E. Veit 2002). Other variables of ownership structure seem to have no significant influence on divi-dend policy. Taken together with ownership dispersion, these results provide mixed support for the agency costs hypothesis of dividend policy in listed African firms.
The results show that the firm’s age is positively related to its dividend policy. The age of the firm is found to be an important determinant of the decision to pay dividends. These results demonstrate that mature firms with less growth and invest-ment opportunities are more likely to pay dividends, which is consistent with the ma-turity and free cash flow hypothesis. This finding indicates that the level of financial leverage inversely affects the dividend decision. The finding agrees with Rakesh Bali (2003), who asserts that the firm’s debt-equity level plays an important role in its dividend policy. The intuition here is that high levels of tangible assets in a firm’s asset structure will increase debt capacity and therefore, allow them to rely less heav-ily on retained earnings.
739 Determinants of Dividend Policy: Evidence from Listed Firms in the African Stock Exchanges
References
Adaoglu, Cahit. 2000. “Instability in the Dividend Policy of the Istanbul Stock Exchange
(ISE) Corporations: Evidence from an Emerging Market.” Emerging Market Review, 1(3): 252-270.
Aivazian, Varouj, Laurence Booth, and Sean Cleary. 2003. “Do Emerging Market Firms
Follow Different Dividend Policies From U. S. Firms?” The Journal of Financial Research, 26(3): 371-387.
Allen, Frankline, Antoniao E. Bernardo, and Ivo Welch. 2000. “A Theory of Dividend of
Based on Tax Clienteles.” Journal of Finance, 55(6): 2499-2537.
Ali, Ashiq. 2007. “Dividend Policy and Payout Ratio: Evidence from Kuala Lumpur Stock
Exchange.” Journal of Risk Finance, 8(4): 349-363.
Asamoah, Gordon N. 2010. “The Impact of Dividend Announcement on Share Price
Behaviour in Ghana.” Journal of Business and Economics Research, 8(4): 47-60.
Azeem, Mo, Zeeshan Akbar, and Ahmad Usman. 2011. “Investigating Compliance of
Dividend Policy with Firm Size: A Case of Karachi Stock Exchange Listed
Companies.” Interdisciplinary Journal of Contemporary Research in Business, 2(11): 263-273.
Baker, Kent H., Gary E. Powell, and Theodore E. Veit. 2002. “Revisiting the Dividend
Puzzle: Do All of the Pieces Now Fit?’’ Review of Financial Economics, 11(4): 241-261.
Bali, Rakesh. 2003. “An Empirical Analysis of Stock Returns Around Dividend Changes.”
Applied Economics, 35(1): 51-61.
Bishop, Stephen R., Crapp R. Harvey, Freeman W. Robert, and Twite J. Garry. 2000.
Corporate Finance. Sydney: Prentice Hall.
Braggion, Fabio, and Lyndon Moore. 2011. “Dividend Policies in an Unregulated Market:
The London Stock Exchange.” Review of Financial Studies, 24(9): 2935-2973.
Carvalhal-da-Silva, Andre, and Ricardo Leal. 2003. “Corporate Governance, Market
Valuation and Dividend Policy in Brazil.” Coppead Working Paper 390.
Deshmukh, Sanjay. 2003. “Dividend Initiations and Asymmetric Information: A Hazard
Model.” Financial Review, 38(3): 351-368.
Fama, Eugene F., and Kenneth French. 2002. “Testing Trade-Off and Pecking Order
Predictions About Dividends and Debt.” The Review of Financial Studies, 15(1): 1-33.
Gugler, Thomas K. 2003. “Corporate Governance, Dividend Payout Policy, and the
Interrelation between Dividends, R&D, and Capital Investment.” Journal of Banking and Finance, 27(7): 1297-1321.
Han, Kin C., Suk H. Lee, and David Y. Suk. 1999. “Institutional Shareholders and
Dividends.” Journal of Financial & Strategic Decision, 12: 53-62.
Kasman, Saadet, and Adnan Kasman. 2011. “Efficiency, Productivity and Stock
Performance: Evidence from the Turkish Banking Sector.” Panoeconomicus, 58(3): 355-372.
Kaufmann, Patrick J., Richard M. Gordon, and James E. Owers. 2000. “Alternative
Profitability Measures and Marketing Channel Structure: The Franchise Decision.” Journal of Business Research, 50(3): 217-224.
Leary, Mark, and Roni Michaely. 2011. “Determinants of Dividend Smoothing: Empirical
740 Matthias Nnadi, Nyema Wogboroma and Bariyima Kabel
Lease, Ronald C., Kose John, Avner Kalay, Uri Loewenstein, and Oded H. Sarig. 2000.
Dividend Policy: It’s Impact on Firm Value. Massachusetts: Harvard Business School Press.
Li, Kai, and Xinlei Zhao. 2008. “Asymmetric Information and Dividend Policy.” Financial
Management, 37(4): 673-694.
Manos, Ronny, and Christopher Green. 2001. “Business Group and Dividend Policy:
Evidence on Indian Firms.” Finance and Development Research Programme Working Paper 33.
Maury, Benjamin C., and Anete Pajuste. 2002. “Controlling Shareholders, Agency
Problems, and Dividend Policy in Finland.” The Finnish Journal of Business Economics, 51(1): 15-45.
Morgan, Gareth, and Stephen Thomas. 1998. “Taxes, Dividend Yields and Returns in the
UK Equity Market.” Journal of Banking and Finance, 22(4): 405-423.
Naceur, Samy Ben, and Mohammed Goaied. 2002. “The Relationship between Dividend
Policy, Financial Structure, Profitability and Firm Value.” Applied Financial Economics, 12(2): 843-849.
Nnadi, Matthias A., and Meg E. Akomi. 2008. “The Effect of Tax on Dividend Policy of
Banks.” International Research Journal of Finance and Economics, 19: 48-55.
Pandey, Indra M. 2001. “Corporate Dividend Policy and Behaviour: The Malaysian
Experience.” Indian Institute of Management Ahmedabad Working Paper 2001-11-01.
Pasiouras, Fotios, Aggelikki Liadaki, and Constantin Zopunidis. 2008. “Bank Efficiency
and Share Performance: Evidence from Greece.” Applied Financial Economics, 18(14): 1121-1130.
Radonjić, Ognjen, and Miodrag Zec. 2010. “Subprime Crisis and Instability of Global
Financial Markets.” Panoeconomicus, 57(2): 209-224.
Seiler, Michael J. 2004. Performing Financial Studies: A Methodological Cookbook. New
Jersey: Prentice Hall.
Short, Helen, Hao Zhang, and Kevin Keasey. 2002. “The Link between Dividend Policy
and Institutional Ownership.” Journal of Corporate Finance, 8(2): 105-122.
Taneem, Shania, and Ayse Yuce. 2011. “Information Content of Dividend Announcements:
An Investigation of the Indian Stock Market.” International Business & Economics Research Journal, 10(5): 49-57.
Tanna, Sailesh, Fotios Pasiouras, and Matthias Nnadi. 2011. “The Effect of Board Size
and Composition on the Efficiency of UK Banks.” International Journal of the Economics of Business, 18(3): 441-462.
Travlos, Nickoaos, Lenos Trigeorgis, and Nikos Vafeas. 2001. “Shareholder Wealth Effects
of Dividend Policy Changes in an Emerging Stock Market: The Case of Cyprus.” Multinational Finance Journal, 5(2): 87-112.
Wie, Gang, Zhang Weiguo, and Jason Z. Xiao. 2003. “Dividend Policy and Ownership
741
Determinants of Dividend Policy: Evidence from Listed Firms in the African Stock Exchanges
Appendix
Explanation of Variables
STOCK: The natural logarithm of the number of common stockholders of a
firm (measure of ownership dispersion).
AGENCY: The percentage of a firm’s stocks held by insiders.
OWN: Family ownership dummy equals one if an individual is the control-ling shareholder, and zero otherwise.
GOVT: Government ownership dummy equals one if the government, or one of its agencies, is the controlling shareholder, and zero other-wise.
ORG: Organisational or institutional dummy equals one if an institution
(financial or non-financial corporation) is the controlling sharehold-er, and zero otherwise.
SHATURN: Share turnover ratio: the ratio of the number of shares traded at the
end of the year.
MBR: Market-to-book-value ratio: the ratio of a firm’s market value per
share (MPS) to its book value per share (BVS).
AGE: Firm’s age, which is calculated as the difference between the
calen-dar year at t and the establishment date of the firm.
CAP: Natural logarithm of market capitalisation.
DER: Debt-to-equity ratio: the sum of total short-debt and total long-term debt, to total shareholders’ equity.
EPS: Earnings per share: the net income after taxes (NIAT) divided by the number of shares of common stock outstanding.
TAXD: Tax dummy equals one for the years 1998-2009.
INDUST: Non-financial companies dummy equals one if the firm belongs to
742 Matthias Nnadi, Nyema Wogboroma and Bariyima Kabel