University, Ramat Aviv, Tel Aviv, 69978, Israel
Received: 8 November 2006 – Revised: 15 December 2006 – Accepted: 15 December 2006 – Published: 10 January 2007
Abstract. A precipitation event of unprecedented intensity took place over northern part of Israel during 4 December 2001–5 December 2001. The case was associated with for-mation of a Cyprus Low cyclone over the Asia Minor. In the current study the synoptic developments over the east-ern part of the Mediterranean region are simulated with the MM5 nonhydrostatic model and analyzed based on dynamic tropopause patterns calculated from the simulation results. According to the results, a powerful potential vorticity (PV) streamer system played a major role in the process over the southeastern Mediterranean region. The PV streamer created conditions for seclusion of moist air masses from the equa-torial East Africa and Atlantics during the cyclone develop-ment. Condensation of the moisture, associated with the la-tent heat release processes have contributed to the intense thunderstorm activity and heavy precipitation of the event.
1 Introduction
Torrential rains fell over Israel during the period from 00:00 UTC, 4 December 2001 to 00:00 UTC 5 Decem-ber 2001. The rains (up to 250 mm, about 200 mm dur-ing the 01:00 UTC–07:00 UTC time interval of 4 Decem-ber 2001) were observed over a narrow coastal zone in the northern part of the country (∼32.5◦N; 34.7◦E). No
compa-rable rainfall intensity has ever been recorded over the area which is characterized by mean annual precipitation of about 650 mm. Rains also fell over the other parts of the country, though their intensity was decreasing southwards. The rains were associated (Krichak et al., 2004, hereafter KAD) with a “Cyprus Low” (CL) cyclone (El-Fandy, 1946; Kallos and Metaxas, 1980,) which acted over the eastern Mediterranean area during 2 December 2001–5 December 2001.
Correspondence to: S. O. Krichak
The data available demonstrate a powerful synoptic pro-cess characterized by merging of the polar and subtropical upper-tropospheric jet streams over the Mediterranean re-gion. The process was associated with the formation of a mesoscale convective complex (MCC; Caracena et al., 2001; Cotton, 1990; Maddox, 1980) and its further trans-formation into a cyclone under the left-front part of the jet stream system. Location of the area with the cyclone de-velopment allows attributing the process to the effects of a quiasi-geostrophic imbalance between the pressure gradient and Coriolis forces (Bjerknes, 1951; Keyser and Shapiro, 1986; Uccellini, 1980; Uccellini and Kocin, 1987; Pyle et al., 2004). The explanation is insufficient however for un-derstanding the unprecedented intensity of the precipitation event.
In this paper the evolution of synoptic processes during 3 December 2001–5 December 2001 is analyzed based on the data from the NCAR/NCEP reanalysis archive as well as Meteosat water vapor imageries. Additionally, a hydrody-namic model simulation of the synoptic event is performed. The model produced data are adopted for a higher resolution evaluation of the period. The analysis is complemented by an evaluation of dynamic tropopause maps calculated from the results of the model simulation.
2 Major large-scale synoptic developments
The data from the National Center for Environmental Pre-diction/National Center for Atmospheric Research Reanal-ysis Project (NNRP) archive (Kalnay et al., 1996; Kistler et al., 2001) are adopted for synoptic evaluation of the pro-cesses that took place during 3 December 2001–5 December 2001 over the eastern part of the Mediterranean region. The NNRP data are derived through a consistent assimilation and forecast model procedure, which allows the incorporation of all available observation data. The NNRP data assimilation system includes the T62/28-level global spectral model with horizontal resolution of about 210 km. The reanalysis data are available with 2.5◦ lat × 2.5◦ lon horizontal spacing. KAD has demonstrated the reliability of the NNRP data for understanding the relevant weather processes happening be-tween the end of November and the beginning of December 2001.
2.1 Lower-troposphere processes
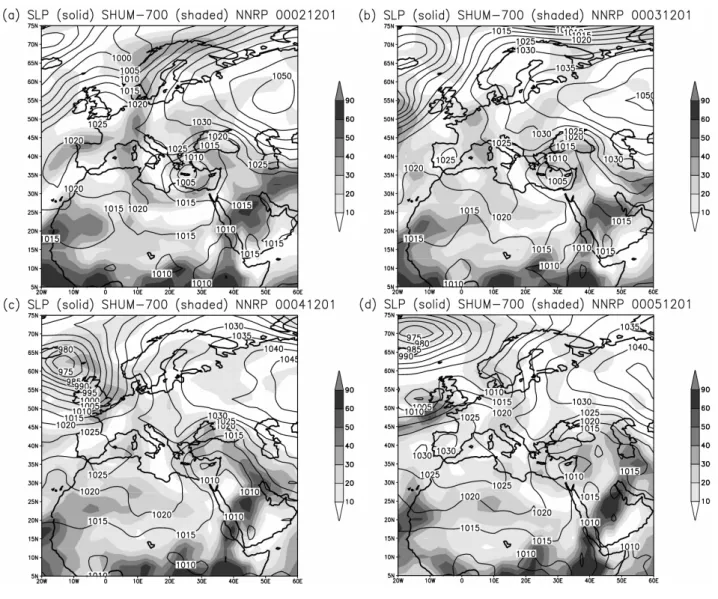
The NNRP-based sea level pressure (SLP) and 700 hPa specific humidity (SHUM) patterns over Europe and the Mediterranean region at 00:00 UTC, from 2 December 2001 to 5 December 2001 are presented in Figs. 1a–d, respectively. In Fig. 1a at 00:00 UTC 2 December 2001 an intense moist advection from the Scandinavian and Alpine regions in the direction of the Mediterranean region may be noted. Another moist-air zone over the Arabian Peninsula links the Mediter-ranean area with the equatorial east-Africa. Formation of a Red Sea Trough (RST) (Krichak et al., 1997a, b; Krichak and Alpert, 1998; Ziv et al., 2004) may be also noted. Large amounts of moist air are found around in the Mediterranean cyclone, which is located over Crete (minimum pressure of 1005 hPa). High SLP values and an unusually western po-sition of the Siberian anticyclone which is connected to the Azorean High may be also noted. The high-pressure belt sep-arates the two areas (over the northern Atlantic and eastern Mediterranean regions) with active cyclone developments.
At 00:00 UTC 3 December 2001 (Fig. 1b) a Mediterranean cyclone belonging to a well developed RST system is found near Cyprus. The moist-air transport to the area over Eu-rope and the Arabian Peninsula is in progress. The role of the southern branch of the moist air transport appears to be playing the main role in the process. Significant amounts of moist air from equatorial Africa are found here directed to the cyclone over Arabian Peninsula and the Middle East. Orientation of the moist-air zone as well as NNRP precipita-tion maps (not presented), allow assuming an important role of the latent heat release effects (Reed et al., 1992; Whitaker et al., 1988) in the Mediterranean cyclogenetic process. An eastward displacement of the Siberian anticyclone as well as deepening of the cyclone pressure (985 hPa) in the north-western part of the pattern indicate an increased interaction
between the processes in the Mediterranean area with those over the northern Atlantics.
According to Fig. 1c the earlier noted tendency has strengthened during the following 24 h. A decay and east-ward displacement of the Siberian High (1045 hPa) may be noted. The eastern Mediterranean cyclone (1005 hPa) is ap-proaching Cyprus. A large zone with the moist air from the equatorial Africa is also approaching the cyclone from the southeast. A well developed large scale trough is linking the area over the Arabian Peninsula with that to the west of the British Islands where a deep cyclone (975 hPa) is found. The conditions are favorable for precipitation in Israel.
At 00:00 UTC 5 December 2001 (Fig. 1d) the zone with high concentration of the moist air of African origin is found separated from the CL system (central pressure of 1010 hPa). Significant amounts of moist air are already concentrated in the area.
2.2 Upper-troposphere developments
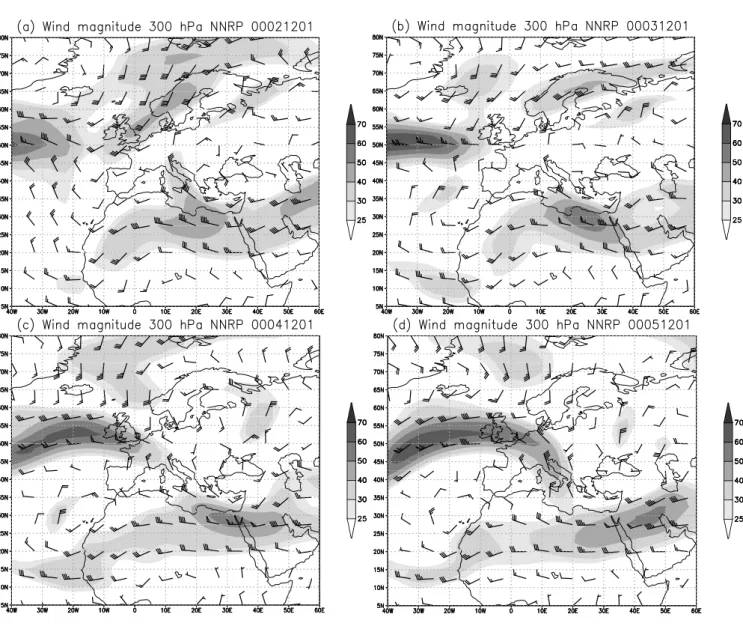
The wind magnitude fields in the upper-troposphere (300 hPa) over the eastern part of the northern Atlantic, west-ern European and North Africa regions during the 2 Decem-ber 2001–5 DecemDecem-ber 2001 are presented in Figs. 2a–e at 00:00 UTC of each of the days, respectively.
The upper-troposphere winds at 00:00 UTC 2 December 2001 (Fig. 2a) demonstrate collision of the Polar and Sub-tropical jet streams (PJS and STJ) over the central Mediter-ranean – North Africa region. A narrow PJS zone with iso-lated wind maximum (40 m s−1)over the central Mediter-ranean region links the area with that over Scandinavian Peninsula. The discussed above (Fig. 1a) eastern Mediter-ranean cyclogenetic development takes place under the left-front quadrangle of the PJS wind maximum.
The area with the wind maximum at the STJ (50 m s−1)is located over the northern part of the Persian Gulf area. At 00:00 UTC 3 December 2001 (Fig. 2b) a significant intensi-fication of the STJ (more than 50 m s−1)may be noted over the North Africa coastal area of the eastern Mediterranean region. The intensification appears to be a consequence of merging of the PJS wind maximum with the STJ. Accord-ing to the earlier evaluations (Krichak et al., 1997a, b) such situations are favorable for the RST formation processes.
At 00:00 UTC 4 December 2001 (Fig. 2c) the zone with the STJ maximum (50 m s−1)over the south-eastern Mediter-ranean is situated westward of the Red Sea area. The zone with the STJ is linked with another high wind magnitudes zone (up to 70 m s−1)over the eastern Atlantics.
−
Fig. 1. Sea Level Pressure (hPa, solid lines), and 700 hPa specific humidity (g kg−1, shading) over Europe at 00:00 UTC (a) 2 December 2001, (b) 3 December 2001, (c) 4 December 2001, (d) 5 December 2001.
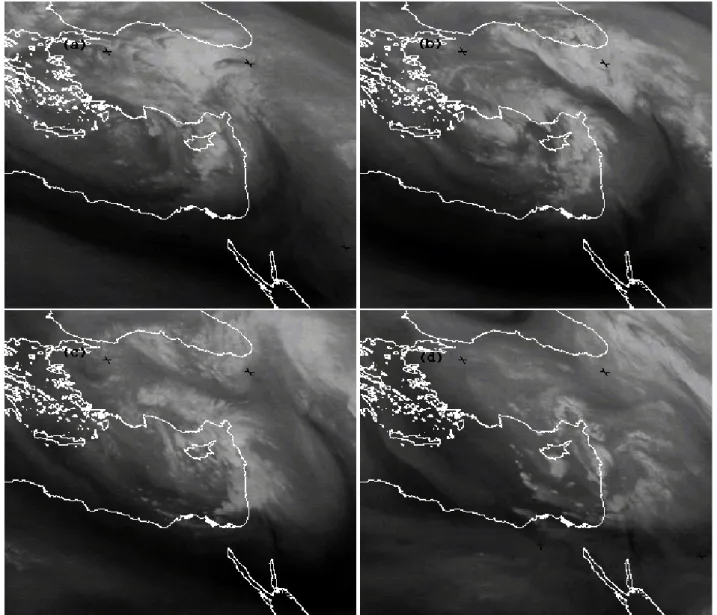
2.3 Representation of the process in WV imageries An important additional information on the eastern Mediter-ranean upper-troposphere developments of the period is available from the Meteosat Water Vapor (WV) imageries (© Eumetsat 2003) given in Figs. 3a–d at (a) 12:00 UTC 3 December 2001; (b) 00:00 UTC 4 December 2001 (c) 12:00 UTC 4 December 2001; (d) 00:00 UTC 5 December 2001. The imageries are based on a band of emission by water vapor – hence regions of high upper-tropospheric hu-midity appear in the imageries as white zones whereas dark zones represent those with low humidity.
An extended dry zone situated along the southern coastal area of the eastern part of the Mediterranean region may be noted to the east of Greece (hereafter EM) in the in Fig. 3a at 12:00 UTC 3 December 2001. Another northward oriented dry-air zone is also found over the area. A moist air mass
zone is situated over the area extending from Cyprus to the Black Sea. On the following picture at 00:00 UTC 4 Decem-ber 2001 (Fig. 3b) the moist air zone over Cyprus is already almost separated from another moist zone to the southeast of the Black Sea. In 12 h, at 12:00 UTC 4 December 2001 (Fig. 3c) the zone with the moist air is already situated along the EM coastal zone. Almost no signs of the dry zone are found over the region in Fig. 3d at 00:00 UTC 5 December 2001.
Fig. 2. Wind magnitude (contour interval 10 m s−1)at the 300 hPa isobaric surface over Europe at 00:00 UTC (a) 2 December 2001, (b) 3 December 2001, (c) 4 December 2001, (d) 5 December 2001.
3 Simulation with MM5
As was demonstrated before the rainy event of 4 December 2001–5 December 2001 took place as a result of condensa-tion of high amount of the air moisture during the intense mesoscale development over the northern Mediterranean re-gion. The process was clearly forced by the effects of the upper-troposphere jet streams.
It has been demonstrated (Krichak et al., 2007) that the developments have been associated with a strong synoptic process in the upper-troposphere over the northern Atlantics associated with development of a coherent tropopause dis-turbance. A numerical simulation of the synoptic event has been performed to investigate the role of the process over the Mediterranean region. The experiment’s plan was based on the assumption that a successful simulation of the Israeli
pre-cipitation event requires an accurate representation of the ob-served upper-troposphere developments. In accordance with the suggestion the main focus in the following evaluation of the simulation results is made on the understanding them in comparison with the Meteosat WV imageries.
3.1 Hydrodynamic model
Fig. 3. Meteosat-7 (© Eumetsat 2003) water vapor imageries at (a) 12:00 UTC 3 December 2001, (b) 00:00 UTC 4 December 2001, (c) 12:00 UTC 4 December 2001, (d) 00:00 UTC 5 December 2001.
1976). The sigma terrain-following coordinate is used to represent the vertical structure of the atmosphere for the model characteristics. The model allows one- and two-way interactive multiple nesting during the model runs.
3.2 Experiment design
Several 48-h simulations of the case have earlier been real-ized using different MM5 configurations (Dayan, 2003). All these model runs were initiated at 00:00 UTC, 3 December 2001. A notable sensitivity of the simulation results to the space resolution has been revealed. In accordance with the conclusion a high-resolution model simulation of the event is performed.
Table 1. MM5 configuration.
Number of points 73×73 85×67 127×100
Resolution (km) 45 15 5 Number of layers 37 37 37 MPHYS Simple ice Simple ice Simple ice ICUPA Betts-Miller Grell Kain-Fritch IBLTYP Eta Mellor Yamada MRF MRF FRAD Rapid Radiative Transfer Model 0 0
ISOIL Multi-layer Multi-layer Multi-layer
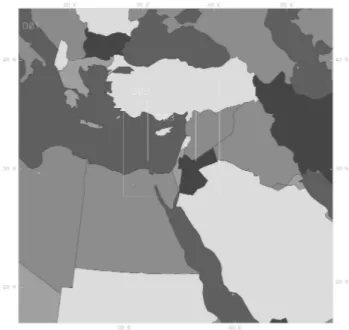
Fig. 4. Domain configuration for MM5 simulation.
The atmosphere in the simulation experiment was repre-sented by 37 layers with the model top at the 70 hPa, with the lowest 1500 m having 13 layers. The adopted model pa-rameters are given in Table 1.
3.3 Initial data
Numerical weather forecast data from the Global Forecast System (GFS) at the NCEP are routinely used for high-resolution mesoscale weather prediction at Tel Aviv Uni-versity (TAU) Weather Research Center using a mesoscale model version of the MM5 having 60 and 20 km space res-olution. The GFS spectral model (to the end of 2001) had the T170L42 spectral space resolution (∼75 km), 42 levels
in vertical and the model top at 2 hPa.
A subset with the GFS forecast data for the period from 00:00 UTC, 3 December 2001 to 00:00 UTC 5 December 2001, with the six-hour time increment was available for the simulations at TAU. The data set covered the area which
in-cluded Europe and the Mediterranean region. The surface, soil temperature and humidity data, as well as those at 13 standard isobaric levels (1000, 850, 700, 600, 500, 400, 300, 250, 200, 150, 100 and 70 hPa) were defined with 1.25 deg lat×lon resolution. No additional assimilation of the
obser-vation data over the region of interest has been performed.
4 Synoptic evaluation of results
4.1 Precipitation
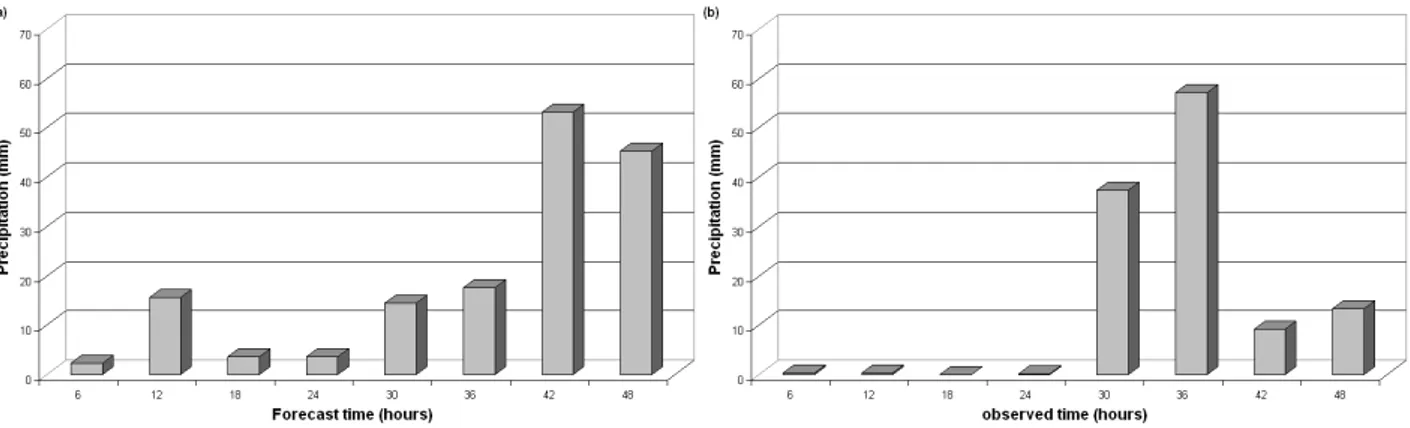
Six-hourly data on the model-simulated and observed precip-itation intensities over the area of Zichron Yaakov are given in Figs. 5a–b, respectively. Thought the model predicts the highest precipitation intensity about 12 h later than really ob-served, the simulated precipitation intensities are in reason-able agreement with the observations. It should be noted that the simulated maxima of precipitation rates (52 mm six-hours−1) are 8–10 times higher than those produced (not presented) with the coarse resolution MM5 version at TAU (Dayan, 2003).
4.2 Low-troposphere developments
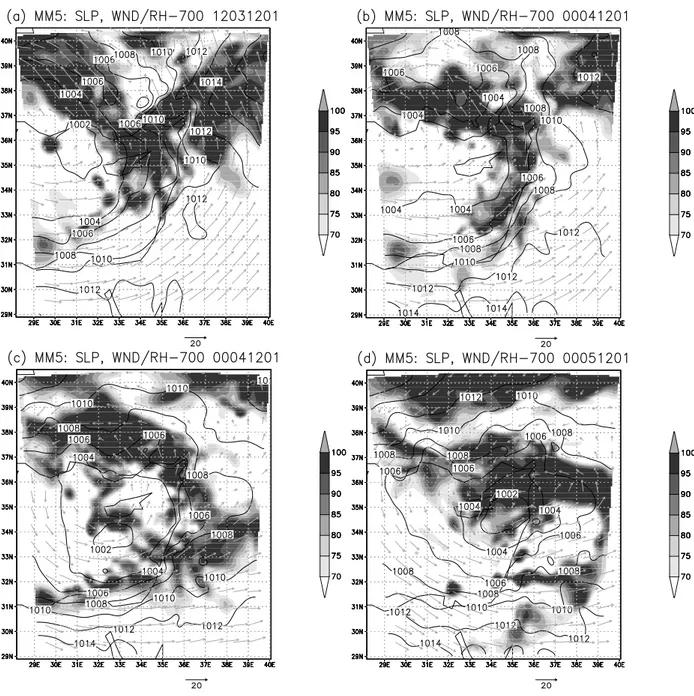
The SLP, wind and relative humidity (RH) at 700 hPa pat-terns over the second (15 km) model domain at 12:00 UTC, 3 December 2001, 00:00 UTC and 12:00 UTC, 4 Decem-ber 2001 and 00:00 UTC, 5 DecemDecem-ber 2001, are presented in Figs. 6a–d, respectively. The synoptic process is on its early stage at 12:00 UTC 3 December 2001 (Fig. 6a). De-velopment of a mesoscale trough system may be noted. The trough is already well-formed at 00:00 UTC, 4 December 2001 (Fig. 6b). It intrudes into the Israeli coastal zone along 32.5◦N at about 12:00 UTC, 4 December 2001 (Fig. 6c). A further propagation of the trough to southeast may be seen in Fig. 6d at 00:00 UTC 5 December 2001.
Fig. 5. Precipitation in Israel Zichron Yaakov starting from 00:00 UTC 3 December 2001 to 00:00 UTC 05 December 2001 (mm 6 h−1). (a) model-simulation results, (b) observed.
in the cyclonic system. In Fig. 6b at 00:00 UTC 4 Decem-ber 2001 the situation is different and the high RH zone over NE Mediterranean area is splitted to two parts with one of them included in the cyclone system. At 12:00 UTC 4 De-cember 2001 the central pressure in the CL to the south of Cyprus equals 1002 hPa (Fig. 6c). The high RH zones are fully separated. One of the moist-air zones is leaving the model domain area in the northeast whereas the second one is found as a narrow band positioned in the vicinity of the cyclone center. In Fig. 6d, at 00:00 UTC, 5 December 2001, the cyclone with the central pressure of 1002 hPa is situated to the south of Cyprus over a narrow zone between Cyprus and the coastal EM. The main area with the high RH values is found over the northern EM. Another part of the high RH zone covers the area of the northern Israel.
5 Dynamic tropopause analysis
5.1 Methodology
Analyses of the jet stream associated cyclone developments in the extra-tropics are often performed (Agusti-Panareda et al., 2004; Barnes and Colman, 1994; Gallini and Turato, 2005; Haynes and McIntyre, 1990; Hoskins et al., 1985; Morgenstern and Davies, 1999; Neeman and Alpert, 1990; Thorpe, 1985; Tsidulko and Alpert, 2001; Ziv and Alpert, 1994) based on the potential vorticity (PV; Ertel, 1942) ap-proach.
The PV approach allows depicting the upper-tropospheric features of atmospheric processes by determining the dy-namic tropopause (DT) level. The tropopause pressure is defined as the atmospheric level with PV value representing tropopause. For the extra-tropics, PV values above 3 PVU (potential vorticity units, 1 PVU=10−6K m2kg−1s−1) are inferred (Barnes and Colman, 1994; Hoskins et al., 1985) to represent stratospheric air. A PV value of 1.5 PVU is often used to determine the tropopause. Application of the
DT concept has become popular (e.g., Morgan and Nielsen-Gammon, 1998; Pyle et al., 2004) due to the fact that the DT perspective makes it possible to present the upper-level features of synoptic processes on a single map. Often the PV streamer systems well correspond well with tropopause-level flow structures which may be determined on DT patterns.
A computer tool has been developed, which allows to infer the DT pressure (PRDT) based on the PV values calculated using the absolute vorticity values determined at the isobaric surfaces (Hoskins et al., 1985; Ma et al., 2003). The DT is defined as the first 1.5 PVU surface determined in a down-ward search from 200 hPa. After the PRDT values are found, the interpolation of the relative humidity (RHDT), potential temperature (THDT) and DT wind components to dynamic tropopause is performed.
5.2 Dynamic tropopause analysis
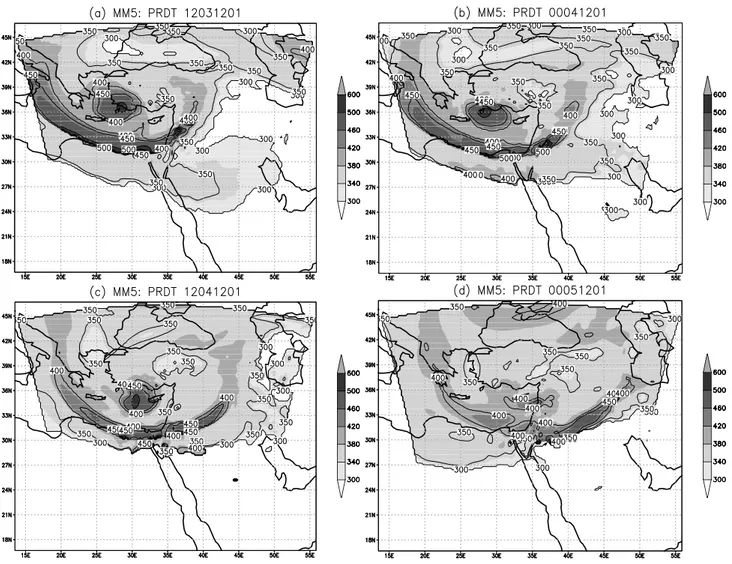
According to the earlier discussed simulation results, an im-portant feature of the 3 December 2001–5 December 2001 synoptic process was associated with seclusion of a very moist air mass into the central part of the CL. The PRDT pat-terns calculated from results of the MM5 simulation over the 15 km model domain (from 12:00 UTC, 3 December 2001 to 00:00 UTC, 5 December 2001 with 12 h time interval) (Figs. 7a–d) allow a deeper understanding of the process.
An isolated PRDT maximum is found over the northern Mediterranean coastal zone of Turkey. The PRDT maximum corresponds to the CL cyclone. Positioning of a narrow high-PRDT band (up to 550 hPa) along the southern coastal zone of the EM (over Egypt) at 12:00 UTC, 3 December 2001 (Fig. 7a) may be noted. The tropopause is nearly vertical over the area.
Fig. 6. MM5 simulation: Sea level pressure (solid); relative humidity (shaded) and winds (m s−1) at 700 hPa (a) 12:00 UTC 3 December 2001, (b) 00:00 UTC 4 December 2001, (c) 12:00 UTC 4 December 2001 and (d) 00:00 UTC 5 December 2001.
eastward shift of the streamer system. At 00:00 UTC, 5 De-cember 2001 (Fig. 7d), the stratospheric air mass intrusion weakened and a fast eastward (i.e. to Israel) propagation of the CL resulted from the model simulation results (Fig. 6d) takes place.
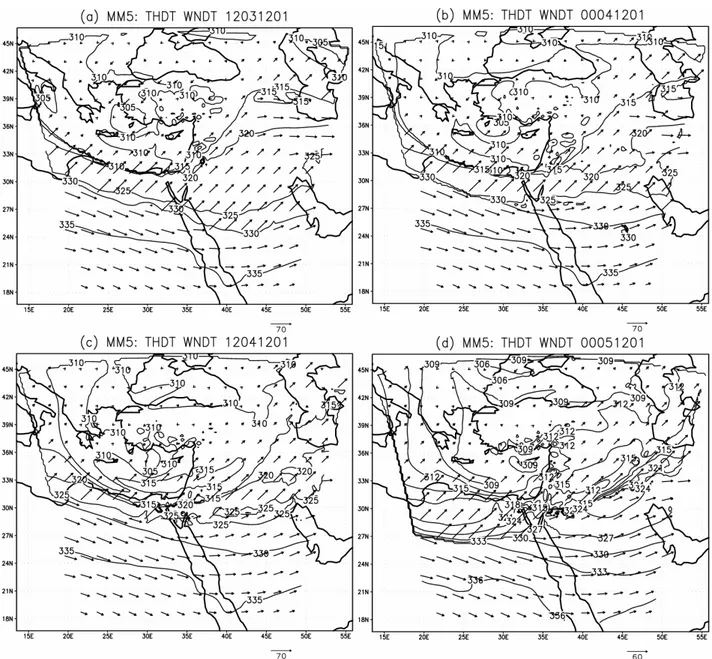
Further insights can be gained by evaluating the pat-terns (Figs. 8a–d) of potentional temperature and winds pro-vided in figures of lower space resolution for clarity. At 12:00 UTC, 3 December 2001 (Fig. 8a), a sharp DT gradi-ent along the African coast represgradi-ents the positioning of the PV streamer. The DT winds in Figs. 8a–d provide additional
Fig. 7. MM5 simulation: Dynamic tropopause pressure at 12:00 UTC 3 December 2001 3, (b) 00:00 UTC 4 December 2001, (c) 12:00 UTC 4 December 2001 and (d) 00:00 UTC 5 December 2001.
6 Discussion and conclusion
Due to the evident differences in the horizontal scales it would not be realistic to expect a full agreement of the model produced prediction of the thunderstorms of 4 December 2001–5 December 2001 in Israel with the observations. One may conclude however that the precipitation intensities as well as the timing of the rainy event in Fig. 5a are reproduced with a satisfactory level of accuracy.
The relative humidity maps at 700 hPa in Figs. 6a–d are also in agreement with the Meteosat imageries (Figs. 3a–d). The earlier indicated moisture isolation process is well repre-sented. The dynamic tropopause maps based on the model-ing results provide explanation for the physical mechanisms responsible.
According to Figs. 7a–d and 8a–d a nearly vertical tropopause fold took place over the south-eastern part of the Mediterranean region during the period. The DT patterns re-mained almost unchanged during the 48 h period (Figs. 7b–
d), indicating positioning of an intense upper-troposphere PV-streamer system over the central and southern Mediter-ranean area (Caracena et al., 2001; Fehlmann et al., 2000; Liniger and Davies, 2003; Massacand et al., 1998; Morgan and Nielsen-Gammon, 1998). At 00:00 UTC, 4 December 2001, the PV streamer is found shifted eastward (Fig. 7b). A dry zone between the two parts of the high RH area over the northeastern Mediterranean is occupied by the air masses of stratospheric origin, which are represented by the dark zone in the WV imageries. The split of the huge air-mass volume with high RH values is clearly associated with the propaga-tion of the PV streamer system.
Fig. 8. MM5 simulation: Dynamic tropopause temperature and winds at 12:00 UTC 3 December 2001, (b) 00:00 UTC 4 December 2001, (c) 12:00 UTC 4 December 2001 and (d) 00:00 UTC 5 December 2001.
The unusually intense rainy event in Israel on 4 Decem-ber 2001–5 DecemDecem-ber 2001 occurred after the formation of hurricane Olga on 26 November 2001. It has been suggested (KAD) that the Israeli floods results from an intense transport of the moist air masses from the Atlantics to the ranean region. Importance of such processes for the Mediter-ranean weather has already been indicated (Turato et al., 2004). Results of the current analysis show a more complex scenario of the process however. A major part of the moist air masses that participated in the rainy event in Israel have orig-inated from the Indian Ocean and equatorial Africa (Krichak et al., 2007). Olga’s effects have contributed to an increased
concentration of moist air over the region. The moist air masses have been transported to the EM region by the air flow in the RST system which developed as a consequence of the STJ intensification over north-Africa. Development of the CL cyclone over the north-eastern Mediterranean as well as concentration of the moist air masses in its central part have resulted from the activity of the intense PV streamer as-sociated with a narrow zone with the tropopause fold extend-ing over the central as well as southeastern Mediterranean areas.
southward displacement of upper-troposphere PV-streamer systems to the southeastern Mediterranean must be consid-ered among the main factors determining the intensity and location of the area of development of the Cyprus Low cy-clones.
Acknowledgements. This research is part of the GLOWA – Jordan River Project funded by the German Ministry of Science and Education (BMBF), in collaboration with the Israeli Ministry of Science and Technology (MOST). It was performed in accordance with the program of work under the WMO-MEDEX Project. The authors acknowledge using NCEP reanalysis data provided by the NOAA-CIRES Climate Diagnostics Center, Boulder, Colorado, USA (http://www.cdc.noaa.gov) in this publication. This paper benefited greatly from the constructive comments and suggestions by O. Reale and an anonymous reviewer.
Edited by: A. Mugnai
Reviewed by: O. Reale and another referee
References
Barnes, S. L. and Colman, B. R.: Diagnosing an Operational Nu-merical Model Using Q-Vector and Potential Vorticity Concepts, Wea Forecasting, 9, 85–102, 1994.
Buzzi, A. and Foschini, L.: Mesoscale Meteorological Features As-sociated with heavy precipitation in the Southern Alpine Region, Meteorol. Atmos. Phys., 72(2–4), 0131–0146, 2000.
Caracena, F., Marroquin, A., and Tollerud, E.: A PV-streamer’s role in a succession of heavy rain-producing MCSs over the central United States, Phys. Chem. Earth, Part B-Hydrology Oceans and Atmos., 26(9), 643–648, 2001.
Coiffer, J.: Requirements and constrains for meteorological services to manage severe weather, Proc. Tech. Conf. on Data Process-ing and ForecastProcess-ing Systems, Cairns, Australia, WMO, available online at http://www.wmo.ch/web/www/DPS/TC-DPFS-2202/ Papers-Posters/Topic3-Coiffer.pdf, 2002.
Dayan, M.: Optimization of the MM5 NWP system for weather research at TAU, M. Sc. Thesis, Tel Aviv University, 85p, 2003. Cotton, W. R.: Storms, Geophys. Sci. Series, vol. 1, ASTeR Press,
Fort Collins, 158 p., 1990.
Dudhia, J., Gill, D., Manning, K., Wang, W., and Bruyere, C.: PSU/NCAR Mesoscale Modeling System Tutorial Class Notes and Users’ Guide (MM5 Modeling System Version 3) Updated
fifth-generation Penn State/NCAR mesoscale model (MM5), NCAR/TN-398+STR, National Center for Atmospheric Re-search, Boulder, Colorado, 138 p, 1994.
Haynes, P. H. and McIntyre, M. E.: On the conservation and imper-meability theorems for potential vorticity, J. Atmos. Sci., 47(16), 2021–2031, 1990.
Hoskins, B. J., McIntyre, M. E., and Robertson, A. W.: On the use and significance of isentropic potential vorticity maps, Quart. J. Roy. Meteorol., Soc., 111, 877–946, 1985.
Kallos, G. and Metaxas, D. A.: Synoptic processes for the forma-tion of Cyprus lows, Rivista Meteorologia Aeronautica, XL(2– 3), 121–138, 1980.
Kalnay, E., Kanamitsu, M., Kistler, R., et al.: The NCEP/NCAR 40-Year Reanalysis Project, Bull. Am. Meteorol. Soc., 77, 437–471, 1996.
Kalnay, E.: Atmospheric Modeling, Data Assimilation and Pre-dictability, Cambridge University Press, 512 p., 2002.
Keyser, D. and Shapiro, M. A.: A review of the structure and dy-namics of upper-level frontal zones, Mon. Wea. Rev., 452–499, 1986.
Kistler, R., Collins, W., Saha, S., et al.: The NCEP-NCAR 50-year Reanalysis: Monthly Means CD-ROM and Documentation, Bull. Amer. Meteorol. Soc., 82, 247–268, 2001.
Krichak, S. O., Alpert, P., and Krishnamurti, T. N.: Interaction of topography and tropospheric flow – A possible generator for the Red Sea Trough?, Meteorol. Atmos. Phys., 63(3–4) 149–158, 1997a.
Krichak, S. O., Alpert, P., and Krishnamurti, T. N.: Red Sea Trough/Cyclone development, Numerical Investigation, Meteo-rol. Atmos. Phys., 63(3–4) 159–170, 1997b.
Krichak, S. O. and Alpert, P.: Role of large-scale moist dynamics in the November 1-5, 1994 hazardous Mediterranean weather, J. Geophys. Res.-Atmos., 103(D16), 19 453–19 468, 1998. Krichak, S. O., Alpert, P., and Dayan, M.: Role of atmospheric
processes associated with hurricane Olga in December 2001 flash floods in Israel, J. Hydrometeorol., 5(6), 1259–1270, 2004. Krichak, S. O.: An adaptive resolution study of December 3–5 2001
Mediterranean cyclone with torrential rains in Israel, Confer-ence on “Current efforts towards advancing the skill of regional weather prediction. Challenges and outlook”, 20–22 April, Inter-national Center for Theoretical Physics, Trieste, Italy, 2005. Krichak, S. O., Alpert, P., and Dayan, M.: An evaluation of the role
Krishnamurti, T. N.: The subtropical jet stream of winter, J. Meteo-rol., 18, 172–191, 1961.
Liniger, M. A. and Davies, H. C.: Substructure of a MAP streamer, Quart. J. Roy. Meteorol. Soc., 129, 633–651, 2003.
Maddox, R. A.: Mesoscale convective complexes, Bull. Amer. Me-teorol. Soc., 61, 1337–1367, 1980.
Massacand, A. C., Wernly, H., and Davies, H. C.: Heavy precipi-tation on the Alpine south-side: An upper-level precursor, Geo-phys. Res. Lett., 25, 1435–1438, 1998.
Mesinger, F. and Arakawa, A.: Numerical methods used in atmo-spheric models, v. 1 WMO GARP Publication Series No. 17, 64 p, 1976.
Morgan, C. M. and Nielsen-Gammon, J. W.: Using tropopause maps to diagnose midlatitude weather systems, Mon. Wea. Rev., 126, 2555–2579, 1998.
Morgenstern, O. and Davies, H. C.: Desruption of an upper-level PV-streamer by orographic and cloud-diabatic effects, Contr. At-mos. Phys., 12(2), 173–186, 1999.
Neeman, B. N. and Alpert, P.: Visualizing atmospheric fields on a personal computer: Application to potential vorticity analysis, Bull. Amer. Meteorol. Soc., 71, 154–160, 1990.
Pyle, M. E., Keyser, D., and Bosart, L. F.: A diagnostic study of jet streaks: Kinematic signatures and relationship to coher-ent tropopause disturbances, Mon. Wea. Rev., 132(1), 297–319, 2004.
Reed, R. J., Stoelinga, M. T., and Kuo, Y.-H.: A model-based study of the origin and evolution of the anomalously high potential vor-ticity in the inner region of a rapidly deepening marine cyclone, Mon. Wea. Rev., 120, 893–913, 1992.
Skamarock, W., Oliger, J., and Street, R.: Adaptive grid refinement for numerical weather prediction, J. Comp. Phys., 80, 27–60, 1989.
Thorpe, A. J.: Diagnosis of a balanced vortex structure using poten-tial vorticity, J. Atmos. Sci., 42, 397–406, 1985.
Tsidulko, M. and Alpert, P.: Synergism of upper-level potential vor-ticity and mountains in Genoa lee cyclogenesis – A numerical study, Meteorol. Atmos. Phys., 78(3–4), 261–285, 2001. Turato, B., Reale, O., and Siccardi, F.: Large scale water vapor
sources relative to the October 2000 Piedmont flood, J. Hydrom-eteorol., 5, 693–712, 2004.
Uccellini, L. W.: On the role of upper tropospheric jet streaks and leeside cyclogenesis in the development of low level jets in the Great Plains, Mon. Wea. Rev., 108, 1689–1696, 1980.
Uccellini, L. W. and Kocin, P. J.: The interaction of jet streak cir-culations during heavy snow events along the east coast of the United States, Wea. Forecasting, 2, 289–308, 1987.
Whitaker, J. S., Uccellini, L. W., and Brill, K. F.: A model-based di-agnostic study of the rapid development phase of the Presidents’ Day cyclone, Mon. Wea. Rev., 116, 2337–2365, 1988.
Ziehmann, C.: Comparison of a single model EPS with a multi-model ensemble consisting of a few operational multi-models, Tellus, 52A, 280–299, 2000.
Ziv, B. and Alpert, P.: Isobaric to isentropic interpolation errors and implication to PV analysis, J. Appl. Meteorol., 33, 694–703, 1994.