Winnie Eskild *
1Department of Bioscience, University of Oslo, Oslo, Norway,2Department of Pharmaceutical Biosciences, School of Pharmacy, University of Oslo, Oslo, Norway,3Institute of Biochemistry, Christian-Albrechts-Universität Kiel, Kiel, Germany,4Department of Pharmacology, Institute of Clinical Medicine, Faculty of Medicine, University of Oslo and Oslo University Hospital, Oslo, Norway
*winnie.eskild@ibv.uio.no
Abstract
Ablation of glycosylated lysosomal membrane protein (GLMP, formerly known as NCU-G1) has been shown to cause chronic liver injury which progresses into liver fibrosis in mice. Both lysosomal dysfunction and chronic liver injury can cause metabolic dysregulation.
Glmpgt/gtmice (formerly known asNcu-g1gt/gtmice) were studied between 3 weeks and 9 months of age. Body weight gain and feed efficiency ofGlmpgt/gtmice were comparable to wild type siblings, only at the age of 9 months theGlmpgt/gtsiblings had significantly re-duced body weight. Rere-duced size of epididymal fat pads was accompanied by hepatosple-nomegaly inGlmpgt/gtmice. Blood analysis revealed reduced levels of blood glucose, circulating triacylglycerol and non-esterified fatty acids inGlmpgt/gtmice. Increased flux of glucose, increasedde novolipogenesis and lipid accumulation were detected inGlmpgt/gt
primary hepatocytes, as well as elevated triacylglycerol levels inGlmpgt/gtliver homoge-nates, compared to hepatocytes and liver from wild type mice. Gene expression analysis showed an increased expression of genes involved in fatty acid uptake and lipogenesis in
Glmpgt/gtliver compared to wild type. Our findings are in agreement with the metabolic alter-ations observed in other mouse models lacking lysosomal proteins, and with alteralter-ations characteristic for advanced chronic liver injury.
Introduction
Glycosylated lysosomal membrane protein (GLMP, formerly known as NCU-G1) was first de-scribed as a nuclear protein, capable of regulating gene transcription [1]. Later studies identi-fied GLMP as abona fidelysosomal membrane protein [2–4]. The biological function of GLMP is unknown, but a high degree of conservation of the amino acid sequence indicates an important function [1]. Recently, we created and characterized a novel mouse model with no
OPEN ACCESS
Citation:Kong XY, Kase ET, Herskedal A, Schjalm
C, Damme M, Nesset CK, et al. (2015) Lack of the Lysosomal Membrane Protein, GLMP, in Mice Results in Metabolic Dysregulation in Liver. PLoS ONE 10(6): e0129402. doi:10.1371/journal. pone.0129402
Academic Editor:Sidney Yu, The Chinese
University of Hong Kong, HONG KONG
Received:January 13, 2015
Accepted:May 7, 2015
Published:June 5, 2015
Copyright:© 2015 Kong et al. This is an open
access article distributed under the terms of the
Creative Commons Attribution License, which permits unrestricted use, distribution, and reproduction in any medium, provided the original author and source are credited.
Data Availability Statement:All relevant data are
within the paper.
Funding:The authors have no support or funding to
report.
Competing Interests:The authors have declared
detectable expression of GLMP (Glmpgt/gtmouse, formerly known asNcu-g1gt/gtmouse), and showed that the predominant phenotype is chronic liver injury which had developed into a well-established fibrosis by the age of 6 months [5]. Further analyses identified accumulation of iron in Kupffer cells [5], which has been shown to be associated with metabolic dysregula-tion [6]. Specific accumulation of iron in Kupffer cells has been shown to correlate with the se-verity of metabolic liver injury [7].
Lysosomal disorders are a group of congenital metabolic disorders caused by malfunction-ing of a protein related to normal lysosomal function [8–13]. Most lysosomal disorders are characterized by impaired turnover of certain metabolites, which accumulate intralysosomally and affect normal lysosome and lysosome-related processes, such as autophagy [9–11]. Defec-tive recycling of macromolecules through lysosomal pathways may cause insufficient recycling of metabolites and metabolic stress [11]. In fact, metabolic irregularities have been demonstrat-ed in several mouse models with lysosomal disorders [14].
Liver fibrosis is a result of chronic liver injury, and is characterized by capillarization of si-nusoids and redirection of blood directly from the portal tract to the hepatic vein [15–17]. The impaired perfusion of the liver and loss of fenestrations across the endothelial cell layer con-tribute to the imbalance in metabolite exchange between plasma and the liver [15]. The liver is also an important organ for regulation of glucose, lipid and protein metabolism, and chronic liver injury is known to cause alterations to glucose and lipid homeostasis [18].
Using theGlmpgt/gtmouse, a mouse model lacking this lysosomal membrane protein, and characterized by chronic liver injury and liver fibrosis, we assessed the metabolic consequences of GLMP ablation, focusing on liver.
Materials and Methods
Materials
maleGlmp mice, housed in 12 different cages, and a total of 13 female WT and 20 female Glmpgt/gtmice, housed in 7 different cages were monitored at intervals of 7 days for 12 weeks, and then at 2, 3.5, 4.5, 6, 7.5 and 9 months of age. Feed efficiency was calculated as the ratio be-tween body weight gain/week for each individual mouse and the average feed intake/mouse. Bi-ological samples were collected at designated age points (1, 2, 3.5, 6, 7.5, and 9 months). Blood was obtained from randomly fed mice through cardiac puncture, and sera were collected after coagulation and centrifugation at 1500x gfor 20 minutes. Liver, spleen and epididymal fat pads (representing visceral adipose tissue) were dissected at selected time points, weighed and frozen in liquid nitrogen. The axillary and inguinal fat depots (representing subcutaneous adi-pose tissue) and interscapular brown adiadi-pose tissue were inspected at 1 and 4.5 months of age. All biological samples were stored at -80°C until further analysis.
Resting blood glucose and serum and liver lipid levels
Resting blood glucose levels were measured in male WT andGlmpgt/gtmice (age = 5 months) fedad libitumusing Accu-Chek Aviva Nano Blood Glucose Meter System. Serum levels of non-esterified fatty acids (NEFA) were analyzed using NEFA-kit according to the supplier´s protocol (ILS Laboratories Scandinavia AS, Oslo, Norway). Triacylglycerol (TAG) was quanti-fied in serum and whole liver homogenates using TG PAP 150-kit (BioMerieux, Marcy l’Etoile, France) according to the supplier’s protocol.
Isolation of primary hepatocytes
Isolation of primary hepatocytes from WT andGlmpgt/gtmice (age = 4–5 weeks) was carried out by a two-step perfusion method as described [20]. Liver parenchymal and non-parenchy-mal cells were separated by differential centrifugation as described elsewhere [21]. Primary he-patocyte preparations with high viability (>95%) were used in further studies.
Uptake and oxidation of oleic acid and glucose
Determination of [14C]oleic acid (OA) or [14C]glucose uptake and oxidation has been de-scribed previously [22]. Primary hepatocytes were isolated as described above, and cultured in hepatocyte growth medium (DMEM high glucose, enriched with 20% FBS, Pen-Strep and Fun-gizone) on a 96-well microplate (80.000 cells/well) (Corning CellBIND). For measurements of OA or glucose uptake and oxidation, the growth medium was removed after 24 h and the cells were exposed to [14C]OA (0.5μCi/mL, 100μM) bound to BSA (40μM) at a ratio of 2.5:1 in
DPBS (with Mg2+and Ca2+) with HEPES (10 mM), L-carnitine (1 mM) for 4 h or [14C]glucose (0.6μCi/mL, 200μM) in DPBS (with Mg2+and Ca2+) with HEPES (10 mM), L-carnitine (1
mM) and BSA (7.2μM) for 4 h. [14C]CO2production and total uptake of OA or glucose (sum
of CO2and cell-associated radioactivity) were calculated using cell protein levels for
Thin layer chromatography
Primary hepatocytes were isolated as described above, and cultured in hepatocyte growth me-dium in 12-well microplates (200.000 cells/well) (Corning CellBIND). The growth meme-dium was removed after 24 h and the cells were exposed either to fatty acid medium, consisting of [14C]OA (0.5μCi/mL, 100μM) bound to BSA (40μM) at a ratio of 2.5:1 in DPBS with HEPES
(10 mM) and L-carnitine (1 mM) for 4 h, or to lipogenesis medium, consisting of [14C]acetate (0.5μCi/mL, 100μM) in DMEM enriched with glucose (5.5 mM) and BSA (10μM) for 4 h.
The media were collected and stored at -20°C until further analysis, and the remaining cells washed 3x with PBS before adding 250μL H2O for cell lysis and solubilized cells were stored at
-20°C. Cell-associated lipids were extracted with chloroform:methanol according to Folch et al. [23] and separated by thin layer chromatography as previously described [23]. The content of radiolabelled lipids was normalized against cell protein content.
Analysis of gene expression
RNA extractions from mouse liver were carried out according to the manufacturer using RNeasy Plus kit. The expression of selected mRNA transcripts (S1 Table) was analyzed by qPCR using a LightCycler 480 (Roche Diagnostics, Manheim, Germany). PCR efficiencies were experimentally determined for each primer pair. Relative gene expression was calculated using theΔΔCt-method, with Beta-actin and Eukaryotic translation elongation factor 2 as reference genes.
Western blotting
Tritosomes from liver and kidneys from WT andGlmpgt/gtmice were isolated as described else-where [3]. Tritosome preparations (6μg protein) were electrophoresed on NuPAGE 4–12%
Bis-Tris Mini Gels (Life Technologies), and transferred onto PVDF membranes (Bio-Rad, Her-cules, CA, USA). After blocking, membranes were incubated overnight at 4°C with rabbit anti-GLMP serum [3] or rabbit anti-LAMP1 (1:1000, C54H11, Cell Signaling, Beverly, MA, US). This was followed by 1 h incubation with goat anti-rabbit secondary antibody conjugated to horseradish peroxidase (1:4000, 65–6120, Life Technologies).
Statistical methods
All results are expressed as mean ± SEM. Linear mixed models (LMM) were used to analyze overall differences in liver/body weight ratio, spleen/body weight ratio, serum TAG and serum NEFA levels, using IBM SPSS software (SPSS Inc. Chicago, IL, US). Other data were analyzed using two-tailed T-test (SigmaPlot, Systat Software Inc, Chicago, IL, US).
Results
Confirmation of GLMP ablation in
Glmp
gt/gtmice
In agreement with our previous report, analysis of lysosome-enriched fractions from mouse liver and kidneys after tyloxapol treatment [3] confirmed the lack of GLMP expression in Glmpgt/gtmice (S1 Fig).
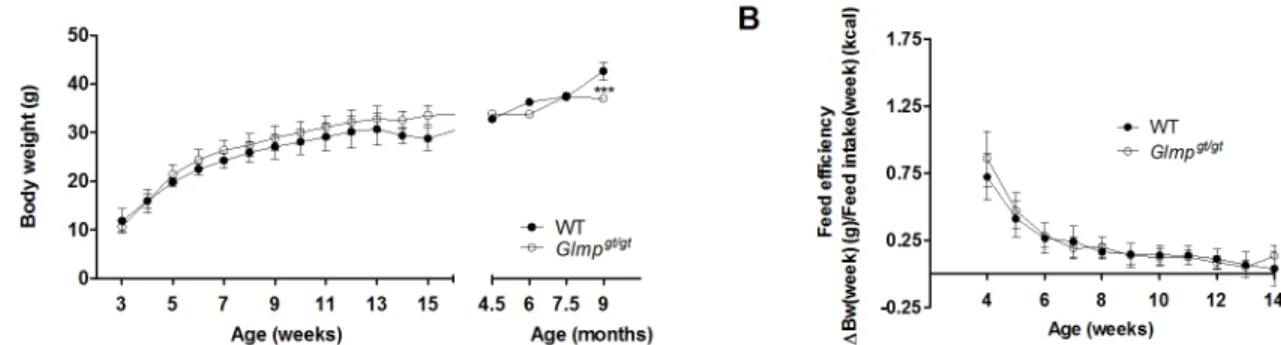
Similar body weight gain and feed intake in WT and
Glmp
gt/gtmice
mice at the age of 9 months. The feed efficiency was indistinguishable between the genotypes up to the age of 14 weeks (Fig 1B). Similar data were also obtained for female mice (data not shown).
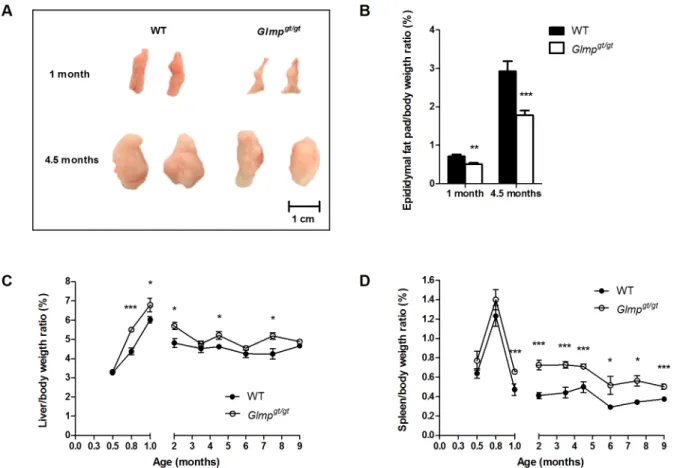
Smaller epididymal fat pads and overall hepatosplenomegaly in
Glmp
gt/gtmice
In spite of similar body weight, theGlmpgt/gtmice appeared leaner compared to the WT. Male WT andGlmpgt/gtmice were sacrificed at the age of one and 4.5 months, and their epididymal fat pads/body weight ratios were determined. As shown in Fig2Aand2B,Glmpgt/gtmice had significantly smaller epididymal fat pads compared to WT at the age of one month, with an in-creased difference at 4.5 months of age. In contrast, the axillary and inguinal fat depots and the interscapular brown adipose tissue were comparable betweent he genotypes (data not shown). Next, we assessed the liver/body weight and spleen/body weight ratios in WT andGlmpgt/gt mice. TheGlmpgt/gtliver was significantly enlarged at 0.8, 1, 2, 4.5 and 7.5 months of age com-pared to age-matched WT (Fig 2C), whileGlmpgt/gtspleen was significantly enlarged at 1, 2, 3.5, 4.5, 6, 7.5 and 9 months of age compared to age-matched WT animals (Fig 2D).
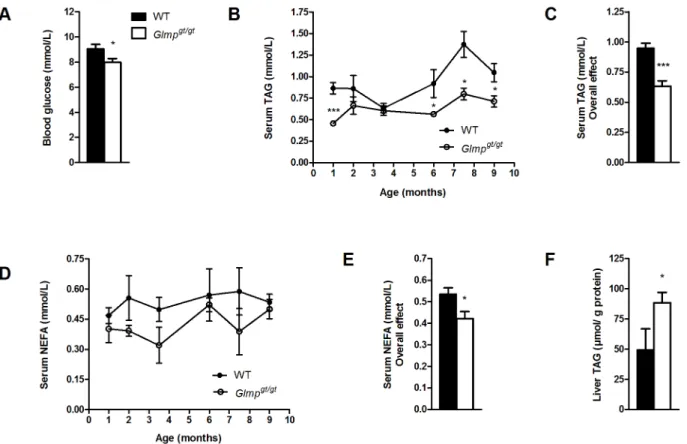
Decreased blood glucose, serum lipids and increased liver
triacylglycerol (TAG) in
Glmp
gt/gtmice
Five months oldGlmpgt/gtmice had significantly reduced levels of blood glucose compared to WT mice when fedad libitum(Fig 3A). Analysis of serum concentrations of triacylglycerol (TAG) in WT andGlmpgt/gtmice aged 1–9 months, showed an overall level that was signifi-cantly lower in theGlmpgt/gtmice (p<0.001) (Fig3Band3C). A significant decrease was also found for serum non-esterified fatty acids (NEFA) concentrations inGlmpgt/gtcompared to WT mice aged 1–9 months (p<0.001) (Fig3Dand3E). Liver content of TAG was measured in 6 months old WT andGlmpgt/gtmice. As shown inFig 3F, there were significantly higher levels of liver TAG inGlmpgt/gtcompared to WT mice.
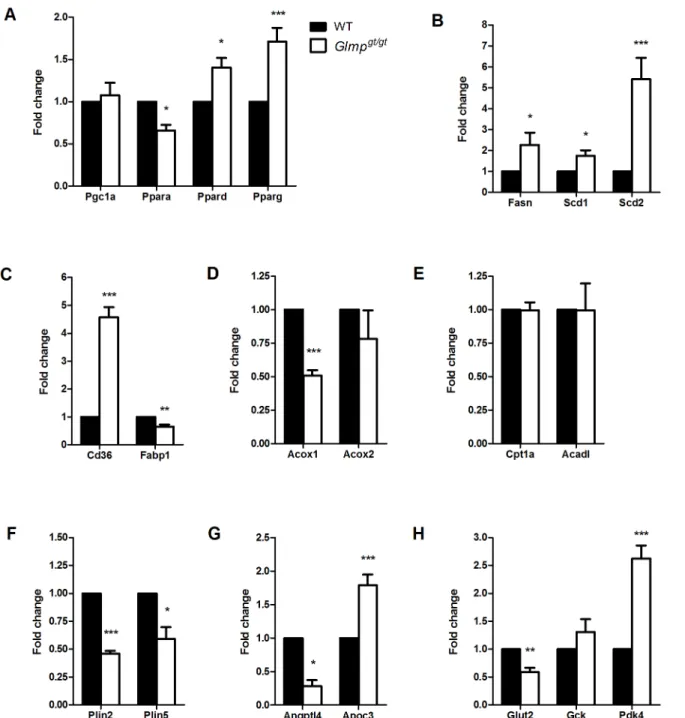
Changes in expression of metabolic genes in
Glmp
gt/gtliver
Metabolic homeostasis is regulated by peroxisome proliferator-activated receptors (PPARs) [24]. In livers from 3.5 months old mice, GLMP ablation resulted in altered mRNA expression of the three PPAR isoforms.Fig 4Ashows a decreased expression ofPparaand increased ex-pression ofPpardandPparginGlmpgt/gtliver relative to WT animals. In contrast, the PPAR co-regulatorPgc1awas not differently expressed between the two genotypes. Genes involved in
Fig 1. Loss of GLMP does not affect body weight gain and feed efficiency in young mice.(A) Body weight gain for male WT andGlmpgt/gtmice were monitored every week from 3 to 15 weeks of age, and then at 4.5, 6, 7.5 and 9 months of age. (B) The feed efficiencies of WT andGlmpgt/gtmice were monitored from 4 to 14 weeks of age (n = 27–31) (***p<0.005vs. WT). Values are presented as mean±SEM.
de novolipogenesis (Fasn,Scd1andScd2) were found to be significantly upregulated inGlmpgt/gt relative to WT liver (Fig 4B). The fatty acid transporter,Cd36showed a 4.6-fold increased ex-pression inGlmpgt/gtliver, while cytoplasmic fatty acid binding proteinFabp1was significantly decreased compared to WT (Fig 4C). The expression of the initiator of peroxisomal fatty acid beta-oxidation,Acox1was significantly decreased inGlmpgt/gtliver, while no differences were found for the expression ofAcox2(Fig 4D). Genes involved in mitochondrial fatty acid beta-oxi-dation (Cpt1aandAcadl) were not differently expressed between the two genotypes (Fig 4E). Furthermore, the expression of the lipid droplet associated proteins perilipin 2 and 5 (Plin2and Plin5) was significantly decreased inGlmpgt/gtliver (Fig 4F). A decreased expression of a lipopro-tein lipase regulator,Angptl4was also detected inGlmpgt/gtliver, while the expression ofApoc3, a very low-density lipoprotein (VLDL) regulatory protein, was increased compared to WT (Fig 4G). With regard to genes involved in glucose metabolism, a decreased expression of the glucose transporter,Glut2was detected inGlmpgt/gtliver compared to WT. No differences in expression were detected for liver specific hexokinase (Gck), while the expression ofPdk4, an inhibitor of pyruvate dehydrogenase complex, was significantly upregulated inGlmpgt/gtliver compared to WT (Fig 4H).
Fig 2. GLMP ablation causes reduced size of epididymal fat pads and hepatosplenomegaly.(A) Representative pictures of epididymal fat pads and (B) epididymal fat pads/body weight ratios in 1 (n = 4) and 4.5 months (n = 10–12) old WT andGlmpgt/gtmice. (C) Spleen/body weight ratios and (D) liver/body weight ratios in WT andGlmpgt/gtmice were examined at designated time-points between 2 weeks and 9 months of age (n = 10–12) (*p
<0.05,**p<0.01, ***p<0.005vs. WT). Values are presented as mean±SEM.
Altered glucose and fatty acid uptake and oxidation in
Glmp
gt/gthepatocytes
To assess whether GLMP ablation affects glucose and fatty acid metabolism in liver cells, hepa-tocytes were isolated from 4–6 weeks oldGlmpgt/gtand WT mouse liver and exposed to either [14C]glucose or [14C]oleic acid (OA) for 4 h. Ablation of GLMP resulted in increased glucose uptake (Fig 5A) and oxidation (Fig 5B) inGlmpgt/gthepatocytes. Exposure to [14C]OA revealed a significantly higher uptake of [14C]OA inGlmpgt/gthepatocytes compared to WT cells (Fig 5C), while the oxidation capacity for OA was comparable between the two genotypes (Fig 5D).
To further explore metabolism of OA, we performed thin layer chromatography on cell cul-ture media and cell homogenates after 4 h exposure to [14C]OA. No significant difference in se-cretion of triacylglycerol (TAG) into the media could be detected (data not shown), but there was a significant increase of accumulated total lipids inGlmpgt/gthepatocytes compared to WT hepatocytes (Fig 6A). This difference was primarily contributed to by a significant increase in TAG accumulation (Fig 6B). Incorporation of labelled OA in other lipids assayed, diacylgly-cerol (DAG) (Fig 6C), non-esterified fatty acids (NEFA) (Fig 6D), phospholipids (Fig 6E), and cholesterol esters (CE) (Fig 6F) did not significantly differ betweenGlmpgt/gtand
WT hepatocytes.
Fig 3.Glmpgt/gtmice have reduced blood glucose and circulating lipids, but increased liver triacylglycerol accumulation.
(A) Blood glucose was analyzed inad libitumfed 5 months old WT andGlmpgt/gtmice (n = 5). (B, C) The levels of circulating triacylglycerol (TAG) and (D, E) non-esterified fatty acids (NEFA) in WT andGlmpgt/gtmice were analyzed at designated time-points between 1 and 9 months of age (n = 4–8). (F) Liver TAG content was analyzed in 6 months old WT andGlmpgt/gtliver homogenates, and normalized to protein content (n = 6–7) (*p<0.05,**p<0.01,***p<0.005vs. WT). Values are presented as mean±SEM.
Increased de novo lipogenesis in
Glmp
gt/gthepatocytes
Primary hepatocytes from WT andGlmpgt/gtmice were exposed to [14C]acetate for 4 h, and thin layer chromatography was performed on cell homogenates in order to assessde novo lipo-genesis. The levels of newly synthesized NEFA showed no significant difference between the two genotypes (Fig 7A), but the incorporation into DAG was found to be significantly elevated (Fig 7B). A clear tendency for increased synthesis of TAG was also observed forGlmpgt/gt
Fig 4. Altered expression of genes involved in metabolism inGlmpgt/gtliver.
(A) qPCR analyses of 3.5 months old mouse livers from wild type (WT) and
Glmpgt/gtmice showed altered expression of genes involved in metabolic regulation (Pgc1a,Ppara,Ppard,Pparg), (B) lipogenesis (Fasn,Scd1,Scd2), (C, D, E) lipid metabolism (Cd36,Fabp1,Acox1,Acox2,Cpt1a,Acadl) (F) lipid droplets (Plin2,Plin5), (G) very low-density lipoproteins (Angptl4,Apoc3) and (H) glucose metabolism (Glut2,Gck,Pdk4) inGlmpgt/gtliver (n = 4
–8,*p<0.05,**p<0.01,***p<0.005vs. WT). Values are presented as mean±SEM.
hepatocytes (Fig 7C), which, however, did not reach statistical significance. Higher incorporation of labelled acetate into PL (Fig 7D) and CE (Fig 7E) was also detected inGlmpgt/gthepatocytes. Taken together, these results indicate increased lipogenesis inGlmpgt/gthepatocytes compared to WT cells, which was also reflected in the total amount of synthesized lipids (Fig 7F).
Fig 5. Glucose and oleic acid oxidation in WT andGlmpgt/gthepatocytes.
Overnight cultured primary hepatocytes from WT andGlmpgt/gtmice were incubated with [14C]glucose (0.6μCi/mL, 200μM) or [14C]oleic acid (OA) (0.5μCi/mL, 100μM) for 4 h. (A) Total [14C]glucose uptake, (B) [14C]glucose
oxidation, (C) [14C]OA uptake and (D) [14C]OA oxidation were measured. Substrate uptake was calculated as the sum of cell-associated radioactivity and
[14C]CO
2production. Substrate oxidation was measured as [14C]CO2production. Results were normalized to protein content (n = 20 experiments,
representing 4 individual mice/genotype, with 5 replicates each,*p<0.05,***p<0.005vs. WT). Values are presented as mean±SEM.
doi:10.1371/journal.pone.0129402.g005
Fig 6.Glmpgt/gthepatocytes incorporate more [14C]oleic acid into triacylglycerol.Overnight cultured primary hepatocytes from WT andGlmpgt/gtmice were incubated with [14C]oleic acid (0.5μCi/mL, 100μM) for 4 h. (A) The total amount of cell accumulated lipids, (B) triacylglycerol (TAG), (C) diacylglycerol
(DAG), (D) non-esterified fatty acids (NEFA), (E) phospholipids and (E) cholesterol esters (CE) were analyzed using thin layer chromatography (n = 9 experiments, representing 3 individual mice/genotype, with 3 replicates each,**p<0.01vs. WT). Values are presented as mean±SEM.
Discussion
In this study, we showed that wild type (WT) andGlmpgt/gtmice initially had similar growth rates. The feed efficiency was also comparable for the two genotypes up to the age of 14 weeks. Yet the epididymal fat pads were significantly smaller inGlmpgt/gtsiblings compared to WT mice at both one and 4.5 months of age. Other fat depots such as the axillary and inguinal white adipose tissue and the interscapular brown adipose tissue, however, were comparable be-tween the genotypes. Hepatosplenomegaly contributed to the similar body weights until the age of 9 months when theGlmpgt/gtsiblings had significantly reduced body weight. The re-duced sizes of the epididymal fat pads were reflected in lower levels of circulating triacylgly-cerol (TAG) and non-esterified fatty acids (NEFA) inGlmpgt/gtmice. In addition, theGlmpgt/gt mice had lower blood glucose concentration. Gene expression analysis using liver mRNA from WT andGlmpgt/gtmice indicated changes in both glucose and lipid metabolic pathways, and biochemical analysis of whole liver homogenates detected higher TAG levels inGlmpgt/gtliver. Exposing isolated primary hepatocytes from WT andGlmpgt/gtmice to radiolabelled oleic acid (OA) showed that theGlmpgt/gthepatocytes accumulated significantly more OA than WT he-patocytes, and that the increased OA taken up was stored as TAG. Exposure to radiolabelled
Fig 7. Increasedde novolipogenesis inGlmpgt/gthepatocytes.
Overnight cultured primary hepatocytes from WT andGlmpgt/gtmice were incubated with [14C]acetate (0.5μCi/mL, 100μM) for 4 h. (A) The amount of synthesized non-esterified fatty acids (NEFA), (B) diacylglycerol (DAG), (C) triacylglycerol
(TAG), (D) phospholipids, (E) cholesterol esters (CE) and (F) total lipids were analyzed using thin layer chromatography (n = 8 experiments, representing 4 individual mice/genotype, with 2 replicates each,*p<0.05vs. WT). Values are presented as mean±SEM.
in several mouse models with lysosomal disorders [14,26]. However, the body weight of youn-gerGlmpgt/gtmice was comparable to that of their WT siblings since the reduced adiposity was compensated by hepatosplenomegaly. Similar observations have been reported for the mouse models for mucopolysaccharidosis (MPS) type I and IIIB [14]. Interestingly, as seen in the Glmpgt/gtmouse, reduced adiposity, reduced blood glucose, reduced lipid levels and hepato-megaly were also reported in these mice [14]. A similar feed efficiency between WT and Glmpgt/gtmice suggested that theGlmpgt/gtmice did not suffer from malabsorption as was also shown for mouse models with other lysosome deficiencies [14].
We have recently established that theGlmpgt/gtmice suffer from a mild chronic liver injury, as indicated by the modest increase in serum transaminase levels. However, by the age of 6 months, the sustained liver injury led to a well-established fibrosis with increased inflammation and oxidative stress [5], conditions known to disturb the liver's capacity for regulating glucose, lipid and protein homeostasis [18]. As the liver is an important organ for glucose homeostasis [27], the small decrease in resting blood glucose may be caused by increased glucose flow to the liver. Somewhat conflicting studies have been reported regarding glucose uptake capacity in fi-brotic liver, which has been ascribed to differences in experimental setup [28–32]. A recent study using primary hepatocytes isolated from early, and advanced fibrotic rat livers, demon-strated a gradual decrease in mitochondrial function [33], an established secondary effect of ad-vanced liver fibrosis [34]. Hepatocytes from early fibrotic livers increased the glycolytic flux in order to compensate for impaired ATP-production by oxidative phosphorylation [33]. Al-though the ATP-production capacity ofGlmpgt/gtmitochondria needs to be further elucidated, we showed by using radiolabelled glucose that theGlmpgt/gthepatocytes consumed significantly higher levels of glucose compared to WT hepatocytes. Increased flow of glucose to the liver is known to stimulate the expression of lipogenic genes [35]. By using radiolabelled acetate, we showed thatde novolipogenesis was induced inGlmpgt/gthepatocytes, an expected result given the increased expression of lipogenic genes inGlmpgt/gtliver.
Unexpectedly, the expression ofPdk4was significantly increased inGlmpgt/gtliver, suggest-ing an inhibition of the pyruvate dehydrogenase complex, an event usually associated with in-hibition ofde novolipogenesis and activation of gluconeogenesis [36]. An increase inPdk4 expression has been reported in two independent mouse models of liver fibrosis, resulting from chemical-induced liver damage [37] and chronic biliary injury [38]. Interestingly, the in-creasedPdk4expression in the chemical-induced model was not accompanied by increased ex-pression of gluconeogenic genes [37]. Similarily, theMdr2-/-mouse liver (model for chronic biliary injury [39]) had increased expression of lipogenic genes, and developed steatotic nod-ules [38]. In both studies, the increasedPdk4expression was explained as preventive adapta-tions to the hepatic injury [37,38]. IncreasedPdk4expression in theGlmpgt/gtliver is likely to be an adaptive response to the chronic liver injury, although increased glucose flux through the pentose phosphate pathway, which contributes to the antioxidant defense, and NADPH pro-duction required forde novolipogenesis [40] is also a possibility.
mice accumulated slightly more liver TAG than WT animals. The small, relative difference might be undetectable using histological methods. In support of the elevated TAG accumula-tion inGlmpgt/gtliver, the increased expression of PPARγas seen in theGlmpgt/gtliver is a hall-mark of hepatic steatosis [42], as it stimulates expression of lipogenic genes [18,43] and the fatty acid transporter, CD36 [44]. IncreasedCd36mRNA expression has been found to corre-late with increased hepatic TAG content in different models of hepatic steatosis [45–47]. After exposure to radiolabelled OA, an increased fatty acid uptake concomitant with increased stor-age as TAG inGlmpgt/gthepatocytes was observed, supporting the observed TAG accumulation inGlmpgt/gtliver. Apart from increased fatty acid uptake by hepatocytes andde novo lipogene-sis, compromised assembly and secretion of VLDL particles can contribute to lipid accumula-tion [18,41,48,49]. In our experimental setup, no significant decrease of TAG secretion was detected forGlmpgt/gthepatocytes. The increased expression ofApoc3, as detected inGlmpgt/gt liver is probably a result of decreased PPARαexpression and increased influx of glucose [50]. Apoc3expression is usually positively correlated with plasma TAG levels [51,52]. However, ApoC3-containing lipoprotein secretion is stimulated by elevated levels of plasma NEFA [53], which were decreased inGlmpgt/gtmice.
The detected liver steatosis inGlmpgt/gtmice may have been promoted by chronic inflamma-tion [54,55]. In our previous study, increased expression of inflammatory cytokines, including tumor necrosis factorα(TNFα) and interleukin 1β(IL-1β) were detected inGlmpgt/gtliver [5]. Kupffer cells, activated by liver injury, have been shown to be essential for the development of diet-induced hepatic steatosis in rats, as they alter metabolic pathways in hepatocytes through TNFαsecretion [56]. TNFαpromotes the lipogenic inducer sterol regulatory element binding protein-1c (SREBP1c) [57] and the protein expression of CD36 [58]. In addition, TNFα stimu-lates lipolysis in peripheral adipose tissue to release free fatty acids into the circulation [59]. The reduced adipose tissue size and reduced levels of circulating fatty acids observed inGlmpgt/gt mice may be due to prolonged stimulation of adipose tissue lipolysis. Finally, activated Kupffer cells secrete IL-1β, which downregulates the expression of PPARα[60], a positive regulator of lipid catabolism [61].
The recent identification of a lysosomal nutrient sensing machinery (LYNUS) has provided a direct link between intralysosomal nutrient levels and the expression of metabolic genes [62,
63]. In periods of nutrient scarcity, LYNUS releases the transcription factor EB into the nucleus where it promotes the expression of genes involved in autophagy and lysosomal biogenesis, in addition to genes involved in fatty acidβ-oxidation through induced expression of PPARαand PGC1α[63–65]. A significant decrease inPparaexpression was detected inGlmpgt/gtliver, and we might hypothesize that ablation of the lysosomal membrane protein, GLMP, influences normal LYNUS function, a secondary effect observed in many lysosomal disorders [11], thus affecting normalPparaexpression and lipid turnover. Dysregulation of metabolism in Glmpgt/gtliver might in turn affect adipose tissue. However, one of the limitations of the present study is the inability to dismiss the metabolic alterations inGlmpgt/gtliver as secondary effects. We are currently establishing a cell-type-specific transgenic mouse model in order to address this question in future studies.
fractions from mouse kidney and liver after tyloxapol treatment were used to verify the ablation of GLMP expression inGlmpgt/gtmice. LAMP1 served as loading control.
(TIF)
S1 Table. Primers used in qPCR.
(DOC)
Acknowledgments
We thank Ruomei Li, Karen Kristine Sørensen and Trond Berg for sharing their expertise in mouse hepatocyte isolation, Mads Bengtsen for his help with setting up qPCR analysis, and Hilde Letnes and Hilde Hyldmo for excellent technical assistance.
Author Contributions
Conceived and designed the experiments: XYK ETK GHT ACR WE. Performed the experi-ments: XYK ETK AH CS GHT ACR. Analyzed the data: XYK ETK MD GHT ACR WE. Con-tributed reagents/materials/analysis tools: CKN MD GHT ACR. Wrote the paper: XYK ETK MD GHT ACR WE.
References
1. Steffensen KR, Bouzga M, Skjeldal F, Kasi C, Karahasan A, Matre V, et al. Human NCU-G1 can func-tion as a transcripfunc-tion factor and as a nuclear receptor co-activator. BMC Mol Biol. 2007; 8:106–121. Epub 2007/11/21. doi:10.1186/1471-2199-8-106PMID:18021396; PubMed Central PMCID: PMC2233640.
2. Sardiello M, Palmieri M, di Ronza A, Medina DL, Valenza M, Gennarino VA, et al. A gene network regu-lating lysosomal biogenesis and function. Science. 2009; 325(5939):473–477. doi:10.1126/science. 1174447PMID:19556463.
3. Schieweck O, Damme M, Schröder B, Hasilik A, Schmidt B, Lubke T. NCU-G1 is a highly glycosylated integral membrane protein of the lysosome. Biochemical Journal. 2009; 422:83–90. doi:10.1042/ bj20090567PMID:19489740.
4. Schröder BA, Wrocklage C, Hasilik A, Saftig P. The proteome of lysosomes. Proteomics. 2010; 10(22):4053–4076. Epub 2010/10/20. doi:10.1002/pmic.201000196PMID:20957757.
5. Kong XY, Nesset CK, Damme M, Løberg E-M, Lübke T, Mæhlen J, et al. Loss of lysosomal membrane
protein NCU-G1 in mice results in spontaneous liver fibrosis with accumulation of lipofuscin and iron in Kupffer cells. Disease Models & Mechanisms. 2014; 7(3):351–362. doi:10.1242/dmm.014050PMID: 24487409.
6. Dongiovanni P, Fracanzani AL, Fargion S, Valenti L. Iron in fatty liver and in the metabolic syndrome: A promising therapeutic target. Journal of Hepatology. 2011; 55(4):920–932. doi:10.1016/j.jhep.2011.05. 008PMID:21718726.
7. Nelson JE, Wilson L, Brunt EM, Yeh MM, Kleiner DE, Unalp-Arida A, et al. Relationship between the pattern of hepatic iron deposition and histological severity in nonalcoholic fatty liver disease. Hepatol-ogy. 2011; 53(2):448–457. doi:10.1002/hep.24038PMID:21274866.
8. Parkinson-Lawrence EJ, Shandala T, Prodoehl M, Plew R, Borlace GN, Brooks DA. Lysosomal storage disease: revealing lysosomal function and physiology. Physiology. 2010; 25(2):102–115. doi:10.1152/ physiol.00041.2009PMID:20430954.
10. Cox TM, Cachón-González MB. The cellular pathology of lysosomal diseases. The Journal of Patholo-gy. 2012; 226(2):241–254. doi:10.1002/path.3021PMID:21990005.
11. Platt FM, Boland B, van der Spoel AC. Lysosomal storage disorders: The cellular impact of lysosomal dysfunction. The Journal of Cell Biology. 2012; 199(5):723–734. doi:10.1083/jcb.201208152PMID: 23185029.
12. Boustany R-MN. Lysosomal storage diseases-the horizon expands. Nat Rev Neurol. 2013; 9(10):583– 598. doi:10.1038/nrneurol.2013.163PMID:23938739.
13. Alroy J, Lyons JA. Lysosomal Storage Diseases. Journal of Inborn Errors of Metabolism & Screening. 2014; 2:1–20. doi:10.1177/2326409813517663
14. Woloszynek JC, Coleman T, Semenkovich CF, Sands MS. Lysosomal Dysfunction Results in Altered Energy Balance. Journal of Biological Chemistry. 2007; 282(49):35765–35771. doi:10.1074/jbc. M705124200PMID:17911106.
15. Hernandez-Gea V, Friedman SL. Pathogenesis of liver fibrosis. In: Abbas AKGSJHPM, editor. Annual Review of Pathology: Mechanisms of Disease, Vol 6. Annual Review of Pathology-Mechanisms of Dis-ease. 62011. p. 425–456. doi:10.1146/annurev-pathol-011110-130246PMID:21073339
16. Pinzani M, Rosselli M, Zuckermann M. Liver cirrhosis. Best Practice & Research Clinical Gastroenterol-ogy. 2011; 25(2):281–290. doi:10.1016/j.bpg.2011.02.009
17. Tsochatzis EA, Bosch J, Burroughs AK. Liver cirrhosis. The Lancet. 2014; 383(9930):1749–1761. doi: 10.1016/S0140-6736(14)60121-5PMID:24480518
18. Bechmann LP, Hannivoort RA, Gerken G, Hotamisligil GS, Trauner M, Canbay A. The interaction of he-patic lipid and glucose metabolism in liver diseases. Journal of Hepatology. 2012; 56(4):952–964. PMID:22173168. doi:10.1016/j.jhep.2011.08.025
19. Bradford MM. Rapid and sensitive method for quantitation of microgram quantities of protein utilizing principle of protein-dye binding. Analytical Biochemistry. 1976; 72(1–2):248–254. doi:10.1006/abio. 1976.9999PMID:942051.
20. Hansen B, Arteta B, Smedsrød B. The physiological scavenger receptor function of hepatic sinusoidal endothelial and Kupffer cells is independent of scavenger receptor class A type I and II. Mol Cell Bio-chem. 2002; 240(1–2):1–8. doi:10.1023/A:1020660303855PMID:12487366.
21. Berg T, Boman D. Distribution of lysosomal enzymes between parenchymal and Kupffer cells of rat liver. Biochimica et Biophysica Acta (BBA)—Enzymology. 1973; 321(2):585–596. doi: 10.1016/0005-2744(73)90201-5PMID:4357668.
22. Wensaas AJ, Rustan AC, Lövstedt K, Kull B, Wikström S, Drevon CA, et al. Cell-based multiwell assays for the detection of substrate accumulation and oxidation. Journal of Lipid Research. 2007; 48(4):961– 967. doi:10.1194/jlr.D600047-JLR200PMID:17213484.
23. Folch J, Lees M, Stanley GHS. A simple method for the isolation and purification of total lipides from an-imal tissues. Journal of Biological Chemistry. 1957; 226(1):497–509. PMID:13428781.
24. Wang Y-X. PPARs: diverse regulators in energy metabolism and metabolic diseases. Cell Res. 2010; 20(2):124–137. doi:10.1038/cr.2010.13PMID:20101262.
25. Ballabio A, Gieselmann V. Lysosomal disorders: From storage to cellular damage. Biochimica et Bio-physica Acta (BBA)—Molecular Cell Research. 2009; 1793(4):684–696. doi:10.1016/j.bbamcr.2008. 12.001PMID:19111581.
26. Woloszynek JC, Kovacs A, Ohlemiller KK, Roberts M, Sands MS. Metabolic Adaptations to Interrupted Glycosaminoglycan Recycling. Journal of Biological Chemistry. 2009; 284(43):29684–29691. doi:10. 1074/jbc.M109.020818PMID:19700765.
27. Moore MC, Coate KC, Winnick JJ, An Z, Cherrington AD. Regulation of Hepatic Glucose Uptake and Storage In Vivo. Advances in Nutrition: An International Review Journal. 2012; 3(3):286–294. doi:10. 3945/an.112.002089PMID:22585902.
28. Leatherdale BA, Chase RA, Rogers J, Alberti KGMM, Davies P, Record CO. Forearm glucose uptake in cirrhosis and its relationship to glucose tolerance. Clinical Science. 1980; 59(3):191–198. PMID: 7000417.
29. Shmueli E, Walker M, Alberti G, Record CO. Normal splanchnic but impaired peripheral insulin-stimu-lated glucose uptake in cirrhosis. Hepatology. 1993; 18(1):86–95. doi:10.1002/hep.1840180115PMID: 8100799.
30. Kruszynska YT, Meyer-Alber A, Darakhshan F, Home PD, McIntyre N. Metabolic handling of orally ad-ministered glucose in cirrhosis. The Journal of Clinical Investigation. 1993; 91(3):1057–1066. doi:10. 1172/JCI116263PMID:8450036.
– 1290065.
35. Uyeda K, Repa JJ. Carbohydrate response element binding protein, ChREBP, a transcription factor coupling hepatic glucose utilization and lipid synthesis. Cell Metabolism. 2006; 4(2):107–110. doi:10. 1016/j.cmet.2006.06.008PMID:16890538.
36. Sugden MC, Holness MJ. Recent advances in mechanisms regulating glucose oxidation at the level of the pyruvate dehydrogenase complex by PDKs. American Journal of Physiology-Endocrinology and Metabolism. 2003; 284(5):E855–E862. doi:10.1152/ajpendo.00526.2002PMID:12676647.
37. Dateki M, Kunitomo M, Yoshioka K, Yanai K, Nakasono S, Negishi T. Adaptive gene regulation of pyru-vate dehydrogenase kinase isoenzyme 4 in hepatotoxic chemical-induced liver injury and its stimulato-ry potential for DNA repair and cell proliferation. Journal of Receptors and Signal Transduction. 2011; 31(1):85–95. doi:10.3109/10799893.2010.538405PMID:21182459.
38. Katzenellenbogen M, Pappo O, Barash H, Klopstock N, Mizrahi L, Olam D, et al. Multiple Adaptive Mechanisms to Chronic Liver Disease Revealed at Early Stages of Liver Carcinogenesis in the Mdr2-Knockout Mice. Cancer Research. 2006; 66(8):4001–4010. doi:10.1158/0008-5472.can-05-2937 PMID:16618719.
39. Popov Y, Patsenker E, Fickert P, Trauner M, Schuppan D. Mdr2 (Abcb4)-/- mice spontaneously devel-op severe biliary fibrosis via massive dysregulation of pro- and antifibrogenic genes. Journal of Hepatol-ogy. 2005; 43(6):1045–1054. doi:10.1016/j.jhep.2005.06.025PMID:16223543.
40. Riganti C, Gazzano E, Polimeni M, Aldieri E, Ghigo D. The pentose phosphate pathway: An antioxidant defense and a crossroad in tumor cell fate. Free Radical Biology and Medicine. 2012; 53(3):421–436. doi:10.1016/j.freeradbiomed.2012.05.006PMID:22580150.
41. Musso G, Gambino R, Cassader M. Non-alcoholic fatty liver disease from pathogenesis to manage-ment: an update. Obesity Reviews. 2010; 11(6):430–445. doi:10.1111/j.1467-789X.2009.00657.x PMID:19845871.
42. Inoue M, Ohtake T, Motomura W, Takahashi N, Hosoki Y, Miyoshi S, et al. Increased expression of PPARγin high fat diet-induced liver steatosis in mice. Biochemical and Biophysical Research Commu-nications. 2005; 336(1):215–222. doi:10.1016/j.bbrc.2005.08.070PMID:16125673.
43. Sahini N, Borlak J. Recent insights into the molecular pathophysiology of lipid droplet formation in hepa-tocytes. Progress in Lipid Research. 2014; 54(0):86–112. doi:10.1016/j.plipres.2014.02.002PMID: 24607340.
44. Zhou J, Febbraio M, Wada T, Zhai Y, Kuruba R, He J, et al. Hepatic Fatty Acid Transporter Cd36 Is a Common Target of LXR, PXR, and PPARγin Promoting Steatosis. Gastroenterology. 2008; 134(2):556–567. doi:10.1053/j.gastro.2007.11.037PMID:18242221
45. Degrace P, Moindrot B, Mohamed I, Gresti J, Du Z-Y, Chardigny J-M, et al. Upregulation of liver VLDL receptor and FAT/CD36 expression in LDLR-/- apoB100/100 mice fed trans-10,cis-12 conjugated lino-leic acid. Journal of Lipid Research. 2006; 47(12):2647–2655. doi:10.1194/jlr.M600140-JLR200PMID: 16957181.
46. Buqué X, Martínez MJ, Cano A, Miquilena-Colina ME, García-Monzón C, Aspichueta P, et al. A subset of dysregulated metabolic and survival genes is associated with severity of hepatic steatosis in obese Zucker rats. Journal of Lipid Research. 2010; 51(3):500–513. doi:10.1194/jlr.M001966PMID: 19783528.
47. García-Monzón C, Lo Iacono O, Crespo J, Romero-Gómez M, García-Samaniego J, Fernández-Ber-mejo M, et al. Increased soluble CD36 is linked to advanced steatosis in nonalcoholic fatty liver dis-ease. European Journal of Clinical Investigation. 2014; 44(1):65–73. doi:10.1111/eci.12192PMID: 24134687.
48. Feldstein AE. Novel Insights into the Pathophysiology of Nonalcoholic Fatty Liver Disease. Seminars in Liver Disease. 2010; 30(4):391–401. doi:10.1055/s-0030-1267539PMID:20960378.
50. Caron S, Verrijken A, Mertens I, Samanez CH, Mautino G, Haas JT, et al. Transcriptional Activation of Apolipoprotein CIII Expression by Glucose May Contribute to Diabetic Dyslipidemia. Arteriosclerosis, Thrombosis, and Vascular Biology. 2011; 31(3):513–519. doi:10.1161/atvbaha.110.220723PMID: 21183731.
51. Schonfeld G, George PK, Miller J, Reilly P, Witztum J. Apolipoprotein C-II and C-III levels in hyperlipo-proteinemia. Metabolism. 1979; 28(10):1001–1010. doi:10.1016/0026-0495(79)90004-0PMID: 226830.
52. Fredenrich A, Giroux LM, Tremblay M, Krimbou L, Davignon J, Cohn JS. Plasma lipoprotein distribution of apoC-III in normolipidemic and hypertriglyceridemic subjects: comparison of the apoC-III to apoE ratio in different lipoprotein fractions. Journal of Lipid Research. 1997; 38(7):1421–1432. PMID: 9254067.
53. Pavlic M, Valéro R, Duez H, Xiao C, Szeto L, Patterson BW, et al. Triglyceride-Rich Lipoprotein-Associ-ated Apolipoprotein C-III Production Is StimulLipoprotein-Associ-ated by Plasma Free Fatty Acids in Humans. Arterioscle-rosis, Thrombosis, and Vascular Biology. 2008; 28(9):1660–1665. doi:10.1161/atvbaha.108.169383 PMID:18556566.
54. Shiri-Sverdlov R, Wouters K, Gorp PJv, Gijbels MJ, Noel B, Buffat L, et al. Early diet-induced non-alco-holic steatohepatitis in APOE2 knock-in mice and its prevention by fibrates. Journal of Hepatology. 2006; 44(4):732–741. doi:10.1016/j.jhep.2005.10.033PMID:16466828.
55. Ma KL, Ruan XZ, Powis SH, Chen Y, Moorhead JF, Varghese Z. Inflammatory stress exacerbates lipid accumulation in hepatic cells and fatty livers of apolipoprotein E knockout mice. Hepatology. 2008; 48 (3):770–781. doi:10.1002/hep.22423PMID:18752326.
56. Huang W, Metlakunta A, Dedousis N, Zhang P, Sipula I, Dube JJ, et al. Depletion of Liver Kupffer Cells Prevents the Development of Diet-Induced Hepatic Steatosis and Insulin Resistance. Diabetes. 2010; 59(2):347–357. doi:10.2337/db09-0016PMID:19934001.
57. Endo M, Masaki T, Seike M, Yoshimatsu H. TNF-αInduces Hepatic Steatosis in Mice by Enhancing Gene Expression of Sterol Regulatory Element Binding Protein-1c (SREBP-1c). Experimental Biology and Medicine. 2007; 232(5):614–621. PMID:17463157.
58. Wang C, Hu L, Zhao L, Yang P, Moorhead JF, Varghese Z, et al. Inflammatory Stress Increases Hepat-ic CD36 Translational EffHepat-iciency via Activation of the mTOR Signalling Pathway. PloS one. 2014; 9(7): e103071. doi:10.1371/journal.pone.0103071PMID:25048611.
59. Ruan H, Miles PDG, Ladd CM, Ross K, Golub TR, Olefsky JM, et al. Profiling Gene Transcription In Vivo Reveals Adipose Tissue as an Immediate Target of Tumor Necrosis Factor-α: Implications for In-sulin Resistance. Diabetes. 2002; 51(11):3176–3188. PMID:12401708.
60. Stienstra R, Saudale F, Duval C, Keshtkar S, Groener JEM, van Rooijen N, et al. Kupffer cells promote hepatic steatosis via interleukin-1β–dependent suppression of peroxisome proliferator-activated recep-torαactivity. Hepatology. 2010; 51(2):511–522. doi:10.1002/hep.23337PMID:20054868
61. Mandard S, Müller M, Kersten S. Peroxisome proliferator-activated receptorαtarget genes. CMLS, Cell Mol Life Sci. 2004; 61(4):393–416. doi:10.1007/s00018-003-3216-3PMID:14999402
62. Settembre C, Fraldi A, Medina DL, Ballabio A. Signals from the lysosome: a control centre for cellular clearance and energy metabolism. Nat Rev Mol Cell Biol. 2013; 14(5):283–296. doi:10.1038/nrm3565 PMID:23609508.
63. Settembre C, Zoncu R, Medina DL, Vetrini F, Erdin S, Erdin S, et al. A lysosome-to-nucleus signalling mechanism senses and regulates the lysosome via mTOR and TFEB. 2012; 31(5):1095–1108. doi:10. 1038/emboj.2012.32PMID:22343943.
64. Settembre C, De Cegli R, Mansueto G, Saha PK, Vetrini F, Visvikis O, et al. TFEB controls cellular lipid metabolism through a starvation-induced autoregulatory loop. Nat Cell Biol. 2013; 15(6):647–658. doi: 10.1038/ncb2718PMID:23604321.
![Fig 6. Glmp gt/gt hepatocytes incorporate more [ 14 C]oleic acid into triacylglycerol](https://thumb-eu.123doks.com/thumbv2/123dok_br/16431882.196054/9.918.58.748.474.984/fig-glmp-gt-hepatocytes-incorporate-oleic-acid-triacylglycerol.webp)
![Fig 7. Increased de novo lipogenesis in Glmp gt/gt hepatocytes. Overnight cultured primary hepatocytes from WT and Glmp gt/gt mice were incubated with [ 14 C]acetate (0.5 μCi/mL, 100 μM) for 4 h](https://thumb-eu.123doks.com/thumbv2/123dok_br/16431882.196054/10.918.59.757.113.612/increased-lipogenesis-hepatocytes-overnight-cultured-primary-hepatocytes-incubated.webp)
