Patterns in China and Implications for Vaccination
Strategies: Spatio-Temporal Modeling of Surveillance
Data
Hongjie Yu1, Wladimir J Alonso2, Luzhao Feng1, Yi Tan2, Yuelong Shu3, Weizhong Yang1*, Ce´cile Viboud2*
1Division of Infectious Disease, Key Laboratory of Surveillance and Early-warning on Infectious Disease, Chinese Centre for Disease Control and Prevention, Beijing, China, 2Fogarty International Center, National Institutes of Health, Bethesda, Maryland, United States of America,3National Institute for Viral Disease Control and Prevention, China CDC, Key Laboratory for Medical Virology, National Health and Family Planning Commission, Beijing, China
Abstract
Background:The complexity of influenza seasonal patterns in the inter-tropical zone impedes the establishment of effective routine immunization programs. China is a climatologically and economically diverse country, which has yet to establish a national influenza vaccination program. Here we characterize the diversity of influenza seasonality in China and make recommendations to guide future vaccination programs.
Methods and Findings:We compiled weekly reports of laboratory-confirmed influenza A and B infections from sentinel hospitals in cities representing 30 Chinese provinces, 2005–2011, and data on population demographics, mobility patterns, socio-economic, and climate factors. We applied linear regression models with harmonic terms to estimate influenza seasonal characteristics, including the amplitude of annual and semi-annual periodicities, their ratio, and peak timing. Hierarchical Bayesian modeling and hierarchical clustering were used to identify predictors of influenza seasonal characteristics and define epidemiologically-relevant regions. The annual periodicity of influenza A epidemics increased with latitude (mean amplitude of annual cycle standardized by mean incidence, 140% [95% CI 128%–151%] in the north versus 37% [95% CI 27%–47%] in the south,p,0.0001). Epidemics peaked in January–February in Northern China (latitude
$33uN) and April–June in southernmost regions (latitude ,27uN). Provinces at intermediate latitudes experienced dominant semi-annual influenza A periodicity with peaks in January–February and June–August (periodicity ratio.0.6 in provinces located within 27.4uN–31.3uN, slope of latitudinal gradient with latitude20.016 [95% CI20.025 to 20.008], p,0.001). In contrast, influenza B activity predominated in colder months throughout most of China. Climate factors were the strongest predictors of influenza seasonality, including minimum temperature, hours of sunshine, and maximum rainfall. Our main study limitations include a short surveillance period and sparse influenza sampling in some of the southern provinces.
Conclusions:Regional-specific influenza vaccination strategies would be optimal in China; in particular, annual campaigns should be initiated 4–6 months apart in Northern and Southern China. Influenza surveillance should be strengthened in mid-latitude provinces, given the complexity of seasonal patterns in this region. More broadly, our findings are consistent with the role of climatic factors on influenza transmission dynamics.
Please see later in the article for the Editors’ Summary.
Citation:Yu H, Alonso WJ, Feng L, Tan Y, Shu Y, et al. (2013) Characterization of Regional Influenza Seasonality Patterns in China and Implications for Vaccination Strategies: Spatio-Temporal Modeling of Surveillance Data. PLoS Med 10(11): e1001552. doi:10.1371/journal.pmed.1001552
Academic Editor:Steven Riley, Imperial College London, United Kingdom
ReceivedFebruary 4, 2013;AcceptedOctober 10, 2013;PublishedNovember 19, 2013
This is an open-access article, free of all copyright, and may be freely reproduced, distributed, transmitted, modified, built upon, or otherwise used by anyone for any lawful purpose. The work is made available under the Creative Commons CC0 public domain dedication.
Funding:This work was supported by the US National Institutes of Health (Comprehensive International Program for Research on AIDS grant U19 AI51915); the China-U.S. Collaborative Program on Emerging and Re-emerging Infectious Diseases; grants from the Ministry of Science and Technology, China (2012 ZX10004-201); and the in-house Influenza Research Program of the Division of International Epidemiology and Population Studies, Fogarty International Center, National Institutes of Health, which is funded by the Pandemic Emergent Threats Unit, Office of Global Affairs, Department of Health and Human Services. The funders had no role in study design, data collection and analysis, decision to publish, or preparation of the manuscript.
Introduction
The seasonality of influenza has been well studied in temperate regions of the world but remains poorly characterized in tropical and subtropical areas [1,2]. A growing body of evidence suggests that seasonal patterns are highly diverse in tropical settings, particularly in Asia, where influenza can display semi-annual or annual epidemic cycles, as well as year-round activity [2–4]. Experimental and modeling studies have suggested that low levels of absolute humidity and cold temperature favor influenza transmission and survival in temperate settings [5–8], while rain-fall fluctuations may drive influenza activity in low latitudes [8]. From a public health perspective, local information on influenza seasonality and circulating strains is crucial to inform the timing and composition of influenza vaccines, particularly for large tropical countries [9]. In parallel, there is growing interest in establishing routine immunization programs in low- and middle-income regions [10], due to strengthening of laboratory surveillance systems and increased recognition of disease burden [11–14].
China is a geographically, economically, and climatologically diverse country with a population of 1.34 billion, which experiences substantial influenza mortality burden, estimated at 11–18 excess deaths per 100,000 in pandemic and inter-pandemic seasons [11,15]. Although seasonal influenza vaccination was introduced in 1998, China has yet to initiate a national immunization pro-gram [16]. Previous work has suggested intriguing differences in the seasonality and evolutionary dynamics of influenza between Northern and Southern China [4,17,18], indicating that analysis of high-resolution epidemiological data will be required to guide control strategies in this country. The goals of our study were to characterize the seasonality of the disease across China, assess the role of putative drivers of seasonality, and identify broad epidemiological regions that could be used as a basis to optimize the timing of future vaccination programs.
Methods
Influenza Surveillance Dataset
We used weekly reports from a national sentinel hospital-based influenza surveillance network, providing the number of labora-tory-confirmed influenza cases by virus type (influenza A and B) and the number of specimens tested in 30 Chinese provinces. Influenza laboratory surveillance was initiated in 2000 in China; here we focused on the period 2005–2011 where sampling was more intense. We briefly describe the surveillance system below; refer to [11] for more details.
Each week, 193 sentinel hospitals located in 88 cities representing all 30 provinces with exception of Tibet (Figure 1) reported the number of patients with influenza-like-illness (ILI) and total visits to outpatient and/or emergency departments to a centralized online system maintained by Chinese Center for Disease Control and Prevention (China CDC, Beijing). Identifi-cation of patients with ILI was based on a standard case definition, including body temperature $38uC with either cough or sore throat, in the absence of an alternative diagnosis. In each sentinel hospital, nasopharyngeal swabs were collected daily from the first one or two ILI cases and placed in sterile viral transport medium for influenza virus testing, resulting in ten to 15 specimens per hospital per surveillance week. Samples were inoculated into Madin-Darby canine kidney (MDCK) cells and/or specific pathogen free (SPF) chicken embryo for virus isolation. Hemag-glutination inhibition (HI) and/or conventional or real-time
reverse transcription PCR (RT-PCR) assay were performed to identify the types/subtype of influenza virus, following a standard protocol [19].
Because of limited understanding of the seasonality of influ-enza in China prior to this study, and following general WHO recommendations, influenza surveillance was implemented year-round in 99 Southern Chinese hospitals, representing 45 cities below latitude 34uN. To confirm the seasonality of influenza in Northern China, surveillance activities were also conducted year-round in 22 of the 94 northern hospitals, while surveillance was restricted to the period October to March in the remaining hospitals (representing 43 cities total; Figure 1). In response to the evolving A/H1N1 pandemic, all 193 sentinel hospitals were asked to implement surveillance year-round starting in May 2009. All 193 participating hospitals have contributed systematic informa-tion during the study period, so that the number of participating sites remained constant. Since China is located in the Northern Hemisphere, we defined the respiratory season as the period running from August 1st to July 31st each year. Analysis excluded the A/H1N1 pandemic season April 2009–April 2010 to focus on influenza patterns in inter-pandemic seasons.
Climate, Geographic, and Demographic Data
To assess the role of putative drivers of influenza seasonality, we collected province-level demographic, economic, and geographic data, including population size and density [20], gross domestic product [20], and human mobility patterns between provinces (including the per capita number of passengers travelling by air, rail, road, and boat [21]). Average latitude and longitude coordinates for each province were obtained by weighting the coordinates of cities participating in influenza surveillance by their population sizes (Table 1).
We obtained daily meteorological data for each participating city during the study period, including temperature (minimum, maximum, mean), vapor pressure (minimum, maximum, mean), relative humidity (minimum, maximum, mean), rainfall, and hours of sunshine, as recorded by China Meteorological Administration (Table 1; Text S1) [22]. Province-level meteorological indicators were calculated as population-weighted averages of city-level data. Summary climate indicators were obtained by averaging the daily values of each climate factor by season (winter, Dec–Feb; spring, Mar–May; summer, Jun–Aug; fall, Sep–Nov), as well as calculat-ing annual minimums and maximums. We also categorized the 30 provinces into six climatic zones on the basis of previous work [23], ranging from tropical to cold-temperate climates (Figure 1; Table 1).
Estimates of Seasonal Characteristics
To visualize the average seasonal signature of influenza in each province, we first estimated the proportion of influenza cases identified in each week of the respiratory season, averaged across all complete years available for study. This method provided an empirical measure of seasonality, while adjusting for differences in sampling intensity and viral activity over time and between provinces [1,24].
Weekly province-level influenza virus positive isolates were standardized by the annual number of influenza specimens tested prior to further modeling [25]. Preliminary analyses using a wavelet approach [26,27] did not reveal changes in periodicity over time, so we elected to use stationary methods to characterize influenza seasonality. To obtain quantitative seasonality estimates, we fitted multiple linear regression models to weekly influenza time series separately in each province, including harmonic terms Influenza Seasonality in China
representing annual and semi-annual periodicities (see Text S1 for full details and [4,26,28,29]). Briefly, the model follows:
fluið Þt ~aizbicos 2Pið t=52:17Þzcisin 2Pið t=52:17Þz
dicos 4Pið t=52:17Þzeisin 4Pið t=52:17Þzeið Þt ,
where flui(t) are the weekly standardized counts of influenza positive A isolates (or B, or A+B combined) in province i; tis a running index for week;ai, bi,ci,di, and eiare the intercept and seasonality coefficients to be estimated from the data; andei(t) are
normally distributed errors.
On the basis of the estimated model coefficients representing harmonic terms, we extracted the amplitude of annual and semi-annual periodicities (AnnAmpi= sqrt(bi2+ci2) and SemiAnnAm-pi= sqrt(di2+ei2)), and the annual peak timing (AnnPeakTimingi=
2atan(ci/bi)). To control for different levels of influenza activity across provinces, we calculated the relative amplitudes of annual and semi-annual periodicities, obtained by dividing AnnAmpiand SemiAnnAmpiestimates by the mean of theflui(t) time series [26]. To estimate the relative contribution of semi-annual periodicity, we calculated the ratio between the amplitude of the semi-annual periodicity and the sum of the amplitudes of annual and semi-annual periodicities (ratioi=SemiAnnAmpi/(AnnAmpi+SemiAnnAmpi)). A ratio close to 1 is indicative of dominant semi-annual periodicity
while a ratio close to 0 indicates dominant annual periodicity. Confidence intervals on estimates of relative amplitude, peak timing, and periodicity ratio were obtained by fitting seasonal regression models to 1,000 datasets resampled from the original data by block-bootstrap, which accounts for auto-correlation in weekly influenza incidences (Text S1).
As a sensitivity analysis, we fitted joint seasonal regression models in all 30 provinces using mixed effects models, accounting for fixed effects for broad geographic regions and random effects for provinces (Text S1). This approach revealed nearly identical seasonal curves as in the province-stratified analysis, indicating that the information contained in province-specific influenza data was sufficient to fit separate models. In the remainder of the paper, we report the results of province-stratified analyses. Further sensitivity analyses were conducted by fitting logistic regression models to the weekly influenza percent positive (weekly number of positive/weekly number specimens tested), which has also been used in past influenza research (Text S1) [27,30].
In addition to seasonal parameters derived from regression models, we also quantified the median epidemic duration in each of the 30 provinces, defined as the number of weeks in which the reported number of influenza viruses exceeded a relative threshold, set at 2.5% or 5% of the total number of influenza viruses reported during the respiratory season. As a sensitivity
Figure 1. Map of Chinese provinces conducting influenza surveillance (n= 30).Dots indicate the location of the capital city in each province. A total of 193 hospitals participate in disease surveillance, representing 88 cities. Colors illustrate different climatic domains (black, cold-temperate; blue, mid-cold-temperate; green, warm-cold-temperate; orange, subtropical; red, tropical). Different symbols indicate the type of surveillance scheme (circles, year-round surveillance; triangles, Oct through Mar surveillance).
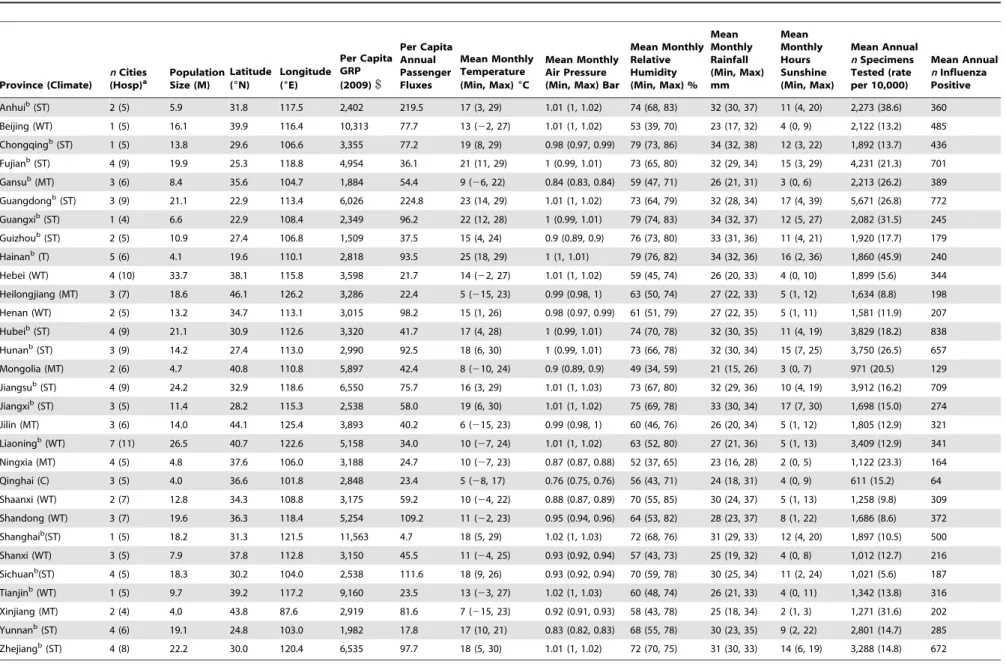
Table 1.Background characteristics of the 30 provinces involved in influenza surveillance and information on influenza sampling intensity, 2005–2011, China.
Province (Climate)
nCities (Hosp)a
Population Size (M)
Latitude (6N)
Longitude (6E)
Per Capita GRP (2009)$
Per Capita Annual Passenger Fluxes
Mean Monthly Temperature (Min, Max)6C
Mean Monthly Air Pressure (Min, Max) Bar
Mean Monthly Relative Humidity (Min, Max) %
Mean Monthly Rainfall (Min, Max) mm
Mean Monthly Hours Sunshine (Min, Max)
Mean Annual
nSpecimens Tested (rate per 10,000)
Mean Annual
nInfluenza Positive
Anhuib(ST) 2 (5) 5.9 31.8 117.5 2,402 219.5 17 (3, 29) 1.01 (1, 1.02) 74 (68, 83) 32 (30, 37) 11 (4, 20) 2,273 (38.6) 360
Beijing (WT) 1 (5) 16.1 39.9 116.4 10,313 77.7 13 (22, 27) 1.01 (1, 1.02) 53 (39, 70) 23 (17, 32) 4 (0, 9) 2,122 (13.2) 485
Chongqingb(ST) 1 (5) 13.8 29.6 106.6 3,355 77.2 19 (8, 29) 0.98 (0.97, 0.99) 79 (73, 86) 34 (32, 38) 12 (3, 22) 1,892 (13.7) 436
Fujianb(ST) 4 (9) 19.9 25.3 118.8 4,954 36.1 21 (11, 29) 1 (0.99, 1.01) 73 (65, 80) 32 (29, 34) 15 (3, 29) 4,231 (21.3) 701
Gansub(MT) 3 (6) 8.4 35.6 104.7 1,884 54.4 9 (
26, 22) 0.84 (0.83, 0.84) 59 (47, 71) 26 (21, 31) 3 (0, 6) 2,213 (26.2) 389
Guangdongb(ST) 3 (9) 21.1 22.9 113.4 6,026 224.8 23 (14, 29) 1.01 (1, 1.02) 73 (64, 79) 32 (28, 34) 17 (4, 39) 5,671 (26.8) 772
Guangxib(ST) 1 (4) 6.6 22.9 108.4 2,349 96.2 22 (12, 28) 1 (0.99, 1.01) 79 (74, 83) 34 (32, 37) 12 (5, 27) 2,082 (31.5) 245
Guizhoub(ST) 2 (5) 10.9 27.4 106.8 1,509 37.5 15 (4, 24) 0.9 (0.89, 0.9) 76 (73, 80) 33 (31, 36) 11 (4, 21) 1,920 (17.7) 179
Hainanb(T) 5 (6) 4.1 19.6 110.1 2,818 93.5 25 (18, 29) 1 (1, 1.01) 79 (76, 82) 34 (32, 36) 16 (2, 36) 1,860 (45.9) 240
Hebei (WT) 4 (10) 33.7 38.1 115.8 3,598 21.7 14 (22, 27) 1.01 (1, 1.02) 59 (45, 74) 26 (20, 33) 4 (0, 10) 1,899 (5.6) 344
Heilongjiang (MT) 3 (7) 18.6 46.1 126.2 3,286 22.4 5 (215, 23) 0.99 (0.98, 1) 63 (50, 74) 27 (22, 33) 5 (1, 12) 1,634 (8.8) 198
Henan (WT) 2 (5) 13.2 34.7 113.1 3,015 98.2 15 (1, 26) 0.98 (0.97, 0.99) 61 (51, 79) 27 (22, 35) 5 (1, 11) 1,581 (11.9) 207
Hubeib(ST) 4 (9) 21.1 30.9 112.6 3,320 41.7 17 (4, 28) 1 (0.99, 1.01) 74 (70, 78) 32 (30, 35) 11 (4, 19) 3,829 (18.2) 838
Hunanb(ST) 3 (9) 14.2 27.4 113.0 2,990 92.5 18 (6, 30) 1 (0.99, 1.01) 73 (66, 78) 32 (30, 34) 15 (7, 25) 3,750 (26.5) 657
Mongolia (MT) 2 (6) 4.7 40.8 110.8 5,897 42.4 8 (210, 24) 0.9 (0.89, 0.9) 49 (34, 59) 21 (15, 26) 3 (0, 7) 971 (20.5) 129
Jiangsub(ST) 4 (9) 24.2 32.9 118.6 6,550 75.7 16 (3, 29) 1.01 (1, 1.03) 73 (67, 80) 32 (29, 36) 10 (4, 19) 3,912 (16.2) 709
Jiangxib(ST) 3 (5) 11.4 28.2 115.3 2,538 58.0 19 (6, 30) 1.01 (1, 1.02) 75 (69, 78) 33 (30, 34) 17 (7, 30) 1,698 (15.0) 274
Jilin (MT) 3 (6) 14.0 44.1 125.4 3,893 40.2 6 (215, 23) 0.99 (0.98, 1) 60 (46, 76) 26 (20, 34) 5 (1, 12) 1,805 (12.9) 321
Liaoningb(WT) 7 (11) 26.5 40.7 122.6 5,158 34.0 10 (
27, 24) 1.01 (1, 1.02) 63 (52, 80) 27 (21, 36) 5 (1, 13) 3,409 (12.9) 341
Ningxia (MT) 4 (5) 4.8 37.6 106.0 3,188 24.7 10 (27, 23) 0.87 (0.87, 0.88) 52 (37, 65) 23 (16, 28) 2 (0, 5) 1,122 (23.3) 164
Qinghai (C) 3 (5) 4.0 36.6 101.8 2,848 23.4 5 (28, 17) 0.76 (0.75, 0.76) 56 (43, 71) 24 (18, 31) 4 (0, 9) 611 (15.2) 64
Shaanxi (WT) 2 (7) 12.8 34.3 108.8 3,175 59.2 10 (24, 22) 0.88 (0.87, 0.89) 70 (55, 85) 30 (24, 37) 5 (1, 13) 1,258 (9.8) 309
Shandong (WT) 3 (7) 19.6 36.3 118.4 5,254 109.2 11 (22, 23) 0.95 (0.94, 0.96) 64 (53, 82) 28 (23, 37) 8 (1, 22) 1,686 (8.6) 372
Shanghaib(ST) 1 (5) 18.2 31.3 121.5 11,563 4.7 18 (5, 29) 1.02 (1, 1.03) 72 (68, 76) 31 (29, 33) 12 (4, 20) 1,897 (10.5) 500
Shanxi (WT) 3 (5) 7.9 37.8 112.8 3,150 45.5 11 (24, 25) 0.93 (0.92, 0.94) 57 (43, 73) 25 (19, 32) 4 (0, 8) 1,012 (12.7) 216
Sichuanb(ST) 4 (5) 18.3 30.2 104.0 2,538 111.6 18 (9, 26) 0.93 (0.92, 0.94) 70 (59, 78) 30 (25, 34) 11 (2, 24) 1,021 (5.6) 187
Tianjinb(WT) 1 (5) 9.7 39.2 117.2 9,160 23.5 13 (
23, 27) 1.02 (1, 1.03) 60 (48, 74) 26 (21, 33) 4 (0, 11) 1,342 (13.8) 316
Xinjiang (MT) 2 (4) 4.0 43.8 87.6 2,919 81.6 7 (215, 23) 0.92 (0.91, 0.93) 58 (43, 78) 25 (18, 34) 2 (1, 3) 1,271 (31.6) 202
Yunnanb(ST) 4 (6) 19.1 24.8 103.0 1,982 17.8 17 (10, 21) 0.83 (0.82, 0.83) 68 (55, 78) 30 (23, 35) 9 (2, 22) 2,801 (14.7) 285
Zhejiangb(ST) 4 (8) 22.2 30.0 120.4 6,535 97.7 18 (5, 30) 1.01 (1, 1.02) 72 (70, 75) 31 (30, 33) 14 (6, 19) 3,288 (14.8) 672
aNumber of cities and hospitals participating in surveillance.
bIndicates year-round influenza surveillance before 2009 (all provinces switched to year-round surveillance in the post-2009 pandemic period).
C, cold temperate; GRP, gross regional product; MT, mid-temperate; ST, subtropical; T, tropical; WT, warm temperate; doi:10.1371/journal.pmed.1001552.t001
Influenza
Seasonali
ty
in
China
PLOS
Medicine
|
www.plosm
edicine.org
4
November
2013
|
Volume
10
|
Issue
11
|
analysis we estimated epidemic duration on the basis of the weekly percent positive exceeding an absolute threshold, set at 5% or 10% of all specimens tested in the week. We also assessed whether duration estimates were affected by sampling scheme, in particular
whether surveillance was conducted year-round or limited to the October–March period.
As all analyses revealed important differences in the seasonality of influenza A and B, we present influenza A- and B-specific
seasonal parameter estimates in the main text and refer to the Text S1 for aggregate analyses.
Predictors of Influenza Seasonality
Next, we searched for predictors of influenza seasonal characteristics, including geography (latitude, longitude), popula-tion size and density, human mobility patterns, surveillance intensity (number of viruses sampled, number of participating hospitals and cities), and climate variables (Table 1). As seasonal characteristics were not fixed parameters but rather parameters estimated from seasonal regression models, we used a hierarchical Bayesian approach with non-informative priors to regress seasonal parameters against putative predictors (Text S1). A subset of predictors was first identified by classical stepwise multivariate analysis and these predictors were then used in the Bayesian approach. The errors obtained by bootstrap resampling were considered as observation variances in the Bayesian approach.
Epidemiological Regions Relevant for Control
To assist with the design of routine influenza vaccination programs in China, in particular with regard to the optimal timing of vaccination, we set out to identify broad regions that share similar influenza epidemiological patterns. We applied hierarchi-cal clustering using Ward’s minimum variance method [31] to identify regional clusters, relying on the squared Euclidian pairwise difference between standardized influenza time series as the distance metrics [32]. We also performed sensitivity analyses using an alternative distance metric (Manhattan distance [32]) and clustering approach (complete linkage [33]). Finally, we applied stepwise linear discriminant analysis to identify the putative geographic, demographic, and climate predictors of the epidemiological regions defined by the cluster analysis.
Results
Sampling Intensity
During the study period 2005–2011, the average number of samples tested for influenza averaged 2,200 annually by province, with most intense sampling in Guangdong province in Southern China (5,661 samples per year) and thinnest sampling in Qinghai province in Northwest China (611 samples per year; Table 1). This level of sampling corresponds to 1.81 respiratory samples tested on average per year per 10,000 population in China (range across provinces 0.56–4.58). On average, 371 influenza virus positive specimens were identified annually by province (range across provinces 64–838).
Influenza Seasonal Characteristics by Province
Empirical seasonality patterns and seasonal regression models. Heatmaps representing weekly province-level labora-tory-confirmed influenza time series and their empirical seasonal signature are provided in Figure 2, revealing a diversity of seasonality patterns across China. While northern China experi-enced epidemics concentrated in winter, and southernmost provinces experienced influenza activity in spring–summer, provinces at intermediate latitudes did not exhibit clear annual seasonality.
Seasonal regression of time series data allowed further quantification of influenza seasonal characteristics and confirmed important differences by geography and virus type. Seasonal models fitted reasonably well for all influenza subtypes combined, influenza A, and high latitude provinces (median R2= 23%, range 3%–60%); however fit was poorer for influenza B (median R2= 10%, range 0.1%–26%; see Figures S1 and S2 and Text
S1 for time series plots and residuals). Model fit however was not related to sampling intensity for any of the influenza outcomes (p.0.19; Text S1).
Periodicity. Influenza A displayed strong annual periodicity in provinces above,33uN latitude, and weaker annual periodicity
at lower latitudes (median relative amplitude of annual cycle, 140% [95% CI 128%–151%] in the 15 northern temperate provinces versus 37% [95% CI 27%–47%] in the 15 southern provinces, Wilcoxon test,p,0.0001; Figure 3). Further, there was a strong latitudinal gradient in the amplitude of annual influenza A periodicity (R2= 0.57; p,0.0001; Figure 4). Estimates of the periodicity of influenza B epidemics revealed a similar latitudinal gradient of higher annual amplitude in northern provinces (R2= 0.61;p,0.0001; Figure 4). There was no difference in the amplitude of annual periodicity by influenza type (Wilcoxon paired test,p= 0.27).
The relative importance of influenza A semi-annual cycle also varied geographically, with highest contribution in seven mid-latitude provinces ranging from 27.4uN–31.3uN (ratio .0.6) (Figures 3 and 4). Overall, there was weak latitudinal gradient in importance of the semi-annual cycle, indicative of more intense semi-annual influenza A activity in southern China (slope20.016 [95% CI20.025 to20.008], R2= 0.31,p,0.001; Figure 4). In contrast, semi-annual periodicities were less pronounced for influenza B than for influenza A (p,0.0001 for paired difference in ratio of semi-annual cycle; Figure 4), with no latitudinal gradient in influenza B semi-annual periodicities (p= 0.77).
Peak timing. Influenza A peak timing estimates were concentrated in winter months in the 15 northern temperate provinces (median peak timing Jan 7; range Dec 24–Jan 15; Figures 3 and 4). In contrast, epidemic timing was more variable in the 15 tropical and subtropical southern provinces. Mid-latitude provinces experienced semi-annual peaks of influenza A in Jan– Feb and Jun–Aug, while the southernmost provinces had one major peak in spring (peak timing range, May 15 to Jun 15; Figure 3). There was no latitudinal gradient in influenza A epidemic timing (p= 0.12; Figure 4). In contrast, there was less geographic variation in seasonality of influenza B, with a distribution of estimated peaks of influenza B activity concentrated in colder months (Dec–Apr), except for three southern provinces experiencing peaks in May (Figures 3 and 4). Further, influenza B epidemics occurred gradually later in the year in provinces closer to the equator (R2= 0.65,p,0.0001). Seasonal estimates for total influenza activity mirrored those found for influenza A, which accounted for 74% of all influenza viruses during the study period (Figures S3 and S4). Sensitivity analyses based on the weekly percent positive revealed similar seasonal patterns by geography and virus type (Figure S5).
Epidemic duration. We estimated relative and absolute measures of epidemic duration, which were highly correlated with each other for both influenza types (rho.0.79;p,0.0001). Average duration of influenza A epidemics was longer in southern than in northern provinces based on the relative epidemic threshold set at a fraction of the annual number of cases (medians 14.3 versus 10.8 wk for a 2.5% threshold, Wilcoxonp,0.0001; Figure S6). The pattern of longer epidemic duration in the south was robust to using an absolute threshold for the weekly proportion of respiratory specimens testing positive for influenza (medians 22.5 versus 15.6 wk for a 5% percent positive threshold, Wilcoxon p= 0.0002). Duration of influenza A epidemics increased with latitude based on both measures (R2= 11%–37%,p,0.04; Figure S6). Similarly, influenza B epidemics were characterized by longer duration in southern provinces (13.2 versus 9.2 wk, p,0.0001; latitudinal gradient R2= 11%–48%,p,0.04; Figure S6).
Influenza Seasonality in China
Estimates of epidemic duration were not affected by the surveillance scheme, with no difference between northern provinces conducting surveillance during Oct–Mar and those with year-round sampling (difference ,1.0 wk, p.0.24). Differ-ences in epidemic duration by geography and virus type were robust to using more conservative epidemic thresholds (i.e., using higher thresholds, resulting in shorter duration estimates).
Prevalence of influenza A and B. Given observed differ-ences in the seasonality of influenza by geography and virus type, we checked whether the relative predominance of these viruses also differed across China. We found that the median proportion of influenza B among all influenza virus positive specimens ranged between 5%–55% across provinces in the 7 study years, with increasing prevalence towards the south (Spearman rho =20.71 between latitude and influenza B proportion;p,0.0001; Figure 5).
Predictors of Influenza Seasonality
Next, we searched for climate, demographic, or geographic predictors of influenza seasonal characteristics using a hierarchi-cal Bayesian approach, while adjusting for differences in sampling intensity between sites (Table 2). Climate variables and latitude were typically the most strongly associated with influenza
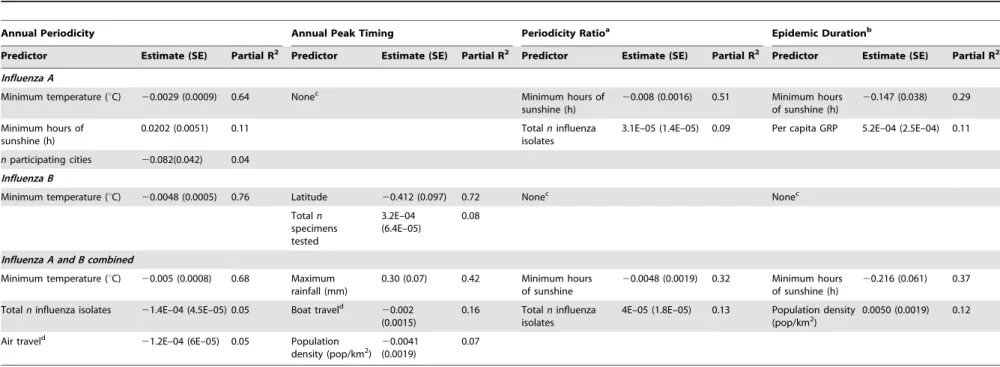
seasonal characteristics. In particular, stronger annual amplitude of epidemics was associated with lower minimum temperature, for all viruses combined and analyses stratified by influenza type (range across models for different influenza outcomes, R2= 64%– 76%,p,0.001). Stronger semi-annual cycles and longer epidemic durations were associated with lower minimum amounts of sunshine (R2= 32%–51%, p= 0.01), for all influenza and influenza A. Predictors of influenza peak timing were more diverse, with maximum amount of rainfall explaining later influenza activity in spring months for all viruses combined. In contrast, earlier timing of influenza B was strongly associated with higher latitude (R2= 72%, p,0.0001); while there was no relationship for influenza A. Mobility patterns were weakly but significantly associated with total influenza seasonal characteris-tics, explaining 5%–16% of the variance in peak timing and annual periodicity, while population density explained 7%–12% of peak timing and duration. No predictor was identified for influenza A peak timing or for influenza B duration and periodicity ratio. Variables related to surveillance design and sampling intensity explained less than 13% of the variance in seasonal characteristics in best-fit models, a typically lower proportion than climatic variables.
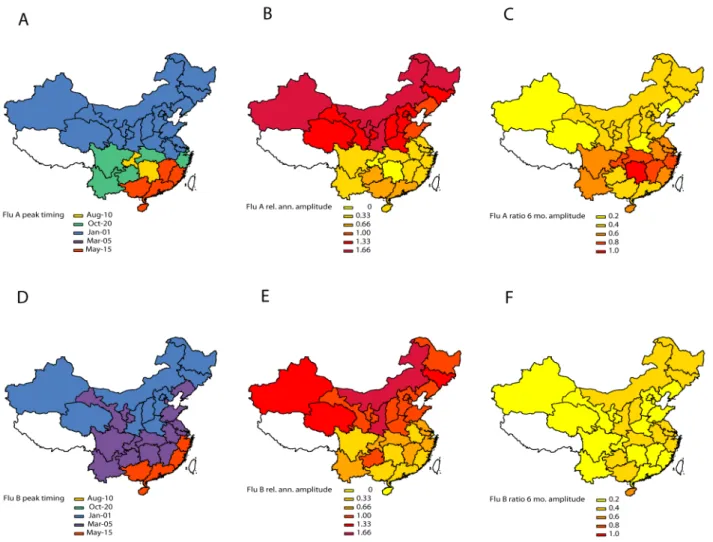
Figure 3. Estimates of periodicity and timing of influenza A (top panels) and B (bottom panels) epidemics in China.(Left) Timing of annual influenza peaks, in weeks. Timing is color coded by season. (Center) Amplitude of annual periodicity, ranging from low (yellow) to high (red), as indicated in the legend. Amplitude is relative to the mean of the weekly influenza time series in each province. (Right) Importance of semi-annual periodicities, measured by the ratio of the amplitude of the semi-annual periodicity to the sum of the amplitudes of annual and semi-annual periodicities. Yellow indicates strongly annual influenza epidemics, while red indicates marked semi-annual activity. See also Figure 4.
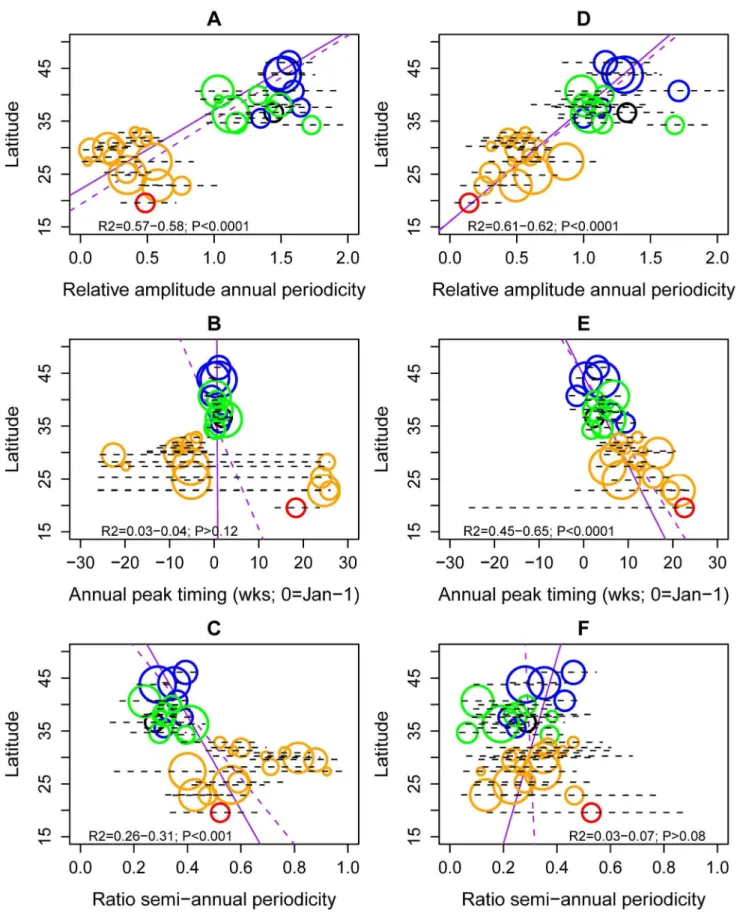
Figure 4. Latitudinal gradients in seasonality of influenza A and B epidemics in China.Plots represent estimates of seasonal parameters as a function of latitude for influenza A (left panels) and influenza B (right panels). Top panels: Amplitude of annual periodicity, relative to the mean standardized influenza time series. Middle panels: Peak timing in weeks. Bottom panels: Contribution of the semi-annual cycle, measured by the ratio of the amplitude of the semi-annual cycle to the sum of the amplitudes of annual and semi-annual cycles. Open circles represent point estimates from seasonal regression models and horizontal dashed lines represent 95% confidence intervals based on 1,000 block-bootstrap samples. Symbol Influenza Seasonality in China
Defining Broad Influenza Epidemiological Regions Relevant for Vaccination
Next, we identified broad regions that share similar influenza epidemiology and could be used in the design of geographically-tailored immunization campaigns. Although our results suggest differences in the seasonality of influenza by virus type, vaccine policies are typically set on the basis of the sum of influenza A and B activity. Hence we applied hierarchical clustering algorithms to province-level time series for influenza A and B combined in the main analysis (Figure 6) and present type-specific regions in Figure S7 and Text S1. The analysis of total influenza activity revealed two main regions that aligned with broad climatic zones (northern temperate versus southern [sub]tropical provinces; Figure 6A and 6B). Within the cluster of southern provinces (n= 15), we identified two subclusters coinciding with the mid-latitude region that experienced semi-annual influenza activity (n= 10), and the southernmost region where influenza activity was concentrated in spring (n= 5).
The same approach stratified by virus type revealed similar regions for influenza A than for total influenza; while influenza B regions were more different and less climatologically structured (Figure S7). We also considered alternative clustering and distance methods (Figure S8): overall the separation between mid-latitude provinces and southernmost provinces was consistent across algorithms. Two mid-latitude provinces however, Chongqing and Guizhou, did not consistently cluster in the same
epidemio-logical group, suggesting that more information will be needed from these provinces.
Stepwise discriminant analysis of the two main influenza epidemiological clusters revealed that winter minimum tempera-ture and relative humidity were the two strongest predictors of whether influenza exhibited winter seasonality (north) or more complex seasonal patterns (south) (Figure 6C). The predictive accuracy of discriminant models including these two climatic variables was 100% by leave-one-out cross-validation. Discrimi-nant analysis restricted to the two southern subclusters indicated that maximum rainfall and minimum winter temperature were predictive of influenza seasonality differences in this region. Rainier and warmer provinces experienced a dominant annual influenza peak in spring (Figure 6D) with 93% predictive accuracy of discriminant models by leave-one-out cross-validation. None of the other climate, population, or mobility factors were significantly associated with influenza epidemiological clusters.
Discussion
To our knowledge, this is the first comprehensive study of influenza seasonal characteristics by virus type and geography in China. On the basis of multiyear laboratory-confirmed influenza surveillance data representative of a large majority of the Chinese population, we identified three epidemiological regions character-ized by distinct seasonality: northern provinces (latitudes.33uN) experience winter epidemics, southernmost provinces (latitude
,27uN) experience peak activity in spring, while provinces at intermediate latitudes experience semi-annual epidemic cycles. Two complementary statistical approaches indicated that cold temperatures were predictive of the occurrence of influenza in winter in the north and of the strength of the annual periodicity, with some contributing effect of relative humidity, while precip-itations were linked to influenza activity in spring in Southern China. These marked geographic differences in influenza season-ality are important to consider for routine influenza immunization campaigns in China, as they entail different timings of vaccination, and use of potentially different vaccine compositions.
China is a large country encompassing a diversity of climatic zones and hence it is perhaps not surprising that our results support a diversity of influenza seasonal patterns. The latitudinal gradients in timing, amplitude, and duration of influenza activity evidenced in this study are reminiscent of those reported in another large country, Brazil, where epidemics originate in the northern equatorial states and move towards the subtropical south over a 3-month period [26]. Similar gradients have been observed on a global scale [3,34].
The epidemiology of influenza in China and Brazil [26] contrasts with the hierarchical spread of the disease in the US, where winter epidemics are driven by large population centers and typically highly synchronized, including in a subtropical city like Miami (latitude 25uN) [27]. It is likely that influenza seasonality results from the combined effect of climate factors and population mobility patterns [8,26,35], with potentially higher population mixing within the US than within Brazil or China. We did not find a strong association between seasonality and mobility patterns in our Chinese study, although our travel data did not include international statistics. Further evidence for the role of population size is proportional to the average number of influenza virus isolates sampled each season, while colors represent different climatic zones (black, cold-temperate; blue, mid-temperate; green, warm-temperate; orange, subtropical; red, tropical). Purple lines represent linear regression of seasonal parameters against latitude (dashed line, unweighted regression; solid line, regression weighted by the inverse of the variance of province-specific seasonal estimates); R2andp-values are indicated on the graphs.
doi:10.1371/journal.pmed.1001552.g004
Figure 5. Latitudinal gradient in the dominance of influenza B in China, measured by the proportion of influenza B among all influenza positive isolates each season. Median proportion of influenza B over seven seasons is displayed for each province, with grey horizontal bars indicating 62 standard deviations. Symbol size is proportional to the average number of influenza virus isolates sampled each season. Colors represent different climatic zones (black, cold-temperate; blue, mid-cold-temperate; green, warm-cold-temperate; orange, subtropical; red, tropical). Purple lines represent linear regression of influenza B proportion against latitude (dashed line, unweighted regression; solid line, regression weighted by sample size).
Table 2.Predictors of influenza seasonal characteristics by virus type (influenza A, B, and total) in 30 Chinese provinces, 2005–2011.
Annual Periodicity Annual Peak Timing Periodicity Ratioa Epidemic Durationb
Predictor Estimate (SE) Partial R2 Predictor Estimate (SE) Partial R2 Predictor Estimate (SE) Partial R2 Predictor Estimate (SE) Partial R2
Influenza A
Minimum temperature (uC) 20.0029 (0.0009) 0.64 Nonec Minimum hours of
sunshine (h)
20.008 (0.0016) 0.51 Minimum hours of sunshine (h)
20.147 (0.038) 0.29
Minimum hours of sunshine (h)
0.0202 (0.0051) 0.11 Totalninfluenza
isolates
3.1E–05 (1.4E–05) 0.09 Per capita GRP 5.2E–04 (2.5E–04) 0.11
nparticipating cities 20.082(0.042) 0.04
Influenza B
Minimum temperature (uC) 20.0048 (0.0005) 0.76 Latitude 20.412 (0.097) 0.72 Nonec Nonec
Totaln
specimens tested
3.2E–04 (6.4E–05)
0.08
Influenza A and B combined
Minimum temperature (uC) 20.005 (0.0008) 0.68 Maximum rainfall (mm)
0.30 (0.07) 0.42 Minimum hours of sunshine
20.0048 (0.0019) 0.32 Minimum hours of sunshine (h)
20.216 (0.061) 0.37
Totalninfluenza isolates 21.4E–04 (4.5E–05) 0.05 Boat traveld
20.002 (0.0015)
0.16 Totalninfluenza isolates
4E–05 (1.8E–05) 0.13 Population density (pop/km2)
0.0050 (0.0019) 0.12
Air traveld
21.2E–04 (6E–05) 0.05 Population
density (pop/km2) 2
0.0041 (0.0019)
0.07
Putative predictors include climate, geographic, population, and sampling factors. Seasonal characteristics were based on linear seasonal regression models fitted to province-specific weekly laboratory surveillance data (Figure 4). Point estimates and standard errors provided in the table are based on hierarchical Bayesian regression of seasonal characteristics against province-specific covariates, with observation variances estimated by bootstrap resampling of seasonal parameters.
aAmplitude of semi-annual cycle divided by the sum of amplitudes of semi-annual and annual cycles. b5% threshold criterion.
cNo covariate remained in final model.
dAnnual number of passengers leaving or entering the province, divided by province-specific population size.
doi:10.1371/journal.pmed.1001552.t002
Influenza
Seasonali
ty
in
China
PLOS
Medicine
|
www.plosm
edicine.org
10
November
2013
|
Volume
10
|
Issue
11
|
mobility comes from the disconnect between influenza seasonality in neighboring regions sharing similar climate [35], including Hong-Kong, Special Administrative Region, which experiences semi-annual cycles [36], and Guangdong, China, where influenza activity peaks in the spring (this study and [37]). A recent phylogeographic comparison of influenza viruses circulating in Southern China did not reveal extensive viral migrations between these two locales [37], suggesting that mixing is perhaps not sufficient to synchronize epidemics. Similarly, analysis of historical influenza time series from Iceland highlights the importance of international connectivity in driving the timing and periodicity of epidemics [38].
As with previous large-scale analyses linking influenza and climatic drivers [2,8], no single climatic variable captured the complexity of influenza seasonality patterns across China. However, minimum temperature, humidity, and precipitations helped distinguish between annual activity in winter or spring, and more complex seasonal patterns. The latitudinal threshold associated with influenza winter seasonality in our data, estimated at,33uN, is equivalent to minimum winter temperature threshold
of,0uC. A recent climate-based model for influenza seasonality,
derived from a much larger global sample of epidemiologic data, has proposed a different threshold at 18uC–21uC [8]. Further research should focus on whether local or regional factors beyond
climate may affect influenza seasonality and should be incorpo-rated in global models such as [8].
Our most intriguing finding was perhaps the marked differences in seasonality of influenza A and B viruses, with most of China experiencing annual influenza B activity in winter. This is the first report of such distinct epidemiological patterns in influenza A and B activity, although it has been noted previously that influenza B epidemics peak a few weeks later than influenza A epidemics on average in temperate regions [34]. Further, local studies have hinted at differences in the association between influenza and climate by virus type, including in Dakar, Senegal [39]. Experimental studies indicate that both influenza A and B transmit via aerosols and droplets, with colder temperature increasing duration of viral shedding and transmission of both viruses [40,41]. The intriguing seasonality differences observed at the population level in our study could be driven by differences in mean age at infection, immunity, or persistence patterns between influenza A and B viruses [42–45].
The motivation for our study was to assist on-going efforts to strengthen influenza surveillance and research in China and develop a national immunization program. Substantial antibody titers decay within 4–8 months post-vaccination [46,47], com-bined with rapid antigenic drift in circulating viruses [48], require vaccination campaigns to be initiated a few weeks prior to the
onset of local influenza activity. A practical outcome of our study was to define three broad influenza regions on the basis of epidemiological data (Figure 6B), which have distinct influenza seasonality characteristics and broadly align with climatic zones. Optimization of vaccine policy in China is complicated by differences in seasonality of influenza A and B, especially in the southern region, so that it may not be possible for a single annual influenza vaccination campaign to offer optimal protection for both virus types. Influenza A represented 74% of all influenza viruses in our dataset, and hence it is not surprising that seaso-nality patterns aligned broadly for total influenza and influenza A activity. More refined type-specific vaccine policies could be defined on the basis of province-specific information on the relative dominance and disease burden of each virus. Interestingly, recent work indicates a higher excess mortality burden of influenza B epidemics in China, relative to that in other countries [11,15]; however the underlying biological mechanism remains unclear and province-specific burden estimates are lacking.
In this context, our data indicate that it is optimal for Northern China to follow the timing of vaccination typically recommended for the Northern Hemisphere, with annual campaigns starting in October. In contrast, southernmost Chinese provinces have to accommodate influenza activity peaking in April–June, and hence vaccination would be best initiated in February–March of each year, broadly coinciding with the recommended timing of vaccination for the Southern Hemisphere. The relevance of using vaccine recommendations for the opposite hemisphere in some regions has previously been demonstrated in the case of Brazil [9]. The situation of mid-latitude Chinese provinces is more complex due to semi-annual patterns of influenza A activity and longer epidemic periods. While the results of hierarchical clustering and sensitivity analyses suggest that mid-latitude provinces should be considered separately from southernmost China (p,1029 for seasonality differences between Guangdong and Guangxi provinces and other southern provinces in mixed models; Text S1), denser sampling over a longer time period could help further clarify the most sensible geographic breakdown. Of note, we were unable to robustly classify seasonal patterns in two mid-latitude provinces, Chongqing and Guizhou, perhaps due to low sample size, spatial aggregation, or border effects. More epidemiological data will be needed before a specific timing of vaccination can be recommended for these provinces. Other locales in the broader region have adopted the Northern Hemisphere vaccine [10], including Singapore, Vietnam, and Hong-Kong SAR, and a quantitative evaluation of vaccination strategies could be beneficial in areas experiencing semi-annual or year-round influenza circulation. Increased regional capacity for vaccine production in east Southeast Asia [10] provides a unique opportunity to design local vaccination strategies, rather than relying on traditional geographic divisions between Northern and Southern Hemisphere countries.
In China, seasonal influenza vaccination was introduced in 1998, with four international and ten domestic manufacturers now supplying trivalent inactivated vaccine to the Chinese market. Vaccine coverage has increased over time but it is still relative low at around 2% nationally [16]. With rapid economic development, we anticipate a rapid increase of influenza vaccine use in the private sector in the near future in China. Several wealthy cities have already introduced local government subsidy programs. In particular, Beijing has provided free annual influenza vaccination since 2007 to adults.60 y and school-age children, while Xi’an City in Shaanxi province and Ningbo City in Zhejiang province have provided annual influenza vaccines through government health insurance since 2004 and 2010, respectively. Vaccine
coverage is expected to rise substantially with increasing data on national- and province-specific influenza disease burden [11,15], seasonality, cost-effectiveness, and initiation of national and provincial-level immunization programs.
Our study is prone to a number of limitations. Our results are based on a relatively short period of time, 2005–2011, which limited our ability to capture multiyear influenza periodicities. Sampling intensity was not constant throughout time and could have affected our results, although data standardization and sensitivity analyses suggest this was not a major issue. Since a fraction of the northern provinces did not conduct year-round surveillance before 2009, it would be useful to revisit seasonality patterns in key provinces bordering the 33uN latitude threshold with longer year-round surveillance time series.
Our dataset was too coarse to evaluate influenza patterns at the city or hospital level. However, surveillance data were based on a single city for five of the 30 studied provinces (including two northern and three southern provinces; Table 1), and hence influenza surveillance in these five provinces is not subject to aggregation issues. In particular, two of these ‘‘single-city’’ provinces, Beijing and Tianjin, are immediate neighbors with nearly identical influenza patterns, suggesting that surveillance information from this dataset is robust and captures true geographical differences in disease dynamics. Since most of the influenza information came from relatively large cities, however, we were unable to assess the finer details of influenza spatial transmission, including potential differences between rural and urban areas. Previous work suggests that influenza activity in rural areas of Western China is generally synchronous with that of the more populous Eastern coastal areas [18].
We chose to exclude information pertaining the 2009 pandemic period to focus on the seasonality of inter-pandemic influenza, and it is unclear how the emergence of the pandemic virus perturbed seasonality of the resident (sub)types. However, sensitivity analyses limited to data from the pre-pandemic period confirmed our findings (not shown). Another caveat is the lack of information on influenza A/H1N1 seasonality, as sampling was too thin to explore A/H3N2 and A/H1N1 viruses separately, and the patterns reported here for influenza A reflect those of the dominant A/ H3N2 subtype.
We have provided here a statistical description of influenza seasonality in China to inform timing of vaccination, using a two-stage approach used in past research to characterize the circulation of influenza and other infections in large regions and assess potential links with climate [2,26,49–51]. Our approach improves on previous work by integrating uncertainty in seasonal estimates obtained in the first stage analysis in hierarchical Bayesian models. However, our relatively simple seasonal models (see also [4]) explain only a fraction of the variance in weekly influenza surveillance data (typically#50% for influenza A and
#30% for influenza B). Year-to-year variability in influenza epidemiology, complex virus circulation patterns specific to China, and sampling issues, may all contribute to weak model fit. Further, there was residual auto-correlation in some of our province-specific models, although auto-correlation was taken into account in error estimates via a block-bootstrap approach.
Further work could focus on fitting compartmental transmission model to evaluate the transmissibility of the virus in different regions of China, and assess differences in herd immunity thresholds for vaccination. Interestingly, the effective reproduction number of influenza is thought to be relatively similar between temperate and tropical countries, ranging from 1.1–1.4 [52], suggesting that background immunity and transmission dynamics are broadly similar across regions (although it likely varies between Influenza Seasonality in China
years [53]). Overall, more modeling work is needed to evaluate regional differences in the evolutionary and transmission dynamics of influenza and their association with climate and demographic factors [3,8,18,54–56].
Conclusion
In conclusion, our study uncovered intriguing differences in influenza seasonality between regions and virus types in China, some of which can be associated with climatic factors, and confirm previous reports from other regions [3,26]. Further work should focus on quantifying the balance between climatic drivers, population mixing, and other factors affecting influenza season-ality patterns globally, which could differ by virus types and subtypes. Our work has practical implications for the design of routine immunization programs in China, and suggests the need for staggered timing of vaccination in three broad epidemiological regions. Further surveillance studies are warranted to confirm these seasonality patterns and assess the match between influenza strains circulating in different provinces and WHO vaccine recommendations [18]. As routine immunization campaigns are rolled out and local vaccine production improves in resource-limited regions, it will become increasingly important to ensure that vaccination strategies are optimally tailored to the local epidemiology of the disease.
Supporting Information
Figure S1 Fit of type-specific seasonal influenza models in three provinces representative of broad influenza
epidemiological regions in China.Shanxi (latitude 37.8uN,
northern temperate province experiencing winter seasonal influ-enza A and B epidemics), Hubei (latitude 30.9uN, mid-latitude subtropical province experiencing semi-annual influenza A epidemics), and Guangdong (22.9uN, southern subtropical prov-ince experiencing late spring influenza A epidemics). Blue curve, observed cases standardized by the annual number of specimens tested; red curve, seasonal model. Grey lines mark Jan 1st of each year, while the green lines mark the 2009 A/H1N1 pandemic season, which was not included in the model fitting procedure. Model is based on a linear regression with harmonic terms for annual and semi-annual periodicities.
(TIFF)
Figure S2 Residuals of seasonal models presented in Figure S1 in three selected provinces.
(TIF)
Figure S3 Estimates of periodicity and timing of
influenza epidemics in China (A and B combined).(Left)
Timing of annual influenza peaks, in weeks. Timing is color coded by season. (Center) Amplitude of annual periodicity, ranging from low (yellow) to high (red), as indicated in the legend. Amplitude is relative to the mean of the weekly influenza time series in each province. (Right) Importance of semi-annual periodicities, mea-sured by the ratio of the amplitude of the semi-annual periodicity to the sum of the amplitudes of annual and semi-annual periodicities. Yellow indicates strongly annual influenza epidemics, while red indicates marked semi-annual activity. See also Figure S4.
(TIF)
Figure S4 Latitudinal gradients in seasonality of total
influenza activity (A and B combined) in China. Left:
Relative amplitude of annual periodicity. Middle: Peak timing. Right: Contribution of the semi-annual cycle, measured by the ratio of the amplitude of the semi-annual cycle to the sum of the
amplitudes of annual and semi-annual cycles. Open circles represent point estimates from seasonal regression models and horizontal dashed lines represent 95% confidence intervals based on 1,000 block-bootstrap samples. Purple lines represent linear regression of seasonal parameters against latitude (dashed line, unweighted regression; solid line, regression weighted by the inverse of the variance of province-specific seasonal estimates); R2 and p-values are indicated on the graphs. Colors represent different climatic zones (black, cold-temperate; blue, mid-temper-ate; green, warm-tempermid-temper-ate; orange, subtropical; red, tropical). (TIFF)
Figure S5 Sensitivity analysis on seasonal estimates for influenza A (top) and B (bottom) using a different model
structure.Same as Figure 4 but using a logistic seasonal model
with binomial errors to model weekly percent positive for influenza A and B (weekly number of influenza positive/weekly number of specimens tested). Left: Relative amplitude of annual periodicity. Middle: Peak timing. Right: Contribution of the semi-annual cycle, measured by the ratio of the amplitude of the semi-annual cycle to the sum of the amplitudes of annual and semi-annual cycles. Open circles represent point estimates from seasonal regression models. Purple lines represent linear regression of seasonal parameters against latitude;p-values are indicated on the graphs. Colors represent different climatic zones (black, cold-temperate; blue, mid-cold-temperate; green, warm-cold-temperate; orange, subtropical; red, tropical).
(TIF)
Figure S6 Latitudinal gradient in duration of influenza
epidemics, by province and virus type.Duration is based
on a relative measure (number of weeks with more than 2.5% of annual influenza virus isolated), or an absolute measure (number of weeks with more than 5% influenza percent positive). Top panels: influenza A and B combined; middle panels: influenza A; bottom panels: influenza B. Horizontal grey bars represent62 standard deviations based on inter-annual variability in the 7 study years.
(TIF)
Figure S7 Influenza A (top) and B (bottom)
epidemio-logical regions identified by cluster analysis.
Epidemio-logical regions are based on hierarchical clustering (Ward’s method), using the Euclidian distance between weekly standard-ized influenza time series. Provinces are color-coded by climatic region (black, cold-temperate; blue, mid-temperate; green, warm-temperate; orange, subtropical; red, tropical).
(TIFF)
Figure S8 Sensitivity analyses on cluster algorithms used to define influenza epidemiological regions
(com-pare with Figure 6).Top: using a different distance metric for
pairwise differences between influenza time series (absolute distance, also known as Manhattan distance, instead of Euclidian distance). Bottom: using a different clustering algorithm (complete linkage instead of Ward). Analyses are based on total influenza activity. (TIFF)
Text S1 Description of supplementary information.
(DOC)
Acknowledgments
authors are also indebted to Vivek Charu, Fogarty International Center, for generous help with Bayesian hierarchical models.
Author Contributions
Conceived and designed the experiments: HY WA CV. Performed the experiments: WA CV. Analyzed the data: LF YT WA CV. Contributed
reagents/materials/analysis tools: YS WY. Wrote the first draft of the manuscript: CV. Contributed to the writing of the manuscript: HY WA YT LF YS WY CV. ICMJE criteria for authorship read and met: HY WA YT LF YS WY CV. Agree with manuscript results and conclusions: HY WA YT LF YS WY CV.
References
1. Viboud C, Alonso WJ, Simonsen L (2006) Influenza in tropical regions. PLoS Med 3: e89. doi:10.1371/journal.pmed.0030089
2. Azziz Baumgartner E, Dao CN, Nasreen S, Bhuiyan MU, Mah EMS, et al. (2012) Seasonality, timing, and climate drivers of influenza activity worldwide. J Infect Dis 206: 838–846.
3. Bloom-Feshbach K, Alonso WJ, Charu V, Tamerius J, Simonsen L, et al. (2012) Latitudinal variations in seasonal activity of influenza and respiratory syncytial virus (RSV): a global comparative review. PLoS One 8: e54445. doi:10.1371/ journal.pone.0054445
4. Zou J, Yang H, Cui H, Shu Y, Xu P, et al. (2013) Geographic divisions and modeling of virological data on seasonal influenza in the Chinese mainland during the 2006–2009 monitoring years. PLoS One 8: e58434. doi:10.1371/ journal.pone.0058434
5. Shaman J, Goldstein E, Lipsitch M (2011) Absolute humidity and pandemic versus epidemic influenza. Am J Epidemiol 173: 127–135.
6. Shaman J, Kohn M (2009) Absolute humidity modulates influenza survival, transmission, and seasonality. Proc Natl Acad Sci U S A 106: 3243–3248. 7. Shaman J, Pitzer VE, Viboud C, Grenfell BT, Lipsitch M (2010) Absolute
humidity and the seasonal onset of influenza in the continental United States. PLoS Biol 8: e1000316. doi:10.1371/journal.pbio.1000316
8. Tamerius J, Shaman J, Alonso WJ, Bloom-Feshbach K, Uejio CK, et al. (2012) Environmental predictors of seasonal influenza epidemics across temperate and tropical climates. PLoS Pathog 9: e1003194. doi:10.1371/journal.ppat.1003194 9. de Mello WA, de Paiva TM, Ishida MA, Benega MA, Dos Santos MC, et al. (2009) The dilemma of influenza vaccine recommendations when applied to the tropics: the Brazilian case examined under alternative scenarios. PLoS One 4: e5095. doi:10.1371/journal.pone.0005095
10. Gupta V, Dawood FS, Muangchana C, Lan PT, Xeuatvongsa A, et al. (2012) Influenza vaccination guidelines and vaccine sales in southeast Asia: 2008–2011. PLoS One 7: e52842. doi:10.1371/journal.pone.0052842
11. Feng L, Shay DK, Jiang Y, Zhou H, Chen X, et al. (2012) Influenza-associated mortality in temperate and subtropical Chinese cities, 2003–2008. Bull World Health Organ 90: 279–288B.
12. Cohen C, Simonsen L, Kang JW, Miller M, McAnerney J, et al. (2010) Elevated influenza-related excess mortality in South African elderly individuals, 1998– 2005. Clin Infect Dis 51: 1362–1369.
13. Cohen C, Simonsen L, Sample J, Kang JW, Miller M, et al. (2012) Influenza-related mortality among adults age 25–54 years with AIDS in South Africa and the United States of America. Clin Infect Dis 55: 996–1003.
14. Homaira N, Luby SP, Alamgir AS, Islam K, Paul R, et al. (2012) Influenza-associated mortality in 2009 in four sentinel sites in Bangladesh. Bull World Health Organ 90: 272–278.
15. Yu H, Feng L, Viboud CG, Shay DK, Jiang Y, et al. (2013) Regional variation in mortality impact of the 2009 A(H1N1) influenza pandemic in China. Influenza Other Respi Viruses. In press.
16. Feng L, Mounts AW, Feng Y, Luo Y, Yang P, et al. (2010) Seasonal influenza vaccine supply and target vaccinated population in China, 2004–2009. Vaccine 28: 6778–6782.
17. Shu YL, Fang LQ, de Vlas SJ, Gao Y, Richardus JH, et al. (2010) Dual seasonal patterns for influenza, China. Emerg Infect Dis 16: 725–726.
18. Du X, Dong L, Lan Y, Peng Y, Wu A, et al. (2012) Mapping of H3N2 influenza antigenic evolution in China reveals a strategy for vaccine strain recommen-dation. Nat Commun 3: 709.
19. Chinese Center for Disease Control and Prevention (2010) Influenza sentinel surveillance protocol (2005–2010). Available: http://www.chinacdc.cn/jkzt/ crb/lxxgm/jc/200509/t20050908_24127.htm
20. National Bureau of Statistics of China (2011) China Statistical Yearbook. Beijing: China Statistics Press.
21. Garske T, Yu H, Peng Z, Ye M, Zhou H, et al. (2011) Travel patterns in China. PLoS One 6: e16364. doi:10.1371/journal.pone.0016364
22. National Meteorological Information Center CMACMDSSS (2012) Available: http://cdc.cma.gov.cn/
23. Zheng J, Yin Y, Li B (2010) A new scheme for climate regionalization in China. Acta Geographica Sinica 65: 3–13.
24. Broutin H, Viboud C, Grenfell BT, Miller MA, Rohani P (2010) Impact of vaccination and birth rate on the epidemiology of pertussis: a comparative study in 64 countries. Proc Biol Sci 277: 3239–3245.
25. Zhou H, Thompson W, Viboud C, Ringholz C, Cheng P-Y, et al. (2012) Hospitalizations associated with influenza and respiratory syncytial virus in the United States, 1993--2008. Clin Infect Dis 54:1427–1436.
26. Alonso WJ, Viboud C, Simonsen L, Hirano EW, Daufenbach LZ, et al. (2007) Seasonality of influenza in Brazil: a traveling wave from the Amazon to the subtropics. Am J Epidemiol 165: 1434–1442.
27. Viboud C, Bjornstad ON, Smith DL, Simonsen L, Miller MA, et al. (2006) Synchrony, waves, and spatial hierarchies in the spread of influenza. Science 312: 447–451.
28. Naumova EN, Jagai JS, Matyas B, DeMaria A, Jr., MacNeill IB, et al. (2007) Seasonality in six enterically transmitted diseases and ambient temperature. Epidemiol Infect 135: 281–292.
29. Rogers DJ, Hay SI, Packer MJ (1996) Predicting the distribution of tsetse flies in West Africa using temporal Fourier processed meteorological satellite data. Ann Trop Med Parasitol 90: 225–241.
30. Thompson WW, Shay DK, Weintraub E, Brammer L, Cox N, et al. (2003) Mortality associated with influenza and respiratory syncytial virus in the United States. JAMA 289: 179–186.
31. Ward JH (1963) Hierarchical grouping to optimize an objective function. J Am Stat Assoc 58: 236–244.
32. Sze´kely GJ, Rizzo ML (2005) Hierarchical clustering via joint between-within distances: extending ward’s minimum variance method. J Classif 22: 151–183. 33. (2012) Cluster package in R. Available: http://cran.r-project.org/web/
packages/cluster/cluster.pdf
34. Finkelman BS, Viboud C, Koelle K, Ferrari MJ, Bharti N, et al. (2007) Global patterns in seasonal activity of influenza A/H3N2, A/H1N1, and B from 1997 to 2005: viral coexistence and latitudinal gradients. PLoS One 2: e1296. doi:10.1371/journal.pone.0001296
35. Western Pacific Region Global Influenza Surveillance and Response System (2012) Epidemiological and virological characteristics of influenza in the Western Pacific Region of the World Health Organization, 2006–2010. PLoS One 7: e37568. doi:10.1371/journal.pone.0037568
36. Yang L, Wong CM, Lau EH, Chan KP, Ou CQ, et al. (2008) Synchrony of clinical and laboratory surveillance for influenza in Hong Kong. PLoS One 3: e1399. doi:10.1371/journal.pone.0001399
37. Cheng X, Tan Y, He M, Lam TT, Lu X, et al. (2012) Epidemiological dynamics and phylogeography of influenza in southern China. J Infect Dis.
38. Weinberger DM, Grove Krause TG, Molbak K, Cliff AD, Briem H, et al. (2012) Influenza epidemics in Iceland over nine decades: Changes in timing and synchrony with the United States and Europe. Am J Epidemiol 207: 106–114. 39. Dosseh A, Ndiaye K, Spiegel A, Sagna M, Mathiot C (2000) Epidemiological and virological influenza survey in Dakar, Senegal: 1996–1998. Am J Trop Med Hyg 62: 639–643.
40. Lowen AC, Mubareka S, Steel J, Palese P (2007) Influenza virus transmission is dependent on relative humidity and temperature. PLoS Pathog 3: 1470–1476. doi:10.1371/journal.ppat.0030151
41. Pica N, Chou YY, Bouvier NM, Palese P (2012) Transmission of influenza B viruses in the guinea pig. J Virol 86: 4279–4287.
42. Chen R, Holmes EC (2008) The evolutionary dynamics of human influenza B virus. J Mol Evol 66: 655–663.
43. Kelly HA, Grant KA, Williams S, Fielding J, Smith D (2009) Epidemiological characteristics of pandemic influenza H1N1 2009 and seasonal influenza infection. Med J Aust 191: 146–149.
44. Olson DR, Heffernan RT, Paladini M, Konty K, Weiss D, et al. (2007) Monitoring the impact of influenza by age: emergency department fever and respiratory complaint surveillance in New York City. PLoS Med 4: e247. doi:10.1371/journal.pmed.0040247
45. Yu H, Huang J, Huai Y, Guan X, Klen J, et al. (2013) The substantial hospitalization burden of influenza in central China: surveillance for severe, acute respiratory infection and influenza viruses, 2010–2012. Influenza Other Respi Viruses. In press
46. Wright PF, Sannella E, Shi JR, Zhu Y, Ikizler MR, et al. (2008) Antibody responses after inactivated influenza vaccine in young children. Pediatr Infect Dis J 27: 1004–1008.
47. Ochiai H, Shibata M, Kamimura K, Niwayama S (1986) Evaluation of the efficacy of split-product trivalent A(H1N1), A(H3N2), and B influenza vaccines: reactogenicity, immunogenicity and persistence of antibodies following two doses of vaccines. Microbiol Immunol 30: 1141–1149.
48. Smith DJ, Lapedes AS, de Jong JC, Bestebroer TM, Rimmelzwaan GF, et al. (2004) Mapping the antigenic and genetic evolution of influenza virus. Science 305: 371–376.
49. Tamerius J, Nelson MI, Zhou SZ, Viboud C, Miller MA, et al. (2011) Global influenza seasonality: reconciling patterns across temperate and tropical regions. Environ Health Perspect 119: 439–445.
50. Patel MM, Pitzer V, Alonso WJ, Vera D, Lopman BA, et al. (2012) Global seasonality of Rotavirus disease. Pediatr Infect Dis J 32: e134–147.
51. Alonso WJ, McCormick BJ (2012) EPIPOI: a user-friendly analytical tool for the extraction and visualization of temporal parameters from epidemiological time series. BMC Public Health 12: 982.
Influenza Seasonality in China
52. Chowell G, Viboud C, Simonsen L, Miller M, Alonso WJ (2010) The reproduction number of seasonal influenza epidemics in Brazil, 1996–2006. Proc Biol Sci 277: 1857–1866.
53. Chowell G, Miller MA, Viboud C (2008) Seasonal influenza in the United States, France, and Australia: transmission and prospects for control. Epidemiol Infect 136: 852–864.
54. Opatowski L, Fraser C, Griffin J, de Silva E, Van Kerkhove MD, et al. (2011) Transmission characteristics of the 2009 H1N1 influenza pandemic: comparison
of 8 southern hemisphere countries. Plos Pathogens 7: e1002225. doi:10.1371/ journal.ppat.1002225
55. Bedford T, Cobey S, Beerli P, Pascual M (2010) Global migration dynamics underlie evolution and persistence of human influenza A (H3N2). PLoS Pathog 6: e1000918. doi:10.1371/journal.ppat.1000918