www.nat-hazards-earth-syst-sci.net/10/2527/2010/ doi:10.5194/nhess-10-2527-2010
© Author(s) 2010. CC Attribution 3.0 License.
and Earth
System Sciences
An attempt to model the relationship between MMI attenuation and
engineering ground-motion parameters using artificial neural
networks and genetic algorithms
G-A. Tselentis1and L. Vladutu2
1Seismological Laboratory, University of Patras, RIO 265 04, Patras, Greece 2Mathematics Dept., Dublin City University, Dublin, Republic of Ireland
Received: 23 July 2010 – Accepted: 13 October 2010 – Published: 7 December 2010
Abstract. Complex application domains involve difficult pattern classification problems. This paper introduces a model of MMI attenuation and its dependence on engineering ground motion parameters based on artificial neural networks (ANNs) and genetic algorithms (GAs). The ultimate goal of this investigation is to evaluate the target-region applicability of ground-motion attenuation relations developed for a host region based on training an ANN using the seismic patterns of the host region. This ANN learning is based on supervised learning using existing data from past earthquakes. The combination of these two learning procedures (that is, GA and ANN) allows us to introduce a new method for pattern recognition in the context of seismological applications. The performance of this new GA-ANN regression method has been evaluated using a Greek seismological database with satisfactory results.
1 Introduction
A common problem encountered in engineering seismology involves the difficulty in assessing the damage potential of an earthquake based on the distribution of macroseismic intensity. This parameter is subject to interpretation due to the wide variation in geological conditions, the response of structures, uncertainty related to construction conditions before the earthquake, the type of construction, and population density. Obviously, a physically-based ground-related MMI is required for engineering purposes (Tselentis
Correspondence to:G-A. Tselentis (tselenti@upatras.gr)
and Danciu, 2008; Danciu and Tselentis, 2007). With the advent of instrumental seismology, the relationship between intensity and ground-motion parameters has become a topic of increasing interest.
Instrumental seismology offers the possibility to transform readily observed data (in this case, intensity) into widely-used parameters useful for engineering purposes (in this case, engineering ground-motion measures) and allows seismologists to evaluate historical earthquakes for which no instrumental data are available in order to assess seismic hazard and damages, correlate different intensity scales, and rapidly assess the severity of ground shaking.
Until recently, macroseismic intensity was related most frequently to peak ground acceleration (PGA) because of that parameter’s importance for seismic-resistant design. This is due to the fact that the product of PGA and mass represents the inertial force loading structures (Krinitzsky and Chang, 1988). In recent years, research on earthquake damage prediction has concluded that other ground-motion characteristics such as duration, frequency, and energy content all contribute to structural damage.
Recently, Tselentis and Danciu (2008) derived empirical regression equations for modified Mercalli intensity (MMI) and for various ground-motion parameters such as duration, CAV,Ia, characteristic intensity, Housner’s spectrum inten-sity, and total elastic input energy index.
These relationships have been used to generate maps of estimated shaking intensities within a few minutes of the event based on recorded peak motions. These maps provide a rapid visualisation of the extent of expected damages following an earthquake and can be used for emergency response, loss estimation, and the release of public information through the media.
Another application of engineering ground-motion param-eters involves the development of early warning systems. These systems are low-cost solutions aimed at reducing the seismic risk to vital facilities, such as nuclear power plants, pipelines, and high-speed trains. The ground-motion parameters and the damage potential threshold are essential for these systems.
The objective of the present investigation is to uncover the hidden, complex and often fuzzy relations between the engineering ground-motion parameters and macroseismic intensity and to express these relations in the form of input/output dependencies. The emergence of neural network technology (Haykin, 1999; Bishop, 1996) provides valuable insights for addressing the complicated problem of expression these relations. In this context, neural networks can be viewed as advanced mathematical models used to discover complex correlations between physical process variables from a set of perturbed observations.
2 Engineering seismological parameters
Because structure and equipment damage is measured according to its inelastic deformation, the potential for earthquake damage depends on the time duration of motion, the energy absorption capacity of the structure or equipment, the number of strain cycles, and the energy content of the earthquake. Therefore, for engineering purposes, param-eters that incorporate in their definition these previously-mentioned characteristics are more reliable predictors of an earthquake’s damage potential than parameters related solely to the amplitude of ground motion (such as peak ground acceleration, or PGA), which are often poor indicators of structural damage. The most commonly-used engineering ground-motion parameters in addition to PGA and PGV are Arias intensity (Ia), acceleration response spectrum (Sa), and cumulative absolute velocity (CAV).
Ia, as defined by Arias (1970), is the total energy per unit weight stored by a set of undamped simple oscillators at the end of ground motion. The Arias intensity for ground motion
in the x-direction (IaX), is calculated as follows:
IaX=
2 g
t
Z
0
[aX(t )]2dt, (1)
where aX(t ) is the acceleration time history in the
x direction, andtis the total duration of ground motion. Spectrum acceleration (Sa) is the most common-response spectral parameter and is related to spectrum velocity (Sv) and spectrum displacement (Sd) according to the following expression.
Sa= 2π
T Sv=ωSv=
2π T
Sd=ω2Sd, (2)
whereT is the undamped natural period of a single-degree-of-freedom (SDOF) oscillator.
Cumulative absolute velocity (CAV) is defined as the integral of the absolute value of ground acceleration over the following seismic time-history record.
CAV= t
Z
0
|a(t )|dt, (3)
where|a(t )|is the absolute value of acceleration, andtis the total duration of ground motion.
3 Data set
The strong-motion records used for the present investigation were provided by the European Strong Motion Database (Ambraseys et al., 2004). More details on these data can be found in Danciu and Tselentis (2007). The macroseismic information was available in part from the digital database of the European strong-motion data; it was also separately estimated in part from the macroseismic data provided by the Geodynamic Institute of the National Observatory of Athens (Kalogeras et al., 2004). The general criterion of selecting the appropriate MMI value was to allocate at each station the nearest MMI values within an uncertainty of one unit to every station. If more than one MMI value was observed near the station location, at an equal distance from the station, the average of the values was used (Tselentis and Danciu, 2008). Maps of the reported MMI values together with the strong-motion instrument locations were plotted to show reasonable confidence that the allocated MMI values are within one unit of the assigned value. This approach provides rapid visualisation of the macroseismic distribution in the area surrounding the recording stations and might be an efficient approach to assigning MMI values to minimise errors (Atkinson and Kaka, 2007).
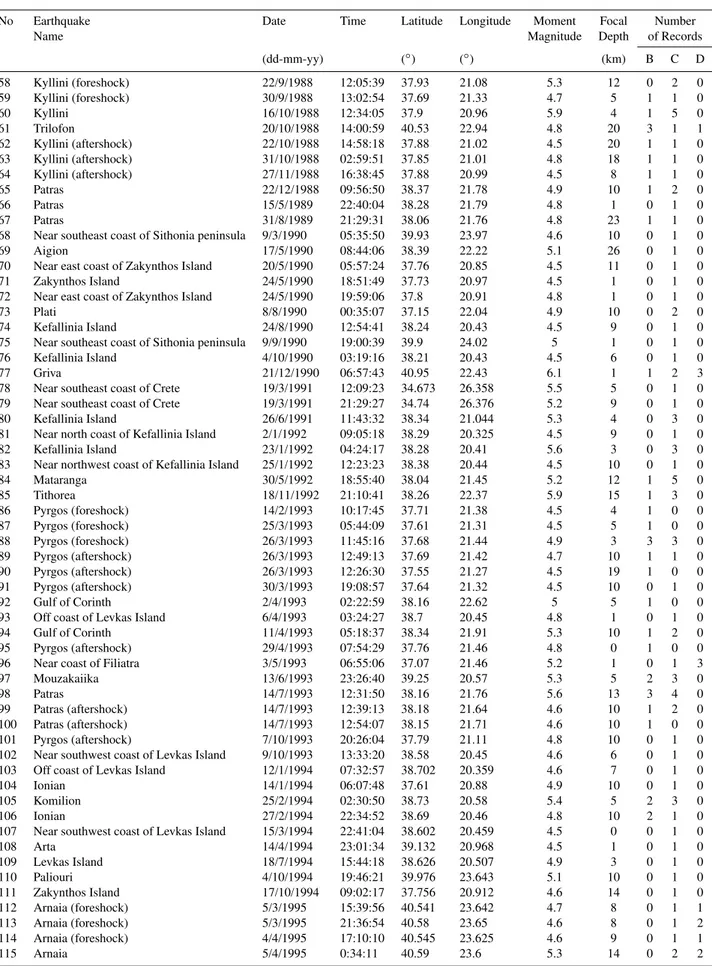
Fig. 1. Epicentral distribution of earthquakes used in the present analysis.
The final data set consists of 310 records from 151 earthquakes and is depicted in Fig. 1 and Table 1. Using the recorded strong-motion data for these earthquakes, for each horizontal component, we compute the previously mentioned engineering seismological parameters. The arithmetic average between the two horizontal components of the independent variables was used for the present investigation.
4 Artificial neural networks
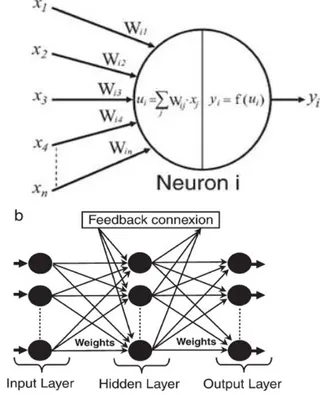
An artificial neural network (ANN) is an information-processing paradigm inspired by the way biological nervous systems such as the brain process information. The most basic element of the human brain involves a specific type of cell that provides us with the ability to remember, think, and apply previous experiences to our every action. These cells are known as neurons. The power of the brain comes from the number of neurons and the multiple connections (or synapses) between them.
Figure 2 shows a simplified view of an ANN. It consists of a network of simple processing elements (that is, artificial neurons) that are organised in several layers, including an input layer that shows the number of neurons linked to the dimensionality of the input, one or several hidden layers, and an output layer. The hidden layer represents network inputs. When one presents the network with a form to be learned, the neurons simultaneously start a state of activity that causes a small modification of the synaptic forces between them. This is followed by a quantitative reconfiguration of all of the synapses: some of them become very strong, while others
Fig. 2. General topology of a feed-forward ANN with one hidden layer.
Fig. 3.Two classical nonlinear activation functions.
become weak. The learned form is not directly memorised at a precise place; it corresponds to a particular energy state of the network, which is a particular configuration of the activity of each neuron, across a very large set of possible configurations. This configuration is supported by the values of the synaptic forces.
LetYjs represent the output of thej-th neuron at layer s; Wi js is the weight connecting thei-th neuron in layer s to the j-th neuron at layer s-1. The neurons have their activation function characterised by a nonlinear function, such as the sigmoid function in Fig. 3. This function maps the output to its input and can be expressed by the following equation.
Yjs=f b+ R
X
i=1
Wj is ·Yis−1 !
(4)
Table 1.Database of strong motion records used.
No Earthquake Date Time Latitude Longitude Moment Focal Number
Name Magnitude Depth of Records
(dd-mm-yy) (◦) (◦) (km) B C D
1 Kefallinia Island 17/9/1972 14:07:12 38.245 20.263 5.6 1 0 0 2
2 Ionian 11/4/1973 15:52:12 38.78 20.55 5.8 7 1 0 0
3 Ionian 11/4/1973 16:11:36 38.76 20.65 4.9 15 1 0 0
4 Patras 29/1/1974 15:12:43 38.3 21.86 4.7 13 1 0 0
5 Amfissa 29/12/1977 16:52:59 38.55 22.35 5.1 10 1 0 0
6 Volvi 7/4/1978 22:23:28 40.7 23.106 5 6 1 0 0
7 Achaia 18/5/1978 00:18:49 38.3 21.79 4.5 26 1 0 0
8 Volvi 20/6/1978 20:03:22 40.729 23.254 6.2 6 3 1 0
9 Almiros (aftershock) 16/7/1980 00:06:58 39.21 22.76 5 12 0 1 0 10 Almiros (aftershock) 26/9/1980 04:19:21 39.27 22.75 4.8 5 0 1 0 11 Almiros (aftershock) 8/11/1980 09:15:59 39.3 22.83 5.2 5 0 1 0
12 Alkion 24/2/1981 20:53:39 38.099 22.842 6.6 10 2 0 0
13 Alkion 25/2/1981 02:35:53 38.135 23.05 6.3 8 1 0 0
14 Panagoula 25/5/1981 23:04:00 38.71 20.95 4.7 15 1 0 0
15 Levkas 27/5/1981 15:04:02 38.79 21.01 5.1 15 1 0 0
16 Preveza 3/10/1981 15:16:20 39.2 20.8 5.4 10 1 1 0
17 Paliambela 4/10/1981 08:33:32 38.91 21.02 4.7 10 1 0 0
18 Kefallinia Island 17/1/1983 12:41:31 37.96 20.26 6.9 5 1 1 0
19 Kefallinia (aftershock) 17/1/1983 15:53:57 38.13 20.49 5.2 11 0 1 0 20 Kefallinia (aftershock) 31/1/1983 15:27:02 38.12 20.49 5.4 4 0 1 0 21 Kyllini (foreshock) 20/2/1983 05:45:12 37.72 21.25 4.9 15 1 1 0
22 Etolia 16/3/1983 21:19:41 38.81 20.89 5.2 25 1 0 0
23 Kefallinia (aftershock) 23/3/1983 19:04:06 38.78 20.81 5.2 25 1 0 0 24 Kefallinia (aftershock) 23/3/1983 23:51:08 38.22 20.41 6.2 3 1 2 0 25 Off coast of Magion Oros peninsula 8/6/1983 15:43:53 40.08 24.81 6.6 22 0 1 2 26 Ierissos (foreshock) 14/6/1983 04:40:43 40.44 23.92 4.5 10 0 1 0
27 Ierissos 26/8/1983 12:52:09 40.45 23.92 5.1 12 0 1 2
28 Near southeast coast of Zakynthos Island 10/4/1984 10:15:12 37.64 20.85 5 6 0 1 0
29 Gulf of Corinth 17/8/1984 21:22:58 38.21 22.68 4.9 24 1 0 0
30 Arnissa 7/9/1984 18:57:12 40.66 21.89 5.2 5 0 1 1
31 Kranidia 25/10/1984 14:38:30 40.13 21.64 5.5 20 0 0 1
32 Kremidia (aftershock) 25/10/1984 09:49:15 36.93 21.76 5 11 0 0 2 33 Gulf of Amvrakikos 22/3/1985 20:38:39 38.99 21.11 4.5 6 0 0 1
34 Anchialos 30/4/1985 18:14:13 39.24 22.89 5.6 13 0 1 1
35 Gulf of Kiparissiakos 9/7/1985 10:20:51 37.24 21.25 5.4 10 0 0 1 36 Near coast of Preveza 31/8/1985 06:03:47 39 20.61 5.2 15 1 2 0
37 Drama 11/9/1985 23:30:43 41.26 23.98 5.2 18 0 2 2
38 Aghios Vasileios 18/2/1986 05:34:42 40.7 23.23 4.8 3 2 1 1
39 Skydra-Edessa 18/2/1986 14:34:04 40.79 22.07 5.3 10 0 1 1
40 Kalamata 13/9/1986 17:24:34 37.1 22.19 5.9 1 1 2 1
41 Kalamata (aftershock) 15/9/1986 11:41:28 37.03 22.13 4.9 12 0 3 1
42 Tsipiana 2/1/1987 05:35:36 37.86 21.77 4.5 20 0 1 0
43 Near northwest coast of Kefallinia Island 27/2/1987 23:34:52 38.46 20.33 5.7 5 1 2 0
44 Dodecanese 10/5/1987 09:27:02 36.29 28.46 5.3 6 0 1 1
45 Kounina 14/5/1987 06:29:11 38.17 22.06 4.6 9 0 1 0
46 Near northeast coast of Crete 2/9/1987 12:28:23 35.41 26.08 4.9 18 0 1 0 47 Kalamata (aftershock) 6/10/1987 14:50:12 37.24 21.48 5.3 30 1 1 1 48 Near southwest coast of Peloponnes 12/10/1987 22:51:14 36.65 21.68 5.2 18 0 0 1 49 Near northeast coast of Rodos Island 25/10/1987 13:02:00 36.3 28.36 5.1 10 0 0 1
50 Astakos 22/1/1988 06:18:55 38.64 21.02 5.1 10 1 0 0
51 Kefallinia Island 6/2/1988 10:35:25 38.32 20.43 4.8 10 0 1 0
52 Gulf of Corinth 4/3/1988 03:56:07 38.08 22.82 4.5 5 0 1 0
53 Ionian 24/4/1988 10:10:33 38.83 20.56 4.8 1 2 0 0
54 Gulf of Corinth 7/5/1988 20:34:52 38.1 22.86 4.9 10 1 1 0
55 Etolia 18/5/1988 05:17:42 38.35 20.47 5.3 26 0 2 1
56 Etolia 22/5/1988 03:44:15 38.35 20.54 5.4 15 2 2 0
Table 1.Continued.
No Earthquake Date Time Latitude Longitude Moment Focal Number
Name Magnitude Depth of Records
(dd-mm-yy) (◦) (◦) (km) B C D
58 Kyllini (foreshock) 22/9/1988 12:05:39 37.93 21.08 5.3 12 0 2 0 59 Kyllini (foreshock) 30/9/1988 13:02:54 37.69 21.33 4.7 5 1 1 0
60 Kyllini 16/10/1988 12:34:05 37.9 20.96 5.9 4 1 5 0
61 Trilofon 20/10/1988 14:00:59 40.53 22.94 4.8 20 3 1 1
62 Kyllini (aftershock) 22/10/1988 14:58:18 37.88 21.02 4.5 20 1 1 0 63 Kyllini (aftershock) 31/10/1988 02:59:51 37.85 21.01 4.8 18 1 1 0 64 Kyllini (aftershock) 27/11/1988 16:38:45 37.88 20.99 4.5 8 1 1 0
65 Patras 22/12/1988 09:56:50 38.37 21.78 4.9 10 1 2 0
66 Patras 15/5/1989 22:40:04 38.28 21.79 4.8 1 0 1 0
67 Patras 31/8/1989 21:29:31 38.06 21.76 4.8 23 1 1 0
68 Near southeast coast of Sithonia peninsula 9/3/1990 05:35:50 39.93 23.97 4.6 10 0 1 0
69 Aigion 17/5/1990 08:44:06 38.39 22.22 5.1 26 0 1 0
70 Near east coast of Zakynthos Island 20/5/1990 05:57:24 37.76 20.85 4.5 11 0 1 0
71 Zakynthos Island 24/5/1990 18:51:49 37.73 20.97 4.5 1 0 1 0
72 Near east coast of Zakynthos Island 24/5/1990 19:59:06 37.8 20.91 4.8 1 0 1 0
73 Plati 8/8/1990 00:35:07 37.15 22.04 4.9 10 0 2 0
74 Kefallinia Island 24/8/1990 12:54:41 38.24 20.43 4.5 9 0 1 0 75 Near southeast coast of Sithonia peninsula 9/9/1990 19:00:39 39.9 24.02 5 1 0 1 0 76 Kefallinia Island 4/10/1990 03:19:16 38.21 20.43 4.5 6 0 1 0
77 Griva 21/12/1990 06:57:43 40.95 22.43 6.1 1 1 2 3
78 Near southeast coast of Crete 19/3/1991 12:09:23 34.673 26.358 5.5 5 0 1 0 79 Near southeast coast of Crete 19/3/1991 21:29:27 34.74 26.376 5.2 9 0 1 0 80 Kefallinia Island 26/6/1991 11:43:32 38.34 21.044 5.3 4 0 3 0 81 Near north coast of Kefallinia Island 2/1/1992 09:05:18 38.29 20.325 4.5 9 0 1 0 82 Kefallinia Island 23/1/1992 04:24:17 38.28 20.41 5.6 3 0 3 0 83 Near northwest coast of Kefallinia Island 25/1/1992 12:23:23 38.38 20.44 4.5 10 0 1 0
84 Mataranga 30/5/1992 18:55:40 38.04 21.45 5.2 12 1 5 0
85 Tithorea 18/11/1992 21:10:41 38.26 22.37 5.9 15 1 3 0
86 Pyrgos (foreshock) 14/2/1993 10:17:45 37.71 21.38 4.5 4 1 0 0 87 Pyrgos (foreshock) 25/3/1993 05:44:09 37.61 21.31 4.5 5 1 0 0 88 Pyrgos (foreshock) 26/3/1993 11:45:16 37.68 21.44 4.9 3 3 3 0 89 Pyrgos (aftershock) 26/3/1993 12:49:13 37.69 21.42 4.7 10 1 1 0 90 Pyrgos (aftershock) 26/3/1993 12:26:30 37.55 21.27 4.5 19 1 0 0 91 Pyrgos (aftershock) 30/3/1993 19:08:57 37.64 21.32 4.5 10 0 1 0
92 Gulf of Corinth 2/4/1993 02:22:59 38.16 22.62 5 5 1 0 0
93 Off coast of Levkas Island 6/4/1993 03:24:27 38.7 20.45 4.8 1 0 1 0
94 Gulf of Corinth 11/4/1993 05:18:37 38.34 21.91 5.3 10 1 2 0
95 Pyrgos (aftershock) 29/4/1993 07:54:29 37.76 21.46 4.8 0 1 0 0 96 Near coast of Filiatra 3/5/1993 06:55:06 37.07 21.46 5.2 1 0 1 3
97 Mouzakaiika 13/6/1993 23:26:40 39.25 20.57 5.3 5 2 3 0
98 Patras 14/7/1993 12:31:50 38.16 21.76 5.6 13 3 4 0
99 Patras (aftershock) 14/7/1993 12:39:13 38.18 21.64 4.6 10 1 2 0 100 Patras (aftershock) 14/7/1993 12:54:07 38.15 21.71 4.6 10 1 0 0 101 Pyrgos (aftershock) 7/10/1993 20:26:04 37.79 21.11 4.8 10 0 1 0 102 Near southwest coast of Levkas Island 9/10/1993 13:33:20 38.58 20.45 4.6 6 0 1 0 103 Off coast of Levkas Island 12/1/1994 07:32:57 38.702 20.359 4.6 7 0 1 0
104 Ionian 14/1/1994 06:07:48 37.61 20.88 4.9 10 0 1 0
105 Komilion 25/2/1994 02:30:50 38.73 20.58 5.4 5 2 3 0
106 Ionian 27/2/1994 22:34:52 38.69 20.46 4.8 10 2 1 0
107 Near southwest coast of Levkas Island 15/3/1994 22:41:04 38.602 20.459 4.5 0 0 1 0
108 Arta 14/4/1994 23:01:34 39.132 20.968 4.5 1 0 1 0
109 Levkas Island 18/7/1994 15:44:18 38.626 20.507 4.9 3 0 1 0
110 Paliouri 4/10/1994 19:46:21 39.976 23.643 5.1 10 0 1 0
111 Zakynthos Island 17/10/1994 09:02:17 37.756 20.912 4.6 14 0 1 0 112 Arnaia (foreshock) 5/3/1995 15:39:56 40.541 23.642 4.7 8 0 1 1 113 Arnaia (foreshock) 5/3/1995 21:36:54 40.58 23.65 4.6 8 0 1 2 114 Arnaia (foreshock) 4/4/1995 17:10:10 40.545 23.625 4.6 9 0 1 1
Table 1.Continued.
No Earthquake Date Time Latitude Longitude Moment Focal Number
Name Magnitude Depth of Records
(dd-mm-yy) (◦) (◦) (km) B C D
116 Kozani 13/5/1995 8:47:15 40.183 21.66 6.5 14 0 3 5
117 Kozani (aftershock) 13/5/1995 11:43:31 40.1 21.6 5.2 10 0 0 1 118 Kozani (aftershock) 13/5/1995 18:06:01 40.28 21.52 4.6 29 0 0 1 119 Kozani (aftershock) 14/5/1995 14:46:57 40.13 21.66 4.5 0 0 1 0 120 Kozani (aftershock) 15/5/1995 04:13:57 40.08 21.65 5.2 9 0 3 1 121 Kozani (aftershock) 16/5/1995 23:00:42 40.02 21.56 4.7 0 0 1 0 122 Kozani (aftershock) 16/5/1995 23:57:28 40.09 21.62 4.9 0 0 2 0 123 Kozani (aftershock) 16/5/1995 04:37:28 40.01 21.58 4.8 9 0 1 0 124 Kozani (aftershock) 17/5/1995 04:14:25 40.046 21.58 5.3 10 0 3 1
125 Kozani (aftershock) 17/5/1995 09:45:07 40.01 21.56 5 0 0 2 0
126 Kozani (aftershock) 18/5/1995 06:22:55 40.03 21.56 4.6 0 0 1 0 127 Kozani (aftershock) 19/5/1995 06:48:49 40.09 21.6 5.2 7 0 4 0 128 Kozani (aftershock) 19/5/1995 07:36:19 40.06 21.61 4.8 0 0 1 0 129 Kozani (aftershock) 6/6/1995 04:36:00 40.14 21.61 4.8 0 0 4 1
130 Aigion 15/6/1995 00:15:51 38.362 22.2 6.5 10 1 8 1
131 Kozani (aftershock) 17/7/1995 23:18:15 40.21 21.55 5.2 22 0 1 1 132 Kozani (aftershock) 18/7/1995 07:42:54 40.101 21.575 4.7 10 0 1 0 133 Aigion (aftershock) 13/8/1995 05:17:29 38.101 22.81 4.5 8 0 1 0 134 Kozani (aftershock) 6/11/1995 18:51:48 39.92 21.62 4.8 13 0 5 1 135 East of Kithira Island 29/6/1996 01:09:03 36.351 23.179 4.5 6 0 0 1
136 Pyrgos 8/11/1996 11:43:45 37.684 21.425 4.7 0 0 1 0
137 Zakynthos Island 16/2/1997 11:03:19 37.676 20.723 4.9 8 0 1 0 138 Strofades (foreshock) 26/4/1997 22:18:34 37.181 21.385 5 7 0 0 1 139 Strofades (foreshock) 29/4/1997 23:52:17 37.416 20.713 4.5 2 0 1 0
140 South of Vathi 11/5/1997 10:27:56 38.412 23.588 4.6 30 0 3 0
141 Itea 11/5/1997 21:10:28 38.44 22.28 5.6 24 0 3 1
142 South of Rhodos 17/7/1997 13:21:01 36.412 28.192 4.5 5 0 1 1
143 South of Rhodos 18/7/1997 1:45:23 36.38 28.188 4.6 14 0 1 1
144 Varis 22/8/1997 03:17:47 40.148 21.572 4.5 23 0 0 1
145 Northwest of Makrakomi 21/10/1997 17:57:47 38.971 22.073 4.7 14 0 0 1
146 Strofades 18/11/1997 13:07:41 37.482 20.692 6.6 10 2 6 2
147 Strofades (aftershock) 18/11/1997 13:13:46 37.229 21.057 6 10 1 3 2 148 Strofades (aftershock) 18/11/1997 15:23:35 37.334 21.191 5.3 30 1 1 1 149 Strofades (aftershock) 18/11/1997 13:44:05 37.309 21.047 4.8 10 0 1 0 150 Strofades (aftershock) 19/11/1997 00:33:07 37.458 20.764 4.8 10 0 1 0
151 Ano Liosia 9/7/1999 11:56:51 38.08 23.58 6 17 2 7 0
Total no. of records 75 197 63
This relation, by establishing the input of the first layer of the network, allows us to gradually calculate the value of the global output of the network, thus ensuring its forward propagation. When one compares this output with the desired output, one can calculate the error function, generally given by
e=1 2 Y− ¯Y
2
(5) whereY is the desired output, and Y¯
is the obtained output. The direction in which the weights are updated is given by the negative of the gradient of (e) with respect to every element of the weight. This process consists in minimising (e) by a gradient descent. Thus, we try to modify the synaptic weights to reduce (e). This is carried out using the following relation.
1wsij= −µesjYis−1 n+
1wj is
n−1 (6)
whereµis the learning rate parameter, which usually takes values between 0 and 0.5. The quantityesj is the locale of the error of thej-th neuron in the s layer. Weights and bias terms are first initialised at random values. In general, there are no strict rules for determining the network configuration for optimum training and prediction.
24
Fig. 4.Topology of the feed-forward k-NN-type ANN used in the present study.
5 Data processing
We consider automatic MMI assessment based on ground-motion parameters as part of a larger category of problems encountered in pattern recognition (Poggio and Girosi, 1990. In the present investigation, we consider the following four phases: (1) feature extraction, (2)classification, (3) pre-processing and optimisation and (4) regression.
5.1 Feature extraction
During this phase, we combined the enhanced selection capacities offered by GA with the performance of an ANN as a classifier. At first, we used all nine commonly-used input parameters that characterise earthquake ground motion at a site corresponding to an MMI value. These measures includeM, log(R), PGV, log(PGV),Sa, PGA, log(PGA),Ia and CAV (Fig. 4). During this procedure, we use 9-bit string (S) quantification with binary field-values as follows. S
=M,logR,Sa,PGV,logPGV,PGA,logPGA,Ia,CAV (7) For example, the three-parameter string [logR,Ia, CAV] is represented as the string010000011. A genetic algorithm was used to generate populations of strings out of the 512 possible combinations from000000000to111111111. The total number of available strings (that is, the equivalent of chromosomes) at a certain time (i.e., after the Max-No-Generations), which is known as the genome, was evaluated by an ANN implemented as a k-nearest neighbour (k-NN). This was achieved by comparing the corresponding MMI (that is, the outputs) with the selected inputs out of the nine possible inputs represented by the strings generated by the
genetic algorithm. In our implementation, we have allowed a population size of 20, where the population size indicates the maximum number of chromosomes (or strings) allowed in a generation.
5.2 Classification
The second phase, which deals with classification, is implemented using a k-NN-type neural network. The k-nearest neighbours (k-NN) algorithm is a method for classifying objects based on the closest training examples in the feature space. The k-NN algorithm is a type of instance-based learning, or lazy learning, where the function is only approximated locally, and all computation is deferred until classification.
In the machine-learning community, Instance-Based Learning(IBL) (Aha et al., 1991), also known as memory-based learning, is a family of learning algorithms that, instead of performing explicit generalisations, compares new instances with instances that have been observed during training. It is called instance-based because it constructs hypotheses directly from the training instances themselves. A direct consequence of this approach is that the complexity of the problem grows with the amount of data available for training and testing.
Of the data set of 310 values, some data points were left for testing, while most were considered for training. We have used a GA-ANN with IBL approach in order to avoid data changes produced by normalisation techniques. The Euclidean metric is used to assess distances between the training and testing epochs.
The k-NN classifier is amongst the simplest machine-learning algorithms. In our case, it selects the optimal combination of the nine inputs (see Eq. 7). An object is an instance out of the 310 data values given in the features space; it is a five-parameter string consisting of [M, log(R), PGA, Ia, CAV]. It is classified by a majority vote of its neighbours, with the object being assigned to the class most common among its k-nearest neighbours.
5.3 Pre-processing and optimisation
In the previous two phases, we considered all inputs as they were, but for processing purposes, we converted all inputs into integers by multiplying them by powers of 10 (H¨ardle et al., 1995; Mierswa et al., 2006).
Candidate solutions to the optimisation problem act like individuals in a population, and a fitness function determines the environment within which these solutions “live” (e.g., a cost function). Genetic algorithms are a particular class of evolutionary algorithms (EA) (Fonseca and Fleming, 1995) that use techniques inspired by evolutionary biology such as inheritance, mutation, selection, and crossover (or recombination).
In other words, a GA quantifies information (namely, the parameters of the k-NN classifier) in the form of strings (that is, the chromosomes), and through the EA, only the fittest chromosomes survive over the generations of the evolution. Therefore, an important parameter for the proposed GA-ANN method is Max-No-Gener, which allows the GA algorithm to evolve to achieve the optimal solution. In our case, there are several parameters that have to be modified (or fine-tuned) to achieve optimal behaviour according to ANN. These include the number of hidden layers and the number of neurons in each hidden layer.
After finding the optimal Max-No-Gener parameter, we determined k and the selection scheme (or the size of the tournament). k was found by a trial-and-error procedure to have a value of 2. One advantage of the selection mechanism of a GA (Tobias and Lothar, 1995) is the independence of the representation of the individuals. Only the fitness values of individuals are taken into account.
A fitness function is a particular type of objective function that prescribes the optimality of a solution (or chromosome) in a genetic algorithm so that a particular chromosome may be ranked among all other chromosomes from the genome. Chromosomes which are found to be “more optimal” are allowed to breed. That is, further binary combinations will be created by the GA on the “skeleton” of these “more optimal” chromosomes. Data sets can then be mixed using any of several available techniques, thus producing a new generation of chromosomes. This mix in our case can be represented by taking the first four digits from one “optimal” string and the last five digits from another “more optimal” one, thereby creating a new chromosome (9-digit string)
Fig. 5.One-point crossover.
that can possibly perform better under k-NN classification. This simplifies the analysis of the selection methods and allows a comparison that can be used for all kinds of genetic algorithms.
One of the frequently-used selection schemes is tourna-ment selection. In this scheme, we run a tournatourna-ment among a few individuals chosen at random from the population (i.e., from the genome) and select the one with the best fitness for crossover as the winner, adjusted by variances in tournament size. In genetic algorithm theory, the crossover is the genetic operator used to modify the programming of a chromosome or a group of chromosomes from one generation to the next. It is analogous to natural reproduction and biological crossover upon which the simplified GA theory for computational intelligence was built.
First, a single crossover point on the strings of both parent organisms is selected while avoiding extreme points. All data beyond that point in either organism string are swapped between the two organism strings. The resulting organisms are the children (or offspring), as shown in Fig. 5.
If the tournament size is larger (chromosomes for which the objective function, i.e., the error has a higher value), weak individuals have a smaller chance of being selected for breeding, crossover, and perpetuation in the next generations. Performance was quantified by RMS criteria and the squared error. A flow chart describing all of the above operations is presented in Fig. 6.
To validate the performance of the above-mentioned GA-ANN selection schemes, we selected a validation scheme based on regression performance. The results for the selection of the first optimal parameter from those described above (that is, Max-No-Gener) are presented in Table 2. From this table, we note the following cases.
Table 2.The parameters retained by the GA-ANN selection algorithm and corresponding regression performance (columns 2 and 3).
Max-No-Gener. Sq error RMS error root relative The retained parameters
squared error
75 0.329±0.170 0.553±0.152 0.608±0.178 S1= [M,logR,logPGV,Ia,CAV] 80 0.311±0.154 0.456±0.169 0.593±0.195 S2= [M,logR,PGA,Ia,CAV] 90 0.339±0.231 0.548±0.196 0.618±0.189 S3= [logR,Ia,CAV]
94 0.324±0.194 0.571±0.176 0.608±0.194 S4= [M,logR,Sa,logPGV,PGA,Ia,CAV]
Fig. 6. Flowchart showing the sequences of feature-selection and classification.
If we consider the case with Max-No-Gener = 80 withS2 as the fittest string, this corresponds to the combination [M, log(R), PGA, Ia, CAV] and is represented as 110001011. In this situation, S2 is retained as having the best fitness because the output of the k-NN classifier forS1is given by the squared error 0.329±0.170 and forS2is given by of the squared error of 0.311±0.154. In other words, both the error and its standard deviation are lower than in the case ofS1.
Setting Max-No-Gener higher than optimally at 90, S3 then corresponds to the combination [logR, Ia, CAV] and is represented as 010000011; this solution is rejected due to a worse regression performance (that is, a higher RMS error). The solution with Max-No-Gener = 94 and string S4 corresponding to the combination [M, logR, Sa, PGV, logPGV, PGA, logPGA,Ia, CAV] and represented by 111111111is also rejected because it accepted almost all of the input parameters and is a trivial solution.
Finally, an underdetermined solution, which results if values of Max-No-Gener are in the range of 25 to 70, is rejected because GAs require a minimum number of generations to obtain optimal fitness among all available individuals.
Judging from the above, an optimal value of Max-No-Gener = 80 with a minimum RMS was selected. In this case, the optimal selected input parameters are M, logR, PGA, Ia, and CAV. These are the parameters used to express MMI throughout the regression process.
5.4 Regression
In a case in which the existing data are not sufficient for analysis because we must use part of the data for validation and test sets, it is common to use a cross-validation or rotation estimation method (Kohavi, 1995). This is a technique for assessing how the results of a statistical analysis will generalise to an independent data set. It is mainly used in applications in which the goal is prediction, particularly when one wants to estimate how accurately a predictive model will perform in practice. Cross-validation involves partitioning a portion of the data into complementary subsets, performing analysis on one subset called the training set, and validating the analysis on the other subset, which is called the validation or testing set. For relatively large datasets, a higher cross-validation is usually used (25 in our case).
Table 3. The parameters for linear regression obtained by the program XploRe for the input data selected by the proposed GA-ANN method.
PARA- Beta SE StandB t-test p-value METERS
b[0, ] 8.8236 4.0481 0.0000 1.439 0.1513 b[1, ] 0.4173 0.9553 0.2733 0.437 0.6625 b[2, ] –7.9601 12.2908 –0.4084 –0.648 0.5177 b[3, ] 0.3801 0.4533 0.1499 0.839 0.4024 b[4, ] 1.1046 0.5022 0.7718 2.200 0.0286 b[5, ] –0.5508 0.5965 –0.2046 –0.923 0.3566
Table 4.The statistical parameters obtained for the linear regression using the ANOVA test.
ANOVA SS df MSS F-test p-value
Regression 155.893 5 31.179 67.556 0.0000 Residuals 140.30 4 304 0.462
Total Variation 296.197 309 0.959
MultipleR = 0.72548
R2 = 0.52632
AdjustedR2 = 0.51853 Standard Error = 0.67936
regression approach described by the following equation (H¨ardle et al., 1995).
Y=b0+ 5 X
i=1
bi∗Xi (8)
whereb0is the intercept, and b1,...,b5 are the coefficients for the ground parameters.
The obtained b values are presented in Table 3, and the results of the ANOVA statistical test are shown in Table 4. Accordingly, the relation that describes MMI as a function of [M, logR, PGA,Ia, CAV] is as follows.
MMI=8.824+0.417M−7.960logR+0.380PGA
+1.105Ia−0.551CAV (9)
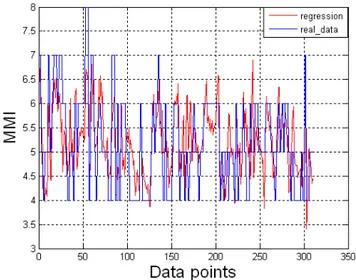
Figure 7 shows the time series corresponding to the original data and the results of the regression analysis. For the GA-ANN selection scheme, we used a Java-based implementation built around the Weka (the IBk lazy learner) data-mining system (Witten and Frank, 2005).
Fig. 7.Output of the regression algorithm (in red) and the original MMI data (in blue) for the 310 considered data points.
6 Conclusions
In this research, we presented a new approach based on ANN and GA to model the relationship between MMI attenuation and engineering ground motion parameters. The performance of this new regression approach has been tested using a Greek strong motion database with satisfactory results.
We note that not all of the features selected in the GA-ANN approach have the same influence on MMI attenuation. An approach based on evolutionary algorithms can be useful in weighting the importance of those features. Additionally, a new type of neural network (namely, an evolutionary neural network) can be used to replace the classical k-NN used in the current paper. If we implement an expert system, we can derive a real-time signal-processing system, which can be used for near real-time damage assessment and shake map construction.
Acknowledgements. We are grateful to Laurentin Danciu for his most usefull comments. The help of M. E. Condakis and 2 anonymous reviewers is greately appreciated.
Edited by: M. E. Contadakis
Reviewed by: two anonymous referees
References
Ambraseys, N., Smit, P., Douglas, J., Margaris, B., Sigbjornsson, R., Olafsson, S., Suhadolc, P., and Costa, G.: Internet-site for European strong-motion data, Boll. Geofis. Teor. Appl. 45(3), 113–129, 2004.
Arias, A.: A measure of earthquake intensity, Cambridge, MA, 1970.
Atkinson, G. M. and Kaka, S. I.: Relationship between felt intensity and instrumental ground motion in the central United States and California, B. Seismol. Soc. Am., 97(2), 497–510, 2007. Bishop, C. M.: Neural Networks for Pattern Recognition, Oxford
University Press, UK, 1996.
Cabanas, L., Benito, B., and Herraiz, M.: An approach to the measurement of the potential structural damage of earthquake ground motions, Earthq. Eng. Struct. D., 26, 79–92, 1997. Danciu, L. and Tselentis, G-A.: Engineering ground motion
parameters attenuation relationships for Greece, B. Seismol. Soc. Am., 97(1B), 162–183, 2007.
Fonseca, C. M. and Fleming, P. J.: Multi-objective genetic algorithms made easy: Selection, sharing and mating restriction, in: Proceedings of the first international conference on generic algorithms in engineering systems: Innovations and applications, Sheffield, UK, 45–52, 1995.
Fujinawa, Y., Matsumoto, T., and Takahashi, K.: Method for estimating origin time, hypocentral distance and scale based on electric field observation, and apparatus for prediction, Patent No. US 6,885,945 B2, 2005.
H¨ardle, W.: Applied Nonparametric Regression, Humboldt-Universit¨at zu Berlin Wirtschaftswissenschaftliche Fakult¨at Institut f¨ur Statistik und ¨Okonometrie, 1994.
H¨ardle, W., Klinke, S., and Turlach, B.: XploRe – an Interactive Statistical Computing, Environment, Springer, Heidelberg, 1995. Haykin, S.: Neural Networks, 2nd edn., MacMillan College
Publishing Company, 1999.
Kaka, S. I. and Atkinson, G. M.: Relationships between felt intensity and instrumental ground motion in the central United States and California, B. Seismol. Soc. Am., 97(2), 497–510, 2004.
Kalogeras, I. S., Marketos, G., and Theodoridis, Y.: A tool for collecting, uerying, and mining macroseismic data, B. Geol. Soc. Greece, XXXVI, 2004.
Karim, K. R. and R. Yamazaki, R.: Correlation of JMA instrumental seismic intensity with strong motion parameters, Earthq. Eng. Struct, D., 31(5), 1191–1212, 2002.
Kohavi, R.: A study of cross-validation and bootstrap for accuracy estimation and model selection, Proceedings of the Fourteenth International Joint Conference on Artificial Intelligence, (Morgan Kaufmann, San Mateo), 2(12), 1137– 1143, 1995.
Koliopoulos, P. K., Margaris, B. N., and Klims, N. S.: Duration and energy characteristics of Greek strong motion records, J. Earthq. Eng., 391–417, 1998.
Kostov, M. K.: Site specific estimation of cumulative absolute velocity, 18th International Conference on Structural Mechanics in ReactorTechnology, Beijing, China, 2005.
Krinitzsky, E. L. and Chang, F. K.: Intensity-related earthquake ground motion, Bull. Int. Assoc. Eng. Geol. 4, 425–435, 1988. Margottini, C., Molin, D., and Serva, L.: Intensity versus ground
motion: a new approach using Italian data, Eng. Geol., 33, 45– 58, 1992.
Mierswa, I., Wurst, M., Klinkenberg, R., Scholz, M., and Euler, T.: YALE: Rapid prototyping for Complex Data Mining Tasks, in Proceedings of the 12th ACM SIGKDD International Conference on Data Mining and Knowledge Discovery, (KDD-06), 2006.
Panza, G. F., Cazzaro, R., and Vaccari, F.: Correlation between macroseismic intensities and seismic ground motion parameters, Ann. Geofis., 40(5), 1371–1382, 1997.
Poggio, T. and Girosi, F.: Regularization algorithms for learning that are equivalent to multilayer perceptrons, Science, 247, 978– 982, 1990.
Sokolov, Y. V.: Spectral parameters of the ground motions in Caucasian seismogenic zones, B. Seismol. Soc. Am., 88(6), 1438–1444, 1998.
Skolov, Y. V.: Seismic Intensity and Fourier Acceleration Spectra: Revised Relationship, Earthq. Spectra, 18(1), 161–187, 2002. Tobias, B. and Lothar, T.: A comparison of selection schemes used
in evolutionary algorithms, Evol. Comput., 4(4), 361–394, 1995. Trifunac, M. D. and Westermo, B.: A note on the correlation of frequency-dependent duration of strong earthquake ground motion with the modified Mercalli intensity and the geologic conditions at the recording stations, B. Seismol. Soc. Am., 67(3), 917–927, 1977.
Tselentis, G.-A. and Danciu, L.: Empirical relationships between MMI and engineering ground motion parameters in Greece, B. Seimol. Soc. Am., 98(4), 1863–1875, 2008.
Witten, I. H. and Frank, E.: Data Mining – Practical Machine Learning Tools and Techniques, Elsevier, 2005.
Wald, D. J., Quitoriano, V., Heaton, T. H., and Kanamori, H.: Relationships between peak ground acceleration, peak ground velocity, and modified mercalli intensity in California, Earthq. Spectra, 15(3), 557–564, 1999.