Insper Instituto de Ensino e Pesquisa
Programa de Mestrado Profissional em Administração
Emília Borges da Silva
BOARD OF DIRECTORS’ CENTRALITY, PRIVATE EQUITY
PRESENCE AND IPO PERFORMANCE
Emília Borges da Silva
Board of Directors’ Centrality, Private Equity Presence
and IPO Performance
Dissertação apresentada ao Programa de Mestrado Profissional em Administração do Insper Instituto de Ensino e Pesquisa, como parte dos requisitos para a obtenção do título de Mestre em Administração.
Área de concentração: Estratégia
Orientador: Prof. Dr. Charles Kirschbaum – Insper
Co-orientador: Profa. Dra. Andrea Minardi – Insper
Borges-da-Silva, Emília
Board of Director’s Centrality, Private Equity Presence and IPO Performance / Emilia Borges da Silva; orientador: Orientador: Charles Kirschbaum; co-orientadora: Andrea Minardi – São Paulo: Insper, 2014.
66 f.
Dissertação (Mestrado – Programa de Mestrado Profissional em Administração. Área de concentração: Redes, Finanças e
Private Equity) – Insper Instituto de Ensino e Pesquisa.
1. Centralidade 2. Board Interlock 3. Conselho de
Dedico este trabalho ao meu pai, que me inspirou a conhecer o mundo acadêmico, e à minha mãe, que me mostrou que
AGRADECIMENTOS
Primeiramente agradeço aos meus orientadores, professor Charles Kirschbaum e professora Andrea Minardi, por toda a ajuda e apoio. Agradeço a eles também pelas sessões de brainstorming sempre tão animadas e necessárias para construir este trabalho que é baseado em áreas de pesquisa um tanto distintas. Agradeço pelas palavras de motivação, pelas broncas necessárias, por me receberem nas sextas-feiras depois do expediente, pelos comentários e correções.
Aos professores Sérgio Lazzarini e Luciano Rossoni por aceitarem fazer parte da banca examinadora. Obrigada pelo tempo e atenção ao analisarem o trabalho.
Aos professores do mestrado do Insper, que tornaram meus dias mais interessantes (e difíceis) nestes últimos dois anos.
Agradeço aos meus colegas de sala do mestrado que tornaram as aulas muito mais divertidas e agradáveis. À Paula e à Carolina pela parceria nos diversos trabalhos.
Agradeço às empresas onde trabalhei por possibilitarem a realização desta dissertação.
À Flavia Neves, minha companheira de base de dados, que me ajudou a montar a enorme base de conselhos de administração e que estava sempre disposta a me ajudar. Ao Rodolfo Viola, que me ajudou a criar as macros para formatar os dados e calcular os indicadores de centralidade.
Agradeço ao Thales por me mostrar que é possível escrever uma dissertação e trabalhar ao mesmo tempo. Por me fazer companhia nas noites e nos finais de semana de estudos, pelo otimismo e pela força.
Aos meus irmãos pelo companheirismo, pelos conselhos e pelos momentos de descontração tão importantes.
"Man strives toward reason only so that he can make rules for himself. Life itself has no rules. That is its mystery and its unknown law. What you call knowledge is an attempt to impose something comprehensible on life.”
ABSTRACT
BORGES-DA-SILVA, Emilia. Board of Director’s Centrality, Private Equity Presence and IPO Performance. 2014. 66f. Dissertation (Mastership) – Insper Insper Instituto de Ensino e Pesquisa, São Paulo, 2014.
According to the resource dependence theory, companies need external resources that are not under their control, no matter how powerful and influent they are. A board of directors that is more connected with influent contacts, more socially active in the market, is likely to obtain these external resources that are key for a firm's progress and may positively influence company’s overall return. This study was developed to investigate if a board of directors with higher centrality can be considered of higher quality, and thus having a positive influence on the company’s performance at the time of the IPO. This study also explores if the association with a private equity fund influences board centrality and the performance of the IPO. The stage before IPO is a learning period in which the firm refines its operations and corporate governance standards, being an unique context to study the relationship between governance and performance, as the ex-ante board selection is an strategic movement of the company and the decision is likely to influence IPO performance (FILATOTCHEV & BISHOP, 2002). We used a sample of 148 Brazilian IPOs that were launched from 2004 to 2013. We also collected the board of directors’ information from 592 Brazilian public companies to construct a database and estimate the network of companies from 2002 to 2013 (one for each year) using board interlock. The databases were analyzed using OLS regressions. Although the primary proposition was not confirmed, very interesting outcomes were found regarding the dynamics between higher centrality boards and private equity presence.
RESUMO
BORGES-DA-SILVA, Emilia. Centralidade do conselho de administração, presença de private equity e desempenho de IPO. 2014. 66f. Dissertação (Mestrado) – Insper Insper Instituto de Ensino e Pesquisa, São Paulo, 2014.
De acordo com a teoria da dependência de recursos as empresas precisam de recursos externos que não estão sob seu controle mesmo, apesar de possuírem poder e influência. Um conselho de administração mais conectado a contatos influentes, mais socialmente ativo no mercado, tem maior probabilidade de obter esses recursos externos que são fundamentais para o progresso de uma empresa e podem influenciar positivamente sua rentabilidade. Este estudo foi desenvolvido para investigar se um conselho de administração com maior centralidade pode ser considerado de melhor qualidade, e, assim, ter uma influência positiva sobre o desempenho da empresa no momento do IPO. Este estudo explora também se a associação com fundos de private equity influencia a centralidade do conselho e
também se melhora o desempenho do IPO. O período antes de IPO é um momento de aprendizado em que a empresa refina suas operações e os padrões de governança corporativa, sendo um contexto único para estudar a relação entre governança e desempenho, uma vez que a seleção ex-ante de conselheiros é um movimento estratégico da empresa e uma decisão que pode influenciar o desempenho do IPO (FILATOTCHEV & BISHOP, 2002). Foi utilizada uma amostra de 148 IPOs ocorridos no Brasil lançados de 2004 a 2013. Foram também coletadas informações sobre o conselho de administração de 592 empresas abertas brasileiras para a construção de um banco de dados e, com isso, estimar a rede de empresas de 2002 a 2013 (uma rede feita para cada ano) usando board interlock. As bases de
dados foram analisadas utilizando regressões MQO. Apesar de não ter sido possível confirmar a proposição inicial, foram encontrados resultados muito interessantes sobre a dinâmica entre conselhos de administração com alta centralidade e associação com fundos de private equity.
Palavras-chave: centralidade, board interlock, conselho de administração,
LIST OF FIGURES
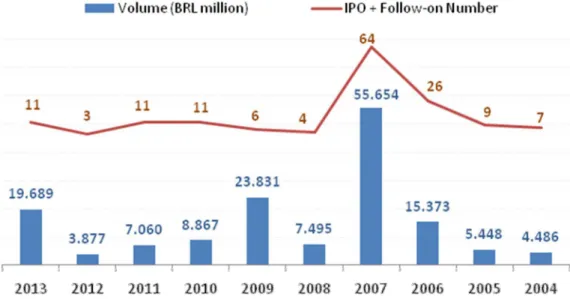
Figure 1: Brazilian IPOs since 2004, source BMF&BOVESPA... 22
LIST OF TABLES
TABLE OF CONTENTS
1 INTRODUCTION ... 12
1.1 Context and Relevance ... 12
1.2 Structure of the Dissertation ... 15
2 LITERATURE REVIEW ... 16
2.1 Board of Directors' Role as External Contacts ... 16
2.2 Influence of Board Centrality ... 17
2.3 Private Equity Funds and Boards ... 20
2.4 Long-term IPO Performance and Centrality of the Board ... 22
3 METHODOLOGY AND DATABASE ... 27
3.1 Data and Sample Selection ... 27
3.1.1 IPO Performance Database ... 27
3.1.2 Board Centrality Database ... 28
3.2 IPO Performance vs. Centrality Model ... 29
3.2.1 Estimating IPO Performance – the Dependent Variable ... 30
3.2.2 Estimating Board Centrality ... 32
3.2.3 Private Equity Fund Presence ... 39
3.2.4 Control Variables ... 39
3.3 Hypotheses ... 41
3.3.1 Hypothesis 1 ... 41
3.3.2 Hypothesis 2 ... 43
3.3.3 Hypothesis 3 ... 44
3.3.4 Hypothesis 4 ... 45
4 RESULTS ... 46
4.1 Cumulative Abnormal Return & Board of Directors ... 46
4.3 Private Equity & Board Centrality ... 50
4.4 Cumulative Abnormal Return & Private Equity interacting with Board of Directors ... 51
4.5 Cumulative Abnormal Return & Board of Directors for Non-Private Equity Firms ... 53
5 CONCLUSION AND FINAL COMMENTS ... 55
5.1 Conclusions ... 55
5.2 Practical Implications ... 58
5.3 Limitations and Suggestions for Future Research ... 58
1 INTRODUCTION
1.1 Context and Relevance
The importance of corporate governance and its positive influence in a company’s management is an indisputable fact and board of directors is one of the main issues in the subject. The board of directors is an important tool of the corporate governance framework for a firm to surmount strategic thresholds, for example a transition to professional management, a restructuring process, going from public to private or an initial public offering. Bringing expert directors is a way of structuring the firm to overcome such thresholds (HUSE, 2007, p.114). And it is highly feasible that the background of these directors, including their knowledge, experience, network etc., will influence directly on their work and implications towards the firm’s strategy.
Although agency theory has been key to describe the monitoring role of the board of directors, it has a limited view on the social characteristic and personality of individuals (HUSE, 2007), and thus the resource dependence theory appears as a complementary framework to study the role of the board of directors. According to the resource dependence theory, companies need external resources that are not under their control, no matter how powerful and influent they are. A board connected with influent contacts, more socially active in the market, is likely to obtain these external resources that are key for a firm's progress and may positively influence company’s overall return.
The directors may use their influence and social relationships to (i) find business contacts and partners in general – clients, suppliers, alliances etc. (NICHOLSON ET AL., 2004) and (ii) to guarantee better design of contracts due to the reduction of asymmetry between the parts (SCHOORMAN et al., 1981).
Therefore we should expect that the board centrality should positively impact firm performance. Centrality is the property of a node´s position in a network. Actually, it is a family of concepts rather than a one indicator and can be measured in several ways. In this study it means the influence, relative importance, status etc. of an individual or entity within a network (BORGATTI ET AL., 2013).
The objective of this study is to investigate if centrality is a proxy for quality of the board and if there is a direct relation between centrality of the directors and better firm performance, measured by the IPO return.
The stage before IPO is a learning period in which the firm refines its operations and corporate governance standards. According to Ernst & Young (2013), the most successful IPOs face the event as a transformational process, operating as public companies more than a year before the offer. A company that has more solid corporate governance standards and is more organized is likely to have better IPO performance.
To start the process of going public the firm needs to hire an auditor to examine the firm's financials and an investment banker (underwriter) to sell the stock in the market (TITMAN & TRUEMAN, 1986). According to Ernst & Young (2013) engaging into an IPO is one of the main decisions a company can make. It represents a radical change in a firm's routines, especially in today’s environment as the firm has to deal with high scrutiny from investors and regulators (ERNST & YOUNG, 2013).
In order to perform well in its venture, a good company profile is fundamental to bear the costs and requirements of such change. The firm will have to deal with the market requirement of having more transparency, better processes and precise corporate governance policies – aspects evaluated in depth by analysts and investors (ERNST & YOUNG, 2013).
The board is an essential aspect of company's governance in the IPO process. It will be the entity responsible for ensuring the traced strategy is being accomplished, ensuring the company is up-to-date with knowledge, technology, innovative ideas, as well as being the driving force for proper networking, partnerships, contract negotiations and competition coordination. Therefore, if centrality of the board is a proxy of quality of the board, companies with more central boards should be better prepared, have higher governance standards and, in average, better IPO performance.
The board of directors is also a key tool of the corporate governance framework for private equity funds. As per Lerner et al. (2012), "the governance that leads to value creation flows from the board of directors" (p.166). When private equity funds buy a share of a company, they are willing to manage the firm in a way to create value through management and governance and, therefore, maximize their return on investment.
structure negotiations, the private equity fund will gain majority of the boards voting rights to control company´s strategic decisions.
In sum, a board of a firm with a private equity investment is more active and involved, so it is expected that IPOs of firms with private equity investment will have better performance because they will use their power and legally endorsed role to create value via financial engineering, cost reduction, increased sale and scope, management recruitment, incentivization and mentoring (LERNER ET AL., 2012, p.189).
The cumulative abnormal return (CAR) of the company’s stock in one year after the IPO will be used as a proxy for performance. Centrality in this study is calculated with four indicators – degree, eigenvector, closeness and betweenness – that will be detailed in the Research Methodology section.
1.2 Structure of the Dissertation
2 LITERATURE REVIEW
2.1 Board of Directors' Role as External Contacts
The board has an important role in a company´s management and is key for sustainable long term performance. It is one of the main tools in the corporate governance framework. Zahra and Pearce's (1989) meta-analysis on board of directors and firm performance discussed the board's influence on a firm's performance under four main perspectives: (i) legalistic, (ii) resource dependence, (iii) class hegemony, and (iv) agency theory (ZAHRA & PEARCE, 1989). Although several arguments to endorse this study can be found in all four perspectives, the one that most relates to the idea that higher centrality could lead to better company performance is the resource dependence perspective, which is, according to Zahra and Pearce (1989), the one with strongest empirical support.
Specially in environments where there is high concentration of corporate property, what happens in countries such as Japan, Germany (FONTES FILHO & LEAL, 2012), and Brazil (LAZZARINI, 2011), the role of the board of directors tends to get less focused on the monitoring of executives (LA PORTA ET AL., 1999) and more focused on the role of connecting organizations.
Several studies have discussed the influent of corporate governance and the board of directors in a company's performance1, but most of these studies consider the assumption that the directors are independent members or outsiders, and thus these papers highlight the monitoring role of the board of directors based on the agency theory perspective. Nevertheless, the board has been understood not only as a monitoring mechanism, but also as a way to acquire and transfer knowledge through board interlocking (MENDES-DA-SILVA ET AL., 2008).
2.2 Influence of Board Centrality
In a system of organizations, any event depends on more than one firm. A firm alone does not entirely control all the conditions and resources required to conduct an endeavour or an action. Interdependence happens whenever an outcome depends on more than one causal agent. On this point, organizations will engage in relations and exchanges with other organizations as they are not self-sufficient an need support from the environment (PFEFFER & SALANCIK, 1978, p.40). In Pfeffer and Salancik's words (1978), "it is the fact of the organizations dependence on the environment that makes the external constraint and control of organizational behaviour both possible and almost inevitable" (p.43).
The usage of the resource dependence theory as a complementary framework to the agency theory while applied to the board of directors' studies has been a way to acknowledge the social character and importance of the board while connecting to external players. It is a way to understand not only the internal role of the board, but also the outside role and the importance that external resources have in developing an organization.
According to O'Hagan and Green (2003), researchers in the more recent years have used the resource dependency as the best explanation for board interlock, which is a
1 Mendes-Da-Silva et al. (2008) cites some papers that examine the characteristics of the board of directors, e.g.
paradigm based on the assumption that interlocks are established to reduce market uncertainty. The board interlock happens when a director seats in the board of more than one company, characterizing a formal link between these organizations.
A company has to efficiently deal with market uncertainty to be able to survive and improve. This uncertainty restricts a firm's access to resources and may jeopardize the implementation of strategic decisions (MENDES-DA-SILVA ET AL., 2008). And thus the board of directors is used to deal with uncertainty, while it is used as a tool to build relations with other companies by means of the board interlock.
O'Hagan and Green (2003) debate that the research of board interlock has developed significantly in the last century. The authors argue that it has improved from a management control and class hegemony theories approach until the 1970's, in which external pressures were not considered to affect a company's management and interlocks were considered accidental with little importance, to a more resource dependence theory approach – i.e. the rationale has moved from board interlock as a controlling mechanism to board interlock as a transfer mechanism (p.129).
The directors are likely to be sources of information on market conditions – trends, players status, regulatory amendments etc. (MIZRUCHI, 1996; MOL, 2001; and LARCKER ET AL., 2013) –, business ideas and innovations (O'HAGAN & GREEN, 2003), new technologies, modern compensation structures (HAUNSCHILD & BECKMAN, 1998), overall improvement of innovative performance in small networks (WINCENT ET AL., 2010). All of these aspects can certainly benefit firms' overall performance.
The directors may also use their influence and social relationships to (i) find business contacts and partners in general – clients, suppliers, alliances etc. (NICHOLSON ET AL., 2004) and (ii) to guarantee better design of contracts due to the reduction of asymmetry between the parts (SCHOORMAN et al., 1981).
Although there are numerous good arguments to say that there is a positive relation between a firm’s centrality, connectedness, or importance within a boardroom network, there are also arguments to support the contrary. A higher centrality of the company means that it is more exposed to the information that flows within the network, so if value destroying business practices and misleading or incorrect information are spread, a higher centrality firm would be more exposed these negative influences. Additionally, if a director has more than one job, sitting in more than one board, a decrease in the quality of the director's work may happen.
2.3 Private Equity Funds and Boards
Private equity funds manage their investments focusing on value creation through management and governance to maximize their return on investment. No matter the size of the investment, the fund knows that it will be long term and illiquid, thus it is important that the private equity fund is actively involved in order to guarantee that the investment will generate returns (LERNER ET AL., 2012, p.196). In line with the authors, Masulis and Thomas (2009) argument that the major reason for value creation and higher performance of companies associated with private equity funds is the fact that these funds enhance corporate governance standards on their invested companies.
The board of directors is a key tool of the corporate governance framework for private equity funds. It is through the board that the private equity fund will implement all of the structural changes in a company in the context of creating good governance – meaning deal management, setting the directives and the strategy, and creating consensus with the original management team and other board members. Private equity is an active investment and the fund will influence the board's actions and approach. Most of the times, as part of the deal structure negotiations, the private equity fund will gain majority of the boards voting rights to control company´s strategic decisions to ensure influence and control the endorsed strategies (LERNER ET AL., 2012, p.196).
After the acquisition, the general partners in the private equity fund are actively involved in the strategic direction of the portfolio company. They normally have operational control over the company through their control of its board of directors. The general partners act as advisors to the portfolio company’s management and as members of the company’s board of directors, and draw on their expertise in corporate restructurings and their contacts throughout the industry to assist in creating value. However, when needed, the private equity partners can use their control to swiftly alter company policies, remove underperforming executives, or challenge management to perform better. (MASULIS & THOMAS, 2009, p.2)
The partners of the private equity funds will most of the times maintain a couple of seats of the board to themselves to maintain a close and active approach while dealing with an investment. They may hire consultants to improve operations, develop managerial tools, and redesign organizational structures, which will enhance their value creation model. Additionally, they have strong relationship with top quality executives and bring these to manage their investments (BARRY et al., 1990, cited by TAVARES & MINARDI, 2009).
Exiting the investment is a crucial part of the private equity cycle and often the IPO is the chosen option. The funds will use the IPO as a manner to construct the reputation of the manager (MEGGINSON & WEISS, 1991). The nature of the private equity business will cause these fund to bring public several invested companies and thus the performance of the IPOs are important to endorse the quality and credibility of the sponsor fund.
members; (ii) firms backed by private equity are the best companies available in the market and the funds are able to select them as partners. Both reasons substantiate the idea that private equity fund presence works as a quality certification for IPOs (TAVARES & MINARDI, 2009, p.11).
2.4 Long-term IPO Performance and Centrality of the Board
An Initial Public Offering (IPO) is the event in which a private company offers its shares to outside investors in a process similar to an auction. It is the sale of a company (or a fraction) to the public. In the process the firm raises resources from other investors and these are used to endow the company's strategy.
Figure 1: Brazilian IPOs since 2004, source BMF&BOVESPA
The IPO process will fully test the capacity of the firm´s management team and the general maturity of the company. Several issues need to be addressed before the issuance to guarantee a successful integration with the new investors that will come with the process. Internal structuring, professional management, corporate governance and transparency are fundamental issues for companies that are in the process of going public. Additionally, organizational culture and overall production processes are likely to radically change, as the firm will be aiming to broaden its scope and influence in the market. An association with private equity or venture capital funds or even a debt issuance are often seen as intermediate steps towards the IPO, as it will serve for the firm to learn how to deal with other shareholders and bondholders (DELOITTE, 2013).
Since the management team will have to deal with all of these changes, at the same time it will bear demands coming from several different agents, is, therefore, expected that a higher quality management, with proper corporate governance, high quality board of directors and executives should positively influence the performance of the company´s IPO.
Baysinger and Hoskisson's (1990) affirm that an appropriate board composition depends on the timing and circumstance of each firm. In this paper it is discussed the importance of board composition at the time of the IPO. An IPO is an unique context to study the relationship between governance and performance, as the ex-ante board selection is an strategic movement of the company and the decision is likely to influence IPO performance (FILATOTCHEV & BISHOP, 2002).
said, it is expected a dynamic interrelationship between executive characteristics, board members, and IPO performance (FILATOTCHEV & BISHOP, 2002).
The board composition of a firm going public is the result of a negotiation between the management and outside investors and financiers of the company, as the management team wishes to control the firm's resources as much as possible and the external investors worry about their return on investment expectations and look for reduction of agency costs (BAKER ET AL., 2003).
Additionally, creating a board with skilled and knowingly competent board members is a way for the company to signalize quality and superior corporate governance to overall investors. However, this value is not always captured by general investors at the IPO date because there is a propensity that underwriting banks will to maintain an asymmetry of information when conducting an IPO to benefit institutional investors in detriment of "late" investors, so the underwriter only partially incorporates the private information into the initial price range (BENVENISTE & SPINDT, 1989; HANLEY, 1993; and CORNELLI & GOLDREICH, 2001).
It has been studied that even the public information is not fully incorporated into the offer price (LOUGHRAN & RITTER, 2002), making the IPO pricing process not fully efficient (LOWRY & SCHWERT, 2004). Setting a lower stock price at D0 and not disclosing all the information to the general public will make the stock appreciate in the short term and reward institutional investors supportive of the IPO process since its inception. This observable fact in which underwriters do not fully incorporate all available information into the offer price tend to create an IPO short-term underpricing phenomenon.
smaller that the performance of other public companies2 (RITTER, 1991; LOUGHRAN & RITTER, 1995).
Ritter (1991) believes the long-term IPO performance is explained by (i) an over-optimism of investors about the future growth of the companies and (ii) the "hot issue" market phenomenon, which enables the firms to go ahead with the IPO taking advantage of the "window of opportunity" and, in the end o the day allows weak companies with poor long-term performance to go public (RITTER, 1991).
The IPO short-term underpricing phenomenon and the IPO long-term underperformance are pointed out in numerous studies. This paradox of underpricing on day-1 and long-term underperformance is named by Loughran and Ritter (1995) as IPO price puzzle.
Recent studies have been discussing not only the information asymmetry issue in IPOs, but also have been focusing on the conceptual and empirical research on corporate governance problems of IPOs (FILATOTCHEV & BISHOP, 2002).
Overall, the majority of articles tend to associate board independence with higher corporate governance, that is, the board is understood to have better quality due to its diverse composition. Quality of the board of directors is considered a key aspect of corporate governance quality (DYER, 1996; GEDAJLOVIC & SHAPIRO, 2002). Research based on the agency theory arguments that independent board members are perceived to be better monitors of managerial good judgment (FAMA & JENSEN, 1983; SHIVDASANI, 1993; SHLEIFER & VISHNY, 1997) and, thus, through the presence of experienced independent directors on the board, the company is able to inform outside investors of its efficient and prepared corporate governance
2 Ritter (1991) measured IPO performance using an equal weighted average return in the first trading day and the
equal weighted return for a buy and hold strategy of three years using a sample of 1526 IPOs dated from 1975 to 1984. The 3-year buy and hold strategy average return is significantly lower when compared to a control sample of peer companies, being the worst performance results of younger and growing firms. The final conclusion of the author is that in the long run IPOs tend to be overpriced.
framework that will differentiate the IPO from other offerings (FILATOTCHEV & BISHOP, 2002).
3 METHODOLOGY AND DATABASE
3.1 Data and Sample Selection
3.1.1 IPO Performance Database
To construct the database of IPOs we gathered information of 148 Brazilian IPOs from 2004 to 2013 that were issued in the Brazilian financial market. Several attributes of each IPO were also collected, such as the presence of private equity funds as shareholders, underwriter, financial information of the companies, market capitalization and issuance volume, price, underpricing etc.
Table 3: IPO Sample Characteristics
Note: Constructed from IPO sample from 2004 to 2013
2004 2005 2006 2007 2008 2009
No. IPOs 7 9 25 62 3 6
Private Equity (PE) 5 4 12 19 2 3
Non-PE 2 5 13 43 1 3
% PE 71% 44% 48% 31% 67% 50%
% Non-PE 29% 56% 52% 69% 33% 50%
Financial Inst. 0 1 0 9 0 1
% Financial Inst. 0% 11% 0% 15% 0% 17%
Avg. Leverage (A/E) 3,0x 7,4x 6,4x 8,9x 3,4x 4,4x
(BRL million)
Avg. Volume 568,1 553,9 537,6 723,2 2.210,5 3.631,7
Avg. Mkt. Cap. 3.243,5 1.825,8 2.066,7 3.478,7 12.932,8 1.552.817,8
2010 2011 2012 2013
No. IPOs 11 11 3 7
PE 6 8 1 3
Non-PE 5 3 2 4
% PE 55% 73% 33% 43%
% Non-PE 45% 27% 67% 57%
Fin. Inst. 0 0 1 1
% Fin. Inst. 0% 0% 33% 14%
Avg. A/E 1,3x 7,8x 6,9x 3,4x
(BRL million)
Avg. Volume 950,1 592,0 1.311,0 2.008,7
Avg. Mkt. Cap. 3.075,6 2.319,9 5.108,8 9.535,6
We collected the prices of the offered stocks in Economática up to one year of the IPO inception, totalling 252 days of observations for each case. We also collected the IBOVESPA index for the same dates of the prices to calculate the abnormal returns (AR) of each stock. The final sample selection comprised 144 companies, because four were discarded due to incomplete price information3 and inability to calculate 1-year CAR, which is the dependent variable of the proposed model of this study.
3.1.2 Board Centrality Database
To build the board interlock database to estimate centrality of the boards we collected the board of directors data in CVM4 from Brazilian public companies with shares traded in BM&FBOVESPA from 2002 to 2013. We used the IAN (up to 2009) and Formulário de Referência (from 2009 and 2013), which are yearly reports that contain the names of the board of directors of the companies. We collected data from 592 companies from 2002 to 2013. The total number of directors reached 9117 names.
Table 4: Statistics of the Board Interlock Database
Note: Constructed from CVM data
3 If the number of observations were at least 190, the company was kept in the sample. 4 CVM: Comissão de Valores Mobiliários
No. Companies No. Directors
2002 347 2319
2003 323 2415
2004 327 2503
2005 340 2573
2006 347 2925
2007 385 2877
2008 377 2922
2009 374 2887
2010 359 2828
2011 353 2861
2012 339 2724
2013 331 2697
Minimum 323,0 2319,0
Maximum 385,0 2925,0
Average 350,2 2710,9
3.2 IPO Performance vs. Centrality Model
The following model tries to estimate the relation between the proxy used to calculate IPO performance (CAR), which is the dependent variable of the equation, and the proxies of board centrality, which were estimated using the network constructed based on board interlocks of Brazilian public companies.
CAR = 1 + CENTRALITY* 2 + PE* 3 + ANO2007* 4 + ANOCRISE* 5 + LNVOL* 6 +
PRIMARIA* 7 + UNDERWRIT* 8 + LNMARKETCAP* 9 + MTB* 10 + GAF* 11 + (i)
In which,
CAR = cumulative abnormal return of 1 year, the dependent variable
1 = constant
CENTRALITY = score for company’s centrality (detailed below) PE = dummy for private equity fund as shareholder ANO2007 = dummy for IPOs issued in 2007
ANOCRISE = dummy for IPOs issued in 2008 and 2009 LNVOL = natural logarithm of issuance volume PRIMARIA = percentage of primary issuance
UNDERWRITER = dummy if underwriter is Pactual, UBS, UBS Pactual or Credit Suisse LNMARKETCAP = natural logarithm of firm’s market capitalization
MTB = market to book ratio
GAF = leverage, calculated as total assets divided by total equity = residual error
CENTRALITY can be centrality scores for either: (i) DEGREE, degree centrality; (ii) EIGENVECT, eigenvector centrality; (iii) CLOSENESS, closeness centrality; and (iv) BETWEENNE, betweenness centrality.
years (2008 and 2009), (iv) the issuance volume, (v) the percentage of primary offer, and (vi) the underwriting bank. The third group comprises variables more related to the issuer company, i.e. (i) the company’s market capitalization, (ii) the market to book ratio, and (iii) the leverage of the company.
3.2.1 Estimating IPO Performance – the Dependent Variable
IPO return can be summarized as the amount by which a share that has been sold at a specific trading date exceeds its first offering price (at the date of the IPO). In this study, I used the 1-year CAR (cumulative abnormal return) to measure IPO return, which is the daily abnormal returns (AR) of a stock calculated for a year after the firm’s IPOs. The CAR is the sum of the daily abnormal returns since the first public offering for one year.
Why use abnormal returns to calculate IPO performance? The use of CAR can be can be supported by the theory of event studies in economics and finance. In his article, MacKinlay (1997) conducts the reader into the estimation of an abnormal returns caused by an event. The theory is based on the assumption that current prices of firms’ stock reflect the information available in the market, so an event would trigger an abnormal return on these stocks. In event studies, the impact on the price is the focus point of the analysis. Some examples of events are processes of M&A, earnings announcements, new debt issuance, new equity issuance– including IPOs. (MACKINLAY, 1997, p.13).
The event of an IPO would trigger abnormal returns of the stock specially because, in general, companies have to go through a radical change in terms of corporate governance and internal restructuring to go public. The company needs to be well prepared in terms of financial health and corporate governance to be appealing for new outside investors.
An overall stock return can be decompounded in systematic and non-systematic return. Abnormal returns (AR) are the one related to the non-systematic portion of the overall return, i.e. the return not influenced by the market. The systematic portion of overall return would be calculated considering alpha (α) and beta (β), according to the AR following formula.
AR = Ri – (α + β*RM) (ii)
In which,
AR = abnormal return Ri = return of stock i
α = alpha, the constant of the regression between the returns of a certain asset and the return of the market portfolio
β = beta, sensitivity of expected excess asset returns to the expected market return RM = return of the market portfolio
However, a simplified version of the formula is used due to the fact that in an IPO there are no historical series to estimate the alpha (α) and beta (β) components. A market adjusted model will be adopted; a simplification in which α = 0 and β =1:
ARt = Ri – RM (iii)
In which,
ARt = abnormal return at time t Ri = return of stock i
The returns were calculated daily and compared to the market portfolio return. The IBOVESPA return was used as a proxy for the Brazilian market portfolio. The daily abnormal returns were calculated for a year after the firm’s IPOs. The CAR is the sum of these daily returns since the first public offering for one year. CAR, the cumulative abnormal return, is the dependent variable of the model. Its formula is shown in the sequence.
CAR =
ARt
(iv)In which,
CAR = cumulative abnormal return ARt = abnormal return at time t
3.2.2 Estimating Board Centrality
To estimate the centrality of the board of directors, the board interlock database was analyzed in Ucinet software. A 2-mode network method was considered to estimate the centrality indicators. The 2-mode data is a network in which there are two kinds of entities named actors and events which have a binary relation, e.g. a membership or participation that link these actors and events. In this study, the actors are the companies and the event is having a specific director in this company´s board. The data is disposed as a 2-mode matrix comprised of rows – the companies (actors) – and columns – the directors’ names (events). The analysis of 2-mode data includes the basic assumption that if more than one actor takes part of the same event, there is a potential for interaction or relationship between these two actors (EVERETT & BORGATTI, 2005, p.9).
A good example of a 1-mode social network is a network of friendship ties among a set of school children or relations within an organization. Some examples of a 2-mode network can be the relation between people and organizations, or people and events. For example, which university students belong to which campus organizations, or which employees in an company take part in which electronic discussion forums, i.e. the affiliations of actors in events. A co-membership is considered an opportunity for social relationship among individuals and ties between organizations through their members are considered a channel through which organizations influence one another. In Borgatti's words, "in the interlocking directorate literature, membership of executives on corporate boards is collected mainly in order to understand how corporations are intertwined, and how the structure of this connectivity affects corporate control of society" (2009, p. 8281).
In this study it means that if more than one company has a specific director as part of their board, a board interlock occurs and a node is created.
Four indicators of centrality were calculated year by year using the 2-mode network approach: (a) degree, (b) eigenvector, (c) closeness and (d) betweenness.
• Degree Centrality
The degree centrality of an actor or event is the number of edges incident upon the node (BORGATTI & EVERETT, 1997, p.254). It is possible to calculate the degree centrality without having the full information of a network, because you can get the degree score by simply counting the number of ties a given node has. Degree centrality can be understood as a property of a node's position within the network and not a real centrality indicator (BORGATTI ET AL., 2013).
the dividing a company´s degree by the total number of directors (and vice-versa for directors), so the numbers are expressed as a percentage, so the two-mode normalization makes centrality scores to range from zero to one hundred (EVERETT & BORGATTI, 2005, p.10). The degree centrality formulas are shown below:
d
i =Σ
x
ij (v)d
iNORMALIZED =d
i/
ni (vi)In which,
di = centrality of degree i = a specific actor (company) x = adjacent matrix
xij = (i,j) entry of the adjacent matrix
diNORMALIZED = normalized degree centrality for 2-mode networks ni = total number of events (directors)5
• Eigenvector Centrality
The eigenvector centrality of a node is a variation of degree centrality; it is considered the sum of contiguous nodes, but weighted by the centrality of each of these contiguous nodes. The eigenvector score takes into account the influence of the individual’s contacts’ within the network, considering the “friends” and the “friends of friends” centrality to quantify overall influence of an individual. According to Borgatti and Everett (1997), it is "the weighted degree measure in which the centrality of the node is proportional to the sum of centralities of the nodes it is adjacent to" (p.257).
This means that a company's centrality will be the sum of centralities of the directors which are part of its board and, concurrently, a director's centrality is the sum of centralities of the companies that he or she has a seat in (BORGATTI & EVERETT, 1997). The interpretation of the eigenvector centrality can be a proxy for popularity,
5 Should the calculated score be the centrality of an event (director), the n would n
o which is the total number of
as a node with high eigenvector centrality is a well connected player in a network because its contacts (subjacent nodes) are well connected themselves (BORGATTI ET AL., 2013). In a 2-mode network, the normalized eigenvector centrality (formula (viii) below) is the raw score divided by the square root of one divided by two times the size of the vertex that the node belongs to (BORGATTI & EVERETT, 1997).
e
i =λ Σ
x
ije
j (vii)e
iNORMALIZED =e
i/
(viii)In which,
ei = eigenvector centrality score i = a specific actor (company)
λ
= the eigenvaluex = adjacent matrix
xij = (i,j) entry of the adjacent matrix
eiNORMALIZED = normalized eigenvector centrality for 2-mode networks no = total number of actors (companies)
• Closeness Centrality
likely to receive information with better quality and reliability (BORGATTI ET AL., 2013).
For a 2-mode network, the approach should be, similar to what has been discussed for the degree centrality, to apply the original measures normalizing the scores to reflect the restrictions on which nodes can be adjacent. The adjustment for a 2-mode network considers the theoretical minimum value of (ni + 2no - 2). For an actor (company) the raw closeness score is multiplied by (ni + 2no - 2) (BORGATTI & EVERETT, 1997, p.256).
c
i =1
/
Σ
g
ij (ix)c
iNORMALIZED =c
i (ni + 2no - 2) (x)In which,
ci = centrality of closeness i = a specific actor (company) gij = geodesic distance
ciNORMALIZED = normalized closeness centrality for 2-mode networks ni = total number of events (directors)
no = total number of actors (companies)
• Betweenness Centrality
create new ties and disrupt the original network configuration (BORGATTI & EVERETT, 1997, p.256; BORGATTI ET AL., 2013).
In a 2-mode network, the betweenness score normalization formulas are more complex than the others discussed hereinbefore.The formulas adjusted for a 2-mode network are divided in two situations, depending on which vertex (actors or events) is larger than the other, as seen below (BORGATTI & EVERETT, 1997, p.257):
b
i =Σ
g
jik/
g
jk , i<k (xi)b
iNORMALIZED = 2(no - 1)(ni - 1) ; no > ni (xii)b
iNORMALIZED = ni (ni - 1) + (no - 1)( no - 2) + (no - 1)( ni - 1) ; ni < no (xiii)In which,
bi = centrality of betweenness i = a specific actor (company)
gjik = geodesic distances connecting j and k through i gjk = geodesic distances connecting j and k
biNORMALIZED = normalized betweenness centrality for 2-mode networks ni = total number of events (directors)
no = total number of actors (companies)
The centrality scores were calculated using UCINET software in the previous year of the IPO, i.e. if the IPO of the company took place in year T, the centrality in T-1 was considered. The board information at the IPO inception date was replicated on T-1 if the board of directors’ information was not already available in the previous year of the IPO at CVM website.
Table 5: Statistics of Centrality Scores
Note: Constructed from UCINET outputs
2002 Degree Eigenvector Closeness Betweennes 2003 Degree Eigenvector Closeness Betweennes
minimum 0,001 0,000 0,131 0,000 minimum 0,001 0,000 0,150 0,000
quartile 25th 0,002 0,000 0,230 0,000 quartile 25th 0,002 0,000 0,234 0,000
quartile 50th 0,003 0,000 37,338 0,000 quartile 50th 0,003 0,000 7,454 0,000
quartile 75th 0,005 0,000 404,500 0,003 quartile 75th 0,005 0,000 407,500 0,003
maximum 0,014 0,485 2427,000 0,068 maximum 0,016 0,534 2445,000 0,055
average 0,004 0,008 239,861 0,004 average 0,004 0,009 223,407 0,004
std. deviation 0,002 0,053 319,291 0,008 std. deviation 0,003 0,055 318,711 0,009
median 0,003 0,000 37,338 0,000 median 0,003 0,000 7,454 0,000
no. obs/firms 347 347 347 347 no. obs/firms 323 323 323 323
2004 Degree Eigenvector Closeness Betweennes 2005 Degree Eigenvector Closeness Betweennes
minimum 0,001 0,000 0,136 0,000 minimum 0,001 0,000 0,148 0,000
quartile 25th 0,002 0,000 0,210 0,000 quartile 25th 0,003 0,000 0,242 0,000
quartile 50th 0,003 0,000 0,291 0,000 quartile 50th 0,003 0,000 3,537 0,000
quartile 75th 0,005 0,000 421,667 0,004 quartile 75th 0,005 0,000 444,500 0,004
maximum 0,015 0,486 1265,000 0,092 maximum 0,014 0,566 1333,500 0,046
average 0,004 0,008 220,506 0,005 average 0,004 0,006 217,942 0,004
std. deviation 0,002 0,055 298,376 0,011 std. deviation 0,002 0,054 310,370 0,008
median 0,003 0,000 0,291 0,000 median 0,003 0,000 3,537 0,000
no. obs/firms 327 327 327 327 no. obs/firms 340 340 340 340
2006 Degree Eigenvector Closeness Betweennes 2007 Degree Eigenvector Closeness Betweennes
minimum 0,001 0,000 0,112 0,000 minimum 0,000 0,000 0,103 0,000
quartile 25th 0,002 0,000 0,191 0,000 quartile 25th 0,002 0,000 0,167 0,000
quartile 50th 0,003 0,000 0,232 0,002 quartile 50th 0,003 0,000 0,200 0,002
quartile 75th 0,004 0,000 378,125 0,007 quartile 75th 0,004 0,000 404,143 0,007
maximum 0,011 0,502 1512,500 0,049 maximum 0,005 0,437 1414,500 0,074
average 0,003 0,010 206,390 0,005 average 0,003 0,007 199,391 0,006
std. deviation 0,002 0,050 333,818 0,008 std. deviation 0,001 0,050 316,837 0,010
median 0,003 0,000 0,232 0,002 median 0,003 0,000 0,200 0,002
no. obs 388 388 388 388 no. obs/firms 385 385 385 385
2008 Degree Eigenvector Closeness Betweennes 2009 Degree Eigenvector Closeness Betweennes
minimum 0,001 0,000 0,087 0,000 minimum 0,001 0,000 0,085 0,000
quartile 25th 0,002 0,000 0,162 0,000 quartile 25th 0,002 0,000 0,158 0,000
quartile 50th 0,003 0,000 0,194 0,003 quartile 50th 0,003 0,000 0,188 0,003
quartile 75th 0,004 0,000 430,000 0,008 quartile 75th 0,004 0,000 427,286 0,008
maximum 0,012 0,568 1505,000 0,091 maximum 0,012 0,625 1495,500 0,098
average 0,003 0,006 222,290 0,007 average 0,003 0,006 220,977 0,007
std. deviation 0,002 0,051 358,256 0,011 std. deviation 0,002 0,051 365,172 0,011
median 0,003 0,000 0,194 0,003 median 0,003 0,000 0,188 0,003
no. obs/firms 377 377 377 377 no. obs/firms 374 374 374 374
2010 Degree Eigenvector Closeness Betweennes 2011 Degree Eigenvector Closeness Betweennes
minimum 0,000 -0,593 0,105 0,000 minimum 0,000 0,000 0,109 0,000
quartile 25th 0,002 0,000 0,184 0,000 quartile 25th 0,002 0,000 0,180 0,000
quartile 50th 0,003 0,000 0,217 0,003 quartile 50th 0,003 0,000 0,207 0,003
quartile 75th 0,004 0,000 418,000 0,007 quartile 75th 0,004 0,000 327,778 0,008
maximum 0,012 0,000 2926,000 0,086 maximum 0,013 0,546 2950,000 0,109
average 0,004 -0,006 232,448 0,006 average 0,004 0,007 200,396 0,006
std. deviation 0,002 0,053 397,771 0,010 std. deviation 0,002 0,053 382,498 0,011
median 0,003 0,000 0,217 0,003 median 0,003 0,000 0,207 0,003
no. obs/firms 359 359 359 359 no. obs/firms 353 353 353 353
2012 Degree Eigenvector Closeness Betweennes 2013 Degree Eigenvector Closeness Betweennes
minimum 0,000 0,000 0,127 0,000 minimum 0,001 0,000 0,098 0,000
quartile 25th 0,002 0,000 0,187 0,000 quartile 25th 0,002 0,000 0,152 0,000
quartile 50th 0,003 0,000 0,226 0,002 quartile 50th 0,003 0,000 0,180 0,003
quartile 75th 0,004 0,000 405,143 0,008 quartile 75th 0,004 0,000 311,889 0,010
maximum 0,013 0,441 2836,000 0,068 maximum 0,013 0,592 1403,500 0,078
average 0,004 0,008 222,648 0,006 average 0,004 0,006 168,176 0,008
std. deviation 0,002 0,054 369,364 0,010 std. deviation 0,002 0,055 298,235 0,012
median 0,003 0,000 0,226 0,002 median 0,003 0,000 0,180 0,003
3.2.3 Private Equity Fund Presence
The model includes a dummy variable ("PE") to denote if the company at the time of the IPO had a private equity fund as shareholder. The presence of a private equity fund may indicate that the board of the firm is more active and involved, due to the fact that the board of directors is a key tool of the corporate governance framework for private equity funds. So it is expected that IPOs of firms with private equity investment will have better performance.
When private equity funds buy a share of a company, they are willing to manage the firm in a way to create value through management and governance and, therefore, maximize their return on investment. It is likely that the fund will use their power and legally endorsed role to create value via financial engineering, cost reduction, increased sale and scope, management recruitment, incentivization and mentoring (LERNER ET AL., 2012, p.189).
3.2.4 Control Variables
The control variables are related to the offer and also related to the company, as described below:
• Year of 2007
A dummy variable ("ANO2007") to denote IPOs issued in 2007. This year was an outlier in terms of the number of IPOs issued – there were 62 offers, 148% higher than the second year with the highest number of issuances, which was 2006 with 25 IPOs.
• Year of crisis
• Issuance Volume
A variable ("LNVOL") to control for the size of the IPO, calculated as the amount the shares value in Reais (BRL) offered in each issuance. The final value is the natural logarithm of the issuance volume to equalize the coefficient of the variable.
• Primary Offering
This variable ("PRIMARIA") is to indicate the percentage of the total issuance volume that relates to primary offering. The total volume offered related to a primary offer is the first issuance of stock for public sale when a private company goes public6.
• Underwriting Banks
A dummy variable ("UNDERWRITER") to denote if underwriter is Pactual, UBS, UBS Pactual or Credit Suisse. These banks alone, from 2004 to 2013, were the underwriters of 53 IPOs, meaning 36% of the IPOs issued in the last 10 years.
• Market Capitalization
It is a variable ("LNMARKETCAP") to control for the size of the company measure by market capitalization. The variable is calculated taking the number of outstanding shares at the date of the IPO, multiplied by the issuance price, totalling the market capitalization of the company at the time of the IPO inception. The final indicator is the natural logarithm of the firm’s market capitalization to equalize the coefficient of the variable.
• Market-to-Book Ratio
The market to book ratio is a variable ("MTB") that indicates the market value in comparison to the accounting value of the company. The market value is determined by the price in the stock market multiplied by the number of outstanding shares. The book value is the total equity value reported in the balance sheet of the companies as of the last quarterly press release available before the IPO date, e.g. if the IPO date is May 5th 2012, the balance sheet information is related to March 31st 2012.
6 A secondary offer occurs when there is public sale of stock that has already been in an initial public offering
• Leverage
It is a variable ("GAF") to control for the leverage of the company, calculated as total assets divided by total equity. It was not possible to calculate leverage using debt indicators because the sample contains several financial institutions. The total assets and total equity values taken were reported in the balance sheet of the companies as of the last quarterly press release available before the IPO date.
3.3 Hypotheses
In order to test the impact of centrality in IPO performance, regression models using cross-section data and the OLS method were estimated. The following model intends to estimate the linear relation between CAR and company centrality measured by four centrality scores – degree, eigenvector, closeness and betweenness – based on the board interlock database. The model also takes into consideration the private equity fund presence at the time of the IPO.
3.3.1 Hypothesis 1
• Cumulative Abnormal Return & Board of Directors
The board of directors is an important tool of the corporate governance framework for a firm to surmount strategic thresholds, such as an initial public offering. To have expert directors seating in the board is a way of structuring the firm to overcome such thresholds (HUSE, 2007). A higher centrality board is likely to positively influence company’s overall return, as they are expected to arrange alliances and partnerships, as well as have access to relevant information that flow into the directors network (MIZRUCHI, 1996; MOL, 2001; and LARCKER ET AL., 2013). The first main hypothesis was divided into four sub-hypothesis to reflect the differences between the centrality scores calculated in this study.
company and helping with the firm's decisions can have a positive effect on the IPO performance; therefore:
H1a: If degree centrality of the board of directors is a proxy for quality, companies with more central directors measured by degree score will have superior IPO performance measured by CAR.
The eigenvector centrality of a company indicates the power and influence that this company has within the network and this score takes into consideration the centrality of the contacts of a certain node. Considering this, a more powerful and influential company, with influent contacts, is likely to have a positive effect on the IPO performance; consequently:
H1b: If eigenvector centrality of the board of directors is a proxy for quality, companies with more central directors measured by eigenvector score will have superior IPO performance measured by CAR.
The closeness centrality shows how central or peripheral a certain firm is inside the network. The score can be viewed as the efficiency and accuracy of each node (actor) in receiving or spreading information to all other nodes. A company with higher closeness is located within the crowd of a network. In that location, the firm shall take advantage of this privileged position and absorb information and knowledge with higher accuracy. Having said this, companies with higher closeness scores shall have better awareness and thus have a positive effect on the IPO performance; so:
H1c: If closeness centrality of the board of directors is a proxy for quality, companies with more central directors measured by closeness score will have superior IPO performance measured by CAR.
position to control information. Since this is understood to be beneficial to the firm, it shall have a positive effect on the IPO performance; thus:
H1d: If betweenness centrality of the board of directors is a proxy for quality, companies with more central directors measured by betweenness score will have superior IPO performance measured by CAR.
These sub-hypothesis (H1a, H1b, H1c and H1d) are based on the assumption that all four centrality indicators can be a proxy for quality. If this is true, high quality boards are likely to be better prepared to support their firm in the process of going public and this will result in higher IPO performance measured by CAR.
3.3.2 Hypothesis 2
• Cumulative Abnormal Return & Private Equity
This hypothesis is related to the idea that private equity funds alone influence the IPO performance of the company measured by CAR. Private equity funds via active management will improve corporate governance of an invested firm, increasing quality and importance of the board of directors.
H2a: Private equity funds presence is positively related to superior IPO performance measured by CAR.
• Private Equity & Board Centrality
The thought of this hypothesis is that private equity funds have their company monitoring model focused on the board of directors. These funds will enhance corporate governance and quality of the board in their invested companies, as the board is the key tool of the corporate governance framework for private equity funds (LERNER ET AL., 2012). Therefore, if centrality is a proxy of quality of the board of directors, companies associated with private equity funds will have more central boards of directors.
H2b: Centrality is positively related to private equity fund presence
3.3.3 Hypothesis 3
• Cumulative Abnormal Return & Private Equity interacting with Board of
Directors
This hypothesis combines private equity association with board centrality to investigate if the interaction variable of private equity and centrality influences IPO performance. It is based on the assumption that (i) a firm’s association with a private equity fund and (ii) higher centrality of the board of directors will have a positive effect on a company’s IPO performance measured by CAR.
3.3.4 Hypothesis 4
• Cumulative Abnormal Return & Board of Directors for Non-PE Firms
This hypothesis is based on the assumption that not all companies are interested and can or are willing to afford an association with a private equity fund. So for a sample segmentation with the group of companies that did not have the support of private equity funds during their IPO process, is board centrality more relevant.
Private equity funds are not only active in changing the way the board of directors work in a company, it is also active in the operational and structural frameworks and the idea of this hypothesis is that a higher centrality board may serve as a proxy or substitute of private equity funds in terms of mentoring, structuring and decision making processes.
4 RESULTS
The results of the tests are discussed in this section. The dependent variable is CAR, if otherwise noted. The results will be further examined in the Chapter 5, within the conclusion of the outcomes.
4.1 Cumulative Abnormal Return & Board of Directors
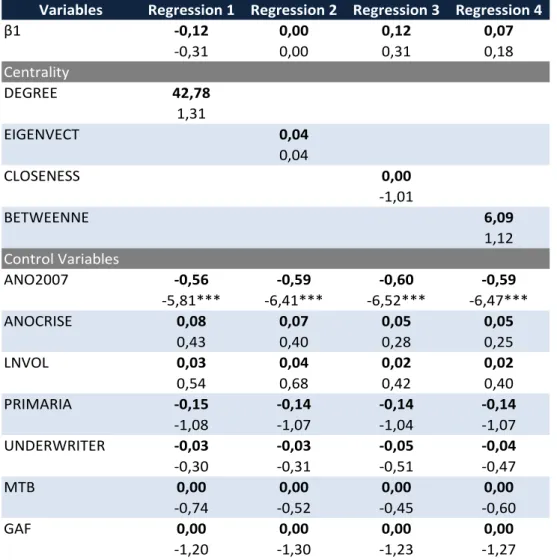
The first four regressions were conducted to examine H1, which is divided into four sub-hypothesis. H1 was designed to test if centrality of the board measured by degree (H1a), eigenvector (H1b), closeness (H1c) and betweenness (H1d) is a proxy for quality considering that companies with more central board of directors have superior IPO performance measured by CAR. The dependent variable CAR was estimated with the interest independent variable centrality and controlled by the year of 2007 (dummy if IPO happened in 2007, the year with an outlier number of issuances), crisis years (dummy for 2008 and 2009), IPO volume, primary offering percentage, underwriter (dummy if UBS, Pactual, UBS Pactual or Credit Suisse), market-to-book ratio and leverage (total assets divided by total equity). One regression was made for each sub-hypotheses based on the centrality indicators, i.e. (i) degree, (ii) eigenvector, (iii) closeness and (iv) betweenness. Private equity (PE) presence was not included in these first four regressions.
CAR = 1 + CENTRALITY* 2 + ANO2007* 3 + ANOCRISE* 4 + LNVOL* 5 + PRIMARIA* 6
+ UNDERWRITER* 7 + MTB* 8 + GAF* 9 + (xiv)
Table 6: Regressions 1, 2, 3 and 4 – Cumulative Abnormal Return & Board of Directors (without Private Equity dummy)
*** Significant at 1%; ** Significant at 5%; * Significant at 10%.
Note: Constructed from the research database
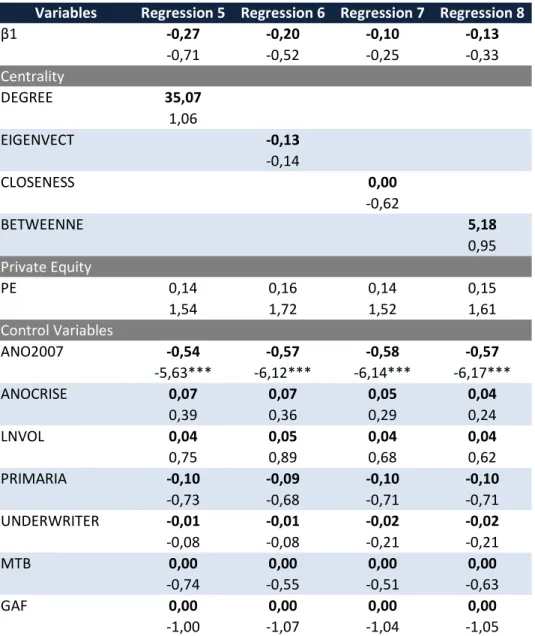
Still to test H1 (and the four sub-hypothesis), another set of regressions were done with the same variables, only this time the private equity presence was included in the model. The PE variable was taken out of the first regressions to investigate if its presence would intervene in the relation between CAR and centrality.
CAR = 1 + CENTRALITY* 2 + PE* 3 + ANO2007* 4 + ANOCRISE* 5 + LNVOL* 6 +
PRIMARIA* 7 + UNDERWRITER* 8 + MTB* 9 + GAF* 10 + (xv)
No considerable results were found for these regressions as well. The only significant coefficient was also for the dummy variable year of 2007, that can be explained by
Variables Regression 1 Regression 2 Regression 3 Regression 4
β1 -0,12 0,00 0,12 0,07
-0,31 0,00 0,31 0,18
Centrality
DEGREE 42,78
1,31
EIGENVECT 0,04
0,04
CLOSENESS 0,00
-1,01
BETWEENNE 6,09
1,12
Control Variables
ANO2007 -0,56 -0,59 -0,60 -0,59
-5,81*** -6,41*** -6,52*** -6,47*** ANOCRISE 0,08 0,07 0,05 0,05
0,43 0,40 0,28 0,25
LNVOL 0,03 0,04 0,02 0,02
0,54 0,68 0,42 0,40 PRIMARIA -0,15 -0,14 -0,14 -0,14
-1,08 -1,07 -1,04 -1,07 UNDERWRITER -0,03 -0,03 -0,05 -0,04
-0,30 -0,31 -0,51 -0,47
MTB 0,00 0,00 0,00 0,00
-0,74 -0,52 -0,45 -0,60
GAF 0,00 0,00 0,00 0,00
the usage of 1-year CAR, as already mentioned. The following table shows the results of regressions 5, 6, 7 and 8 using the OLS method and including private equity presence.
Table 7: Regressions 5, 6, 7 and 8 – Cumulative Abnormal Return & Board of Directors (with Private Equity dummy)
*** Significant at 1%; ** Significant at 5%; * Significant at 10%.
Note: Constructed from the research database
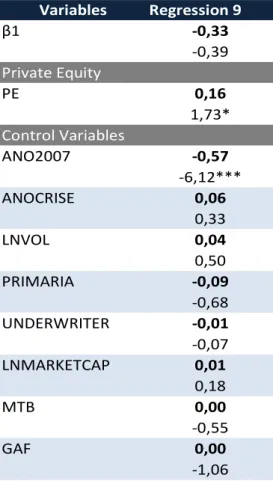
4.2 Cumulative Abnormal Return & Private Equity
The following regression was conducted to test H2a – if private equity (PE) funds presence is positively related to superior IPO performance measured by CAR. The
Variables Regression 5 Regression 6 Regression 7 Regression 8
β1 -0,27 -0,20 -0,10 -0,13
-0,71 -0,52 -0,25 -0,33
Centrality DEGREE 35,07 1,06 EIGENVECT -0,13 -0,14 CLOSENESS 0,00 -0,62
BETWEENNE 5,18
0,95 Private Equity
PE 0,14 0,16 0,14 0,15
1,54 1,72 1,52 1,61
Control Variables
ANO2007 -0,54 -0,57 -0,58 -0,57
-5,63*** -6,12*** -6,14*** -6,17***
ANOCRISE 0,07 0,07 0,05 0,04
0,39 0,36 0,29 0,24
LNVOL 0,04 0,05 0,04 0,04
0,75 0,89 0,68 0,62
PRIMARIA -0,10 -0,09 -0,10 -0,10
-0,73 -0,68 -0,71 -0,71
UNDERWRITER -0,01 -0,01 -0,02 -0,02
-0,08 -0,08 -0,21 -0,21
MTB 0,00 0,00 0,00 0,00
-0,74 -0,55 -0,51 -0,63
GAF 0,00 0,00 0,00 0,00
dependent variable CAR was estimated with the interest independent dummy variable PE and no centrality scores were included in the model. The idea was to test if PE had a significant relation to CAR without the interference of board centrality. Control variables were the year of 2007, crisis years, IPO volume, primary offering percentage, underwriter, market capitalization of the company (at the date of the IPO), market-to-book ratio and leverage.
CAR = 1 + PE* 2 + ANO2007* 3 + ANOCRISE* 4 + LNVOL* 5 + PRIMARIA* 6 +
UNDERWRITER* 7 + LNMARKETCAP* 8 + MTB* 9 + GAF* 10 + (xvi)
It was found a significant evidence that PE presence positively influences IPO performance measured by 1-year CAR was found. The PE coefficient is positive and significant at 10% confidence. Again the dummy variable year of 2007 coefficient is significant at 1%. The results of the regression can be seen in the following table.
Table 8: Regression 9 – Cumulative Abnormal Return & Private Equity
*** Significant at 1%; ** Significant at 5%; * Significant at 10%.
Note: Constructed from the research database
Variables Regression 9
β1 -0,33
-0,39
Private Equity
PE 0,16
1,73*
Control Variables
ANO2007 -0,57
-6,12*** ANOCRISE 0,06
0,33
LNVOL 0,04
0,50 PRIMARIA -0,09
-0,68 UNDERWRITER -0,01
-0,07 LNMARKETCAP 0,01
0,18
MTB 0,00
-0,55
GAF 0,00
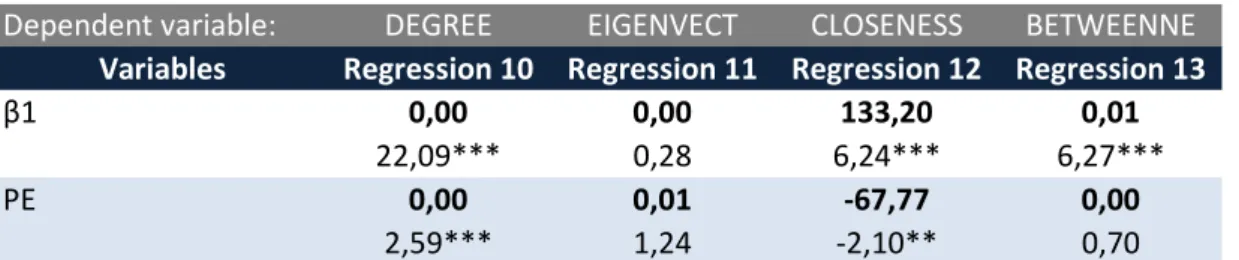
4.3 Private Equity & Board Centrality
Still with focus on PE, the following regression was conducted to test H2b – if centrality is positively related to private equity fund presence. The centrality scores (degree, eigenvector, closeness and betweenness) were now used as the dependent variable of the model and PE was the interest independent variable of the model. The idea was to test if PE had a significant relation to the centrality indicators, without interference of any other variable. Four regressions were conducted, one of each type of centrality score as the dependent variable.
CENTRALITY = 1 + PE* 2 (xvii)
It was found evidence that the relation of PE and centrality is positive for the degree centrality score (at 1%) and negative for closeness centrality score (at 5%). The other two centrality scores (eigenvector and betweenness) did not have significant coefficients. The results of the four regressions can be seen in the following table.
Table 9: Regressions 10, 11, 12 and 13 – Private Equity & Board Centrality
*** Significant at 1%; ** Significant at 5%; * Significant at 10%.
Note: Constructed from the research database
Dependent variable: DEGREE EIGENVECT CLOSENESS BETWEENNE
Variables Regression 10 Regression 11 Regression 12 Regression 13
β1 0,00 0,00 133,20 0,01
22,09*** 0,28 6,24*** 6,27***
PE 0,00 0,01 -67,77 0,00
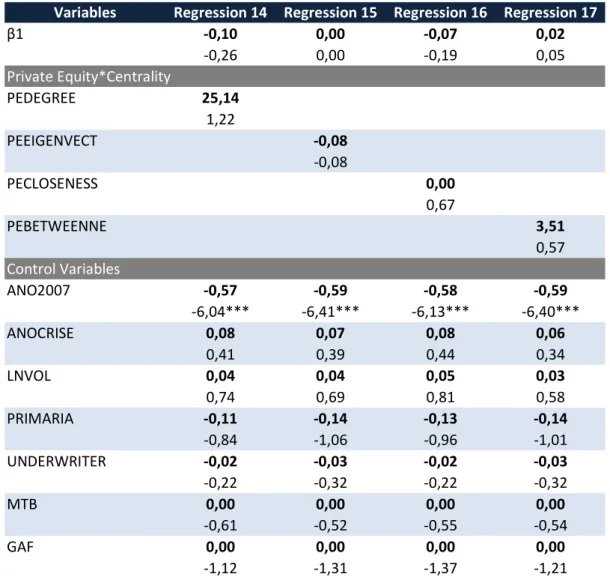
4.4 Cumulative Abnormal Return & Private Equity interacting with Board of
Directors
The subsequent regressions were performed to test H3 – if IPOs of companies with both (i) association with private equity funds and (ii) with more central boards will have better performance measured by CAR. The dependent variable of the model is 1-year CAR, the interest independent variable is a result of the interaction between PE and centrality, the latter being always represented by the four centrality indicators. The control variables are the year of 2007, crisis years, IPO volume, primary offering percentage, underwriter, market-to-book ratio and leverage. One regression was made for each centrality indicator, i.e. (i) degree, (ii) eigenvector, (iii) closeness and (iv) betweenness.
CAR = 1 + PE*CENTRALITY* 2 + ANO2007* 3 + ANOCRISE* 4 + LNVOL* 5 +
PRIMARIA* 6 + UNDERWRITER* 7 + MTB* 8 + GAF* 9 + (xviii)