AERA Open January-March 2017, Vol. 3, No. 1, pp. 1 –20 DOI: 10.1177/2332858416680566 © The Author(s) 2017. http://ero.sagepub.com
ONCE again, we find ourselves at the threshold of a new
pol-icy era aimed at improving student learning through the introduction of challenging academic standards and accom-panying student examinations. The Common Core State Standards (CCSS) in mathematics and English language arts, as well as the Next Generation Science Standards, have shifted states’ and school districts’ agendas toward ensuring that all students leave high school “college and career ready.” Even for those states that have not adopted the CCSS and aligned examinations, many are reassessing and realigning their standards and their testing programs to “live up to” to these new, more ambitious standards. In mathematics, this means that students must develop not only skill efficiency but also more rigorous ways of thinking and reasoning and deeper levels of conceptual understanding.
The changes that must happen in order for students to reach these goals are immense, and once again, teachers find themselves as both the targets and the agents of reform (Cohen, 1990). They are targets because poor instruction is implicitly identified as the cause of unacceptably low lev-els of student performance; they are agents because teach-ers are widely seen as representing our nation’s best opportunity to foster enhanced student learning. There are, however, few guidelines and little support for teachers to
learn how to become agents of reform. Standards do not prescribe how to teach. At the same time, there is a lack of consensus in the research and practice communities regard-ing the specific features of teachregard-ing that foster deeper lev-els of student learning.
We argue that making headway on this challenge will require advances in our theories of how teaching affects stu-dent learning and progress in how we measure instruction. Theory is required to draw our attention to particular features of teaching that matter for students’ development of concep-tual understanding and to guide the development of mea-sures. Measurement is required to devise new ways of ascertaining the status of instructional practice at scale.
This article draws from a larger investigation of instruc-tional practice and student learning that we are conducting in the state of Tennessee. After spending Race to the Top resources on statewide teacher professional development in mathematics, state education leaders wanted to be able to monitor the range and variability of mathematics instruction across the state in ways that could inform decisions about future allocation of resources in the new standards-based era. Tennessee was one of the first states to adopt the CCSS, and although the state has transitioned to Tennessee stan-dards, these new state-based standards are aligned with the
Using Theory and Measurement to Sharpen Conceptualizations
of Mathematics Teaching in the Common Core Era
Mary Kay Stein Richard Correnti
Debra Moore Jennifer Lin Russell
Katelynn Kelly
University of Pittsburgh
We argue that large-scale, standards-based improvements in the teaching and learning of mathematics necessitate advances in our theories regarding how teaching affects student learning and progress in how we measure instruction. Our theory—an embodiment of the interaction of high and low levels of two constructs that past research has shown to influence students’ development of conceptual understanding (explicit attention to concepts and students’ opportunity to struggle)—guided the development of survey-, video-, and artifact-based measures of teaching. Here, we develop a validity argument for the infer-ences that can be drawn about teaching from these measures by identifying claims and empirical evidence about the extent to which those claims are born out in practice. Results suggest our theory is capturing four patterns of teaching and that it can successfully predict different types of student learning: skills efficiency measured on the state standardized test and con-ceptual understanding as measured through open-ended task sets.
Keywords: educational policy, instructional practices, mathematics education, measurements, mixed methods, survey
Stein et al.
Common Core. In this context, we are conducting a study of natural variation in fourth- to eighth-grade mathematics teaching and student learning across the state.
The overall purpose of this article—the first in a series grounded in the Tennessee work—is to describe the theoreti-cal framework that anchors our work and to generate and test claims grounded in that framework. In so doing, we take the first steps toward constructing a validity argument regarding the inferences that can be made about teaching based on teachers’ responses to survey items aimed at measuring key features of mathematics instruction that matter for student learning in the Common Core era. The article unfolds in four sections. We begin by describing our theoretical framework and its relevance for studying and improving teaching in the Common Core era. In this section we also lay out a set of claims, patterns, and relationships that we predict will hold based on the theoretical framework. In the next section, we describe our methods for measuring and analyzing instruc-tion and student learning aligned with the theoretical frame-work. In the third section, we present findings from these analyses that provide mostly convergent evidence to support the viability of our measures and the validity of the infer-ences that we draw from them, although we highlight some puzzling findings. We conclude with a discussion of the implications of this work for measurement at scale and for improving teaching in the Common Core era.
How Mathematics Teaching Influences Student Learning
There are few well-developed theories of how teaching influences student learning (Floden, 2001; Hiebert & Grouws, 2007). There are, however, patterns that emerge across empirical studies describing how different kinds of teaching support different kinds of student learning. We know the most about features of teaching that lead to improvement in skill efficiency—defined as the accurate, smooth, and rapid execution of procedures (Gagne, 1985; Hiebert & Grouws, 2007)—because the most readily avail-able student learning outcomes have been from state-stan-dardized tests that feature multiple-choice items at relatively low levels of complexity (Lane, 2003; Webb, 1999).
In the policy context created by the Common Core, how-ever, the field needs evidence regarding the features of teaching that influence students’ development of conceptual understanding, defined here as connections among mathe-matical facts, procedures, and ideas (Brownell, 1935; Hiebert & Carpenter, 1992; Hiebert & Grouws, 2007). The development of the Common Core was heavily influenced by the need to avoid “the mile-wide, inch-deep problem” (Schmidt, McKnight, & Raizen, 2002) by stressing the need for students to develop deeper conceptual understanding of fewer key ideas (CoreStandards.org). A call for deeper con-ceptual understanding demands a review of what is known
and not known regarding teaching practices that foster the development of students’ conceptual understanding.
In a review of studies that examined the relationship between teaching and student learning of concepts, Hiebert and Grouws (2007) identified explicit attention to concepts
(EAC) and students’ opportunity to struggle (SOS) as key teaching features that foster conceptual understanding (p. 383). EAC is defined as the public noting of connections among mathematical facts, procedures, and ideas (Hiebert & Grouws, 2007). This can be done through discussions about the mathe-matical meaning underlying procedures, by noting how differ-ent solution strategies are similar or differdiffer-ent, and by reminding students of the main point of the lesson and how that point fits into the bigger picture. SOS is defined as students’ expending effort to make sense of mathematics, to figure something out that is not immediately apparent; it connotes solving problems that are within reach and wrestling with key mathematical ideas that are comprehensible yet not well formed (Hiebert & Grouws, 2007).
Although other features (e.g., use of concrete materials, asking higher-order questions) were sometimes associated with conceptual understanding, they were “too specific and too closely tied to particular classroom conditions to sup-port claims that they apply across classrooms” (Hiebert & Grouws, 2007, p. 391). EAC and SOS, on the other hand, were observed to operate effectively across a range of con-texts and teaching systems. EAC, in particular, was found to be quite robust as it appeared across a variety of studies that used different research designs, that were situated in different approaches to teaching (e.g., teacher versus stu-dent centered), and that varied in terms of how concepts were developed (e.g., through discourse versus through specially designed materials).
ment of students in active struggle with core mathematics concepts and procedures was identified as shared by all high-achieving countries (Hiebert & Stigler, 2004).
A Focus on Interaction and Grain Size
Our theoretical framework starts with these two con-structs but takes them a step further by examining their inter-action. Past measures of classroom teaching have typically concentrated on isolated features (e.g., process-product mea-sures, such as wait time) or have relied on very broad labels of teaching approaches (e.g., reform vs. conventional instruction) that, although comprising a multitude of inter-acting features, do not specify or measure those interactions. Our examination of the interaction of EAC and SOS takes an approach that is different from either of these. It is anchored in our belief that specific instructional features achieve their impact through interaction with one another rather than independently and/or additively (Hiebert & Grouws, 2007).
In selecting EAC and SOS, we also strove to adopt fea-tures that exist at a medium grain size (suggesting that they may be the most noticeable/observable among a constella-tion of smaller features that typically interact and travel together). The Teaching for Robust Understanding (TRU) Math framework represents a similar effort to identify fea-tures of effective teaching that operate at a medium grain size (Schoenfeld, Floden, & Algebra Teaching Study and Mathematics Assessment Project, 2014). In this scheme, five dimensions of effective mathematics teaching are identified: (a) the mathematics; (b) cognitive demand; (c) access to mathematical content; (d) agency, authority, and identity; and (e) uses of assessment. Schoenfeld and col-leagues (2014) claim that at this level of analytic grain size, “the five dimensions, broadly construed, encompass the essentials of productive mathematics classrooms” (p. 3). EAC and SOS are most strongly aligned to the first two dimensions, although issues of agency, authority, and iden-tity are implicated in some of our measures as well. Additionally, TRU Math focuses on “minimally overlap-ping dimensions of mathematics classroom activity” (p. 2; italics added); our framework, on the other hand, empha-sizes the interaction among features.
Placing EAC and SOS in interaction with one another, we argue, offers a way to deepen—and challenge—conven-tional ways of measuring instruction in mathematics educa-tion research. Studies typically conflate either high or low levels of EAC and SOS. For example, under the label of “reform instruction,” researchers often blur a variety of fea-tures, such as students’ grappling with challenging problems (high SOS) and attention to conceptual understanding (high EAC), the assumption being that they co-occur (at either high or low levels) and, together, lead to effects on student
learning. Similarly, under the label of “direct instruction,” researchers often fuse students practicing what they already know (low SOS) with instruction that is devoid of mathe-matical concepts or ideas (low EAC).1
Instead of avoiding the potential for interaction between high and low levels of EAC and SOS, we feature interac-tions as a key part of our theoretical framework. Doing so enables us to test for the existence of the “off diagonals” (e.g., high EAC/low SOS) and yields testable hypotheses that demonstrate the consequences of interactions among them for student learning.
Building an Initial Instantiation of the Theoretical Framework
Our first step toward understanding the influence of EAC and SOS on student learning is to explore how their interac-tion produces different profiles of teaching. As shown in Figure 1, a simple 2 × 2 matrix of high and low levels of SOS and EAC produces four quadrants.
Quadrants 1 and 4 describe typically drawn profiles of reform versus traditional teaching. In the first quadrant (high SOS and high EAC), students are provided with open-ended tasks for which there is not a predictable, well-rehearsed approach or pathway to solve the task. Students have to exert considerable cognitive effort as they invent and test different strategies for solving the task. Student work on the task pro-vides the primary fodder for class discussions, and attention is also paid to connecting student work with important math-ematical concepts and ideas.
The fourth quadrant represents instruction in which there is both low tolerance for student struggle (low SOS) and lim-ited attention to concepts (low EAC). This often occurs as worksheet-driven instruction in which the teacher demon-strates the procedure he or she wants students to use and then students do a set of similar problems using that same proce-dure with no reference to why the proceproce-dure works or when
Explicit
Attention to Concepts
High Low
High
Quadrant 1 High EAC High SOS
Quadrant 2 High EAC Low SOS
Low
Quadrant 3 Low EAC High SOS
Quadrant 4 Low EAC Low SOS
FIGURE 1. 2 × 2 matrix displaying our profiles of teaching
Stein et al.
it is appropriate to use it. This profile of teaching accounts for the majority of instruction in the United States (Schmidt et al., 2002) and is often referred to as “traditional” or “direct” instruction.2
Quadrants 2 and 3 invite us to break away from the conventional labels associated with reform and traditional instruction. Quadrant 3 (high SOS and low EAC) does not align with any espoused view of teaching and learning, but it does describe a profile of teaching that can materialize when teachers unsuccessfully enact Quadrant 1 teaching (Stein, Grover, & Henningsen, 1996).3 When students are provided with open-ended problems for which they do not have the prior knowledge or a strategy for solving, they can struggle but not in productive ways. Without teacher scaffolding of students’ thinking toward the important mathematical ideas embedded in the task, students do not engage with mathematical concepts.
Quadrant 2 teaching involves EAC (high EAC), but unlike Quadrant 1 instruction, it provides less opportunity for sus-tained student struggle (low SOS). Although we suspect that teaching in this quadrant can take a variety of forms, it often involves teacher demonstration of a general procedure for solving a problem with time taken to explain concepts as they relate to procedures and to encourage and entertain student questions. Multiple representations are enlisted to explain concepts along with drawing connections between those rep-resentations and the procedure that is being taught. This kind of instruction can be viewed as high on EAC but as curtailing student struggle by suggesting a pathway that students follow to a solution (rather than having them invent their own approaches). That does not mean, however, that students can mindlessly follow the pathway, but rather, they have to think about what they are doing and why.
There are other ways in which student struggle could be constrained in a high-EAC Quadrant 2 profile of teaching. To our knowledge, however, the mathematics education lit-erature does not contain many other examples of high-EAC/ low-SOS instruction. In the learning sciences, however, there is a long history of research on the relationship between procedural and conceptual learning (e.g., Rittle-Johnson, Siegler, & Alibali, 2001), and design-based studies have begun to explore when and how structure can be introduced to mitigate or build on student struggle (see, for example, Schwartz & Bransford, 1998). Hiebert and Grouws (2007) refer to the possibility of conceptual lessons that contain no elongated episodes of struggle but do contain more bounded forms of struggle (e.g., smaller explorations of targeted con-cepts embedded in more highly structured lessons).
In summary, recent descriptions of teaching and learning have tended to classify instruction into one of two systems: reform or traditional teaching. Although representing an advance in some ways,4 these labels have also proven to be problematic, mostly because they “group together features of instruction in ill-defined ways and connote different kinds
of teaching to different people” (Hiebert & Grouws, 2007, p. 380). Moreover, the labels have become flashpoints in the “math wars,” a series of unproductive back-and-forths between reformers and mathematicians that have polarized the field (Munter, Stein, & Smith, 2015; Schoenfeld, 2004).
Here, we purposefully move beyond these labels using a theoretical framework to guide testable claims and begin to acquire evidence for a validity argument. We believe that the theoretical framework helps advance our understanding in a number of ways. For example, although one is likely to see the same kinds of curricula and instructional tasks in Quadrant 1 (high-EAC/high-SOS) and Quadrant 3 (low-EAC/high-SOS) profiles, the separation of the two quad-rants makes clear the key contribution of EAC by illustrating the lack of it in Quadrant 3 teaching. The distinction between Quadrant 1 and Quadrant 2 (high-EAC/low-SOS) teaching opens the door for exploring the role that SOS plays in both teaching and student learning. In research guided by our theoretical framework—as reported herein—we demon-strate how we are able to describe concrete differences in teaching between the quadrants (when we use our theoretical framework to identify teachers into quadrants using patterns of responses to survey data) and test whether there are asso-ciated differences in student learning.
Building a Validity Argument
Along with our partners in the Tennessee Department of Education, our ultimate goal is instructional improvement at scale. This led us to the use of surveys as a vehicle for mea-suring mathematics teaching practice across the state. Our validty question thus becomes, What kind of inferences can we make about teaching based on survey items aimed at measuring two key features of instruction?
Historically, a common approach that has been used to demonstrate construct validity of survey responses is to tri-angulate them with other criterion measures collected via different methods (e.g., McDonald, 2008). Indeed, research-ers in education have primarily used criterion measures to demonstrate how surveys can provide valid inferences about a teacher’s mathematics instruction and, therefore, be of use at scale (e.g., Mayer, 1999). For example, Stecher et al. (2006) made a validity argument by comparing vignette-based items to other (criterion) measures of mathematics teaching practice. Similarly, Mayer (1999), using more tra-ditional items organized around latent constructs consistent with the National Council of Teachers of Mathematics (1991) standards, made arguments for the validity of infer-ences that could be made about teaching from his results.
theoretical framework. In so doing, we are testing whether teachers’ responses to survey items and their resulting classification into quadrants are observable in practice and whether they correlate with other measures in ways that are expected.
Current investigations of validity typically involve the collection of a wide range of evidence that provides a scien-tific basis for a specific score interpretation (American Educational Research Association, American Psychological Association, & National Council on Measurement in Education, 2014; Kane, 2006). Most measures (typically assessments but here teaching practice) are designed to serve specific purposes, and each purpose involves an interpreta-tion of scores that should be subjected to a validity investiga-tion. In our case, we view our theoretical framework as a useful heuristic for generating claims and undergoing hypothesis testing of those claims in order to acquire evi-dence for a validity argument. Our primary purpose in devel-oping survey measures aligned to our theoretical framework was to test whether such measures capture meaningful dif-ferences in teaching practice and, therefore, can be expected to be useful for large-scale research studies.
Most current work on validty is based on Kane’s (1992) argument-based approach. Following this method, we have elucidated the assumptions that undergird the claims.5 As we frame our validity argument, we explicitly state claims regarding the meaning of our survey-based quadrant place-ments, then test these claims using empirical evidence. Specifically, our claims—and subsequent inferences for empirical testing—are the following:
1. Amid calls for teaching practices that will foster higher levels of students’ conceptual understanding, teachers have responded in different ways, resulting in teaching practices similar to profiles defined by our theoretical framework. Thus, self-reported teach-ing practices on the survey should reflect a tendency for teaching within one of the four quadrants.6 2. When teachers respond in patterned ways to surveys,
suggesting a teaching tendency aligned with a given quadrant, their quadrant placement ought to reveal instructional practices that are theoretically consis-tent with the core features of mathematics teaching (EAC and SOS) illustrated by our 2 × 2 matrix (see Figure 1). Specifically, whereas Quadrant 1 and Quadrant 4 teaching will be characterized by instruc-tional practices aligned with high and low EAC and SOS, respectively, we expect that teachers whose patterns of survey responses place their tendencies in Quadrant 2 would have practices aligned with high EAC and low SOS and Quadrant 3 teachers to have practices aligned with the opposite.
3. A teacher’s self-identification of his or her tendency for teaching within a particular quadrant ought to be
related to more objective, independent measures developed from video observations and teacher-pro-vided assignments with accompanying student work artifacts. For example, a tendency for Quadrant 1 teaching should be characterized by high-conceptual and high-struggle video scores, a higher percentage of assignments asking for extended writing, a higher percentage of high-cognitive-demand tasks, fewer problems per task, and problems requiring students to generate an additional representation or solution path. Similar hypotheses hold for teaching tenden-cies within the remaining quadrants.
4. Differences in teaching tendencies within the quad-rants ought to be related to student learning in theo-retically coherent ways. Specifically, a tendency for teaching within the quadrants should be meaning-fully related to student performance on assessments of students’ skills efficiency and conceptual under-standing. For example, students who experience Quadrant 1 teaching should outperform students from other quadrants on nonroutine, open-ended assessments as well as on assessments of skills and procedural fluency. These students should outper-form students from Quadrants 3 (low-EAC/high-SOS) and 4 (low-EAC/low-(low-EAC/high-SOS) classrooms because of the lack of EAC in those quadrants. Students from Quadrant 1 classrooms are also predicted to outper-form students who have primarily experienced Quadrant 2 (high-EAC/low-SOS) teaching because in addition to being exposed to high levels of EAC and SOS, they have had repeated opportunity to work on unstructured, open-ended tasks similar to those found on the constructed response assessment (CRA) throughout the year. Students who experience Quadrant 2 teaching should outperform students from Quadrants 3 and 4 classrooms on assessments that measure higher-level concepts because Quad-rant 2 teaching prepares students for salient aspects of CRA items (e.g., multistep problems, mathemati-cal reasoning). Although Quadrant 3 teachers pro-vide ample opportunities for students to engage with nonroutine tasks, the lack of EAC may limit the extent to which students can earn points on a rubric when they are asked for mathematical reasoning.
Methodology
Sample
“survey-only” sample or a more intensive sample including additional forms of data collection. At Time 1 and Time 2, 256 teachers took the survey and have complete data. These teachers form our primary analytic sample.
A subset of these teachers have video- (n = 27) and artifact-based (n = 54) data about their teaching practice. This sample is largely representative of fourth- through eighth-grade Tennessee mathematics teachers. As shown in Table 1, teach-ers are slightly more likely to have taught in fourth or fifth grade, but each grade level is well represented. Although most teachers in our sample are female (90%) and White (90%), these proportions are not unusual considering the population of teachers across the state. The teachers reported a wide range of teaching experience, and on average, they taught about 300 minutes a week of mathematics instruction. Teachers in the sample are also geographically diverse, com-ing from all regions of the state. On average we have almost as many schools represented as we have teachers in our study. The 27 teachers for whom we have video data are also scat-tered, representing 24 different schools in 13 different dis-tricts. These teachers are more likely to teach in the elementary (67%) versus middle school (33%) grades and have an 18-year range of teaching experience (M = 11.56, SD = 6.31). Finally, we have achievement data for all students for 193 of our 256 teachers on two achievement measures (described later) given statewide in the year prior to our survey administration.
Data and Measures
We begin with a description of the survey, including how our design process helps to mitigate common problems
associated with survey-based research. We then proceed to describe two additional measures (assignments and student work and videos of classroom lessons) and the measures of student performance that we used.
Survey. The survey consisted of a variety of item types. In addition to general questions (years teaching, number of math classes taught per week), there were vignettes, items about teachers’ beliefs and practices, and items assessing teachers’ mathematics knowledge for teaching (Hill, Ball, & Schilling, 2008). The vignettes were short descriptions of a mathematics lesson; they were designed to vary according to theoretically based profiles of teaching in each quadrant. After reading the vignette, teachers were asked to answer a bank of questions about it and to use a slider bar to estimate the amount of time their lessons resembled the vignette (0% to 100%).
A host of problems have been documented with regard to self-report research, including surveys (e.g., Stone, Bachrach, Jobe, Kurtzman, & Cain, 1999). Difficulty with memory retrieval for frequency counts (e.g., Menon & Yorkston, 2000; Schwarz & Sudman, 2002) and social desir-ability (e.g., Paulhus & Vazire, 2007) are commonly known problems in social-behavioral surveys. These are among the reasons that Camburn, Han, and Sebastian (2015; through a comparison of self-reports of frequency counts on an annual survey to self-reports of daily log data on comparable items) found that 75% of teachers overreported on the annual sur-vey. However, we agree with researchers who suggest the answer is not to throw the baby out with the bathwater (Donaldson & Grant-Vallone, 2002; Paulhus & Vazire, 2007). Instead, we have attended to these known problems in both our survey design and analyses.
First, one way in which scholars seek to enhance the accuracy of self-reports in medical or social science sur-veys is to find better ways of asking questions of respon-dents. For example, asking neutral questions can reduce social desirability (Paulhus & Vazire, 2007), contextualiz-ing items can aid memory recall (Tourangeau, 1999) and improve the accuracy of self-reports (Paulhus & Vazire, 2007), and asking indirect as well as direct questions can provide more “honest” appraisals of sensitive topics (Dalal, 2012). We adhered to these principles in designing multiple items across different item formats, all anchored to our theoretical framework.
The design of our questions also benefited from cognitive interviews conducted before our first administration of the survey. Teachers were asked to complete the survey and, at predetermined intervals, to talk about how they were inter-preting items. We were particularly interested in their response to the vignette-based items (see online Appendix A). We found that different individuals found different vignettes to be socially desirable; specifically, they found most desirable those that they thought best described their
TABLE 1
Demographic Characteristics of Teachers (n=256)
Variable n or M (SD) Percentage of sample
Grade level
4 55 21.5
5 65 25.4
6 49 19.1
7 40 15.6
8 42 16.4
Missing 5 2.0
Race
White 231 90.2
Black 20 7.8
Asian 2 .8
Native American 1 .4
Hawaiian/Pacific Islander 1 .4
Female 229 89.5
Self-contained classroom 31 12.2
Years experience 11.5 (6.0)
teaching. Thus, our contextualization of quadrant teaching through the vignettes may be considered an instantiation of neutral items, reducing concerns about social desirability.7
Another contextualization strategy that we employed involved creating an item about perceived constraints in teachers’ schools/districts that prevented them from teaching in the way they would like to. This item was inserted right before a set of items about the frequency they employ par-ticular teaching practices. By providing them with the opportunity to acknowledge that their teaching is shaped by external factors, our intention was to put teachers in a mind-set to reliably report their practices. All of these design con-siderations, combined with the low-stakes nature of our survey, we think mitigates any serious concerns about social desirability (Chan, 2009).
Survey items for analyzing patterns of self-report aligned with our theoretical framework. Our work began with the development of survey items, utilizing different item formats and response scales, aligned with our theoretical framework. To understand and test our first claim, we used several measures across the survey and analyzed patterns of responses using a latent profile analysis (LPA; described below). First, using the same mathematics topic, we created one vignette per quadrant but varied the tasks and teaching approaches for implementing the tasks to align with our the-ory of instruction in each quadrant. Following each vignette, we asked teachers the proportion of time they spent teaching like the vignette, and we asked teachers to agree or disagree with after-vignette items providing rationale for why cer-tain teaching decisions were made (see online Figures A1a through A4c in Appendix A for the four vignettes and items). A fifth vignette was created to gauge teachers’ tendencies to continue to facilitate students’ struggle with the mathemat-ics in the task or to limit the struggle within the context of a specific teaching event (see online Figures A5a and A5b in Appendix A). The proportion of time they self-report per-sisting in maintaining high struggle (Mr. Clayton) was a fifth item for subsequent use in an LPA.
In addition, we generated an additional four quadrant scale scores based on our theoretical framework. For each quadrant (e.g., Quadrant 3, exemplified by Ms. Jones’ vignette), we identified particular items throughout the sur-vey that a teacher with a high tendency for teaching like Ms. Jones would agree to.8 We then used a partial credit system for each item (e.g., strongly agree = 1, agree = 0.5; otherwise = 0) and totaled across these items providing sig-nal for a tendency toward Quadrant 3 teaching.9 Items con-tributing to each quadrant scale score (i.e., Quadrant 3 scale score in this case) were chosen theoretically and tended to be inclusive of several after-vignette and other Likert scale items (see online Tables A1 through A4 in Appendix A for the full set of items for each scale for each quadrant). The four quadrant scale scores (i.e., Quadrant 1
scale score, Quadrant 2 scale score, etc.) were constructed to be used in the subsequent LPA.
Finally, we administered the proportional reasoning items from the Mathematics Knowledge for Teaching (MKT) mid-dle-grades assessment (see, e.g., Hill et al., 2008). We used this as a proxy for teachers’ pedagogical content knowledge. We assumed that including a proxy for teachers’ knowledge might help generate profiles of teaching at the intersection of knowledge and teachers’ decision making about practice— such that our profiles might be indicative of “usable knowl-edge” (Kersting et al., 2015). This variable was a summed score of each teacher’s correct items out of the 30 on this scale of the MKT. This item was our 10th, and final, variable included in our LPA.
Survey items for confirmatory factor analysis (CFA) for EAC and SOS. More generally, the survey consisted of instructional Likert scale items contributing to measurement of our two main constructs (EAC and SOS). Indirect items were designed to elicit teachers’ reasoning about teaching decisions and how this influences students’ learning about mathematics (e.g., “More important than extended math discussions, students need a lot of practice with math prob-lems”). Practice items were more traditional and direct. Here, we asked teachers to report the frequency with which they engaged in specific instructional activities associated with EAC and SOS (e.g., “Students listen to and critique others’ reasoning and solution strategies”). All of these items appear in online Table A5 in Appendix A organized around theoretical subconstructs within EAC and SOS.
Video-Based Instructional Measures. The subset of 27 teachers on whom we have video data was similar to our overall sample except it included a greater proportion of elementary teachers. Teachers were videotaped in the spring of 2014 for at least 120 minutes of instruction, typically spread over two consecutive lessons. Teachers were told to do “what they normally do,” and videographers were trained to capture both whole-class and small-group interactions. Specifically, they were trained to follow the teacher as he or she moved from group to group and to record (as much as possible) of the conversation and student work.
Lessons were first divided into tasks based on the arti-facts used to conduct the lesson, a process that was done by two independent coders with 91% agreement.10 Segmenting the lesson into identifiable tasks served to assure that coders were using the exact same portion of the lesson when ascribing codes.
Stein et al.
with an expert coder before beginning coding assign-ments.11 Twenty percent of the videos were double coded with an interreliability of 65% exact agreement across all codes and 82% agreement on scoring items as “high” or “low” across each code.12
Selected scores from the dimensions described on the coding protocol were used to create two composite scores: EAC and SOS. Specifically, the EAC score was a combina-tion of the EAC code along with the degree of consolida-tion and tie to canonical representaconsolida-tions codes. The SOS score was a combination of the opportunities for student struggle code with codes for the type of discourse present in the classroom and the cognitive demand of the task as it was enacted. Finally, because of variability in the number and length of tasks, as well as differences in amount of time for the math lesson among teachers, codes for each dimension for each task were weighted by the proportion of time that respective task lasted relative to the amount of time devoted to the lesson.
Artifact-Based Instructional Measures. Teachers were asked to submit their assignments and samples of student work for 5 days that overlapped with the classroom videotaping. Teachers were asked to submit every assignment and instruc-tional task used in their class along with two samples of high-quality and two samples of medium-high-quality student work. Each assignment had an accompanying cover sheet on which the teacher described the nature of the assignment/task and how he or she would judge student performance on that assignment. All three of these items (cover sheet, assignment, and student work) were coded by three individuals using a protocol (see online Appendix C). The participating teachers were randomly assigned to one of three coders that scored all their submitted packets (including cover sheets, assignments, and student work). Coders were trained to a criterion of 80% agreement with an expert coder before beginning their cod-ing assignments.13 All packets for 20% of the teachers were double coded with an exact agreement of 86%.14
Student Learning Measures. We employ two available mea-sures of student learning. Although acknowledging that the boundaries between items measuring procedures and con-cepts are not always clear-cut, we make the case below that one assessment was primarily a skills-based measure and one was more conceptually based. The Tennessee Comprehensive Assessment Program (TCAP) was administered to all stu-dents in Grades 4 through 8 in Tennessee in 2012–2013. Items on the TCAP were multiple choice, covering the following range of topics: mathematical processes, numbers and opera-tions, algebra, geometry and measurement, and data analysis, statistics, and probability. The distribution of topics varied by grade level. For example, number and operations items repre-sented 50% of the fourth-grade TCAP but only 24% of the eighth-grade TCAP. Most important for our analytic purposes,
the vast majority of TCAP items require a single correct answer, and students receive credit based only on whether or not they have achieved that answer. We infer that most TCAP items are skills and/or procedures based on (a) a review of their released items (see examples in online Appendix D), (b) the fact that TCAP was operational during the No Child Left Behind era in which questions about the cognitive complexity of state tests were being raised (Lane, 2003), and (c) Tennes-see’s standards for proficiency were found to be far below those of the National Assessment of Educational Practice, which has a reputation as including multiple-choice items that are more conceptual in nature (Resnick, Stein, & Coon, 2008).
Our second learning measure is from a CRA adminis-tered in 2012–2013. Students at each grade level were pro-vided four different tasks (an example item from Grade 7 and its associated scoring rubric is included in online Appendix D). The rubrics were designed to assess both mathematical content and mathematical practices consis-tent with the CCSS. These items are nonroutine problems, most of which require novel solution strategies. Many can be solved in more than one way; students’ achieve “credit” for being correct and for demonstrating conceptual under-standing through appropriate representations or explana-tions, not only for getting the correct answer. The CRAs were scored by Measurement Incorporated under contract with the state of Tennessee. A technical report delivered to the state demonstrated adequate reliability characteristics for the CRA scoring (Measurement Incorporated, 2013).
We examined differences in student growth by teacher on these two different outcomes. We used statewide data for Grades 4 through 8 in the following manner: We standard-ized our outcome within grade so each student had a stan-dardized score relative to his or her same-grade peers; we combined students across grades so that we could utilize all of the classrooms in our sample. We then generated covari-ate-adjusted value-added scores for teachers using all fourth- through eighth-grade classrooms across the state on each of our two outcome measures (see online Appendix E for a write-up of the model).15 Although this is a simpler model than many value-added models in use today (see, e.g., limits of covariate-adjusted versus cross-classified models in Rowan, Correnti, & Miller, 2002; and for a description of different value-added approaches for the same outcome, see McCaffrey, Lockwood, Koretz, Louis, & Hamilton, 2004), we expect there is more to be gained from comparing and contrasting across our two outcomes. For example, Papay (2011) observed large variation in value-added scores by outcome, more variation than typically experienced by using different model specifications.
Analytic Methods
Consequently we organize discussion of analytic methods around these claims.
Confirmatory Factory Analysis (Claim 1). In order to evalu-ate our first claim (that teaching practices reflect a tendency for teaching in one of the four quadrants), the underlying structure of the survey-based Likert indirect and direct “practice” items was theorized to measure two distinct con-structs, namely, EAC and SOS. Additionally, several sub-constructs were hypothesized to be present in the survey (see Table A5; e.g., the subconstruct of making connections among solution strategies or mathematical ideas was hypoth-esized to be highly related to EAC). We used MPlus Version 3.01 (Muthen & Muthen, 2010) to conduct a CFA.
We assessed the adequacy of our measures vis-à-vis our theoretical framework in two different ways. First, we exam-ined the fit of our data to our hypothesized higher-order structure. More specifically, we sought evidence for confir-mation of the presence of the overarching EAC and SOS factors as well as the subconstructs within them.16 This hypothesized structure dovetails with the typical second-order factor structure in which the lower-level subfactors are substantially correlated and the presence of the higher-order factor explains the relationship between those subfactors (Chen, West, & Sousa, 2006). In other words, the subcon-structs are correlated because they share a common source, namely, the second-order factor of EAC or SOS (Reise, Moore, & Haviland, 2010). Examination of absolute and comparative fit indexes provides evidence for how well the data fit the proposed model.
Second, we also conducted a model comparison to under-stand whether our hypothesized second-order two-factor model fit the data better than a second-order one-factor model (Hoyle, 2000). Such a model comparison provides evidence about the dimensionality of the measured construct(s), EAC and SOS. If, for example, reform versus traditional instruction were the dominant explanation, then the one-factor model would demonstrate a better fit to the data and would be preferred for its model parsimony. Because the one-factor model is fully nested in the two-fac-tor model, a comparison of χ2 statistics, adjusting for differ-ences in degrees of freedom, provides a statistical test for model fit to the data (Hoyle, 2000).
LPA (Claim 2). To understand the extent to which teach-ers had a tendency for teaching practices consistent with our theoretical framework, we examined patterns of item responses utilizing an LPA. LPA was chosen for this pur-pose as it is helpful in illuminating the relationship of a single categorical latent variable (teaching quadrant) with a set of continuous indicators (survey responses) (Vermunt & Magidson, 2002). We then interpreted the resultant pro-files to be indicative of a tendency for teaching within one particular quadrant.
Ten variables were used to estimate the LPA model. Five of these variables were the percentage of time (0%–100%) teachers reported their instruction resembled the practices portrayed in each of five instructional vignettes previously described. The next four variables were the quadrant scale scores generated from theoretical notions of the pattern of responses teachers would record for particular items if they had a tendency toward one quadrant profile. The final vari-able was scores on the MKT.
MPlus Version 3.01 (Muthen & Muthen, 2010) was used to conduct our LPAs. Evaluation of the output from extract-ing four, five, six, seven, and eight classes resulted in the selection of a six-class solution. Indicating a classification utility similar to prior research (Pastor, Barron, Miller, & Davis, 2007), the entropy values for this model were .86. We used the output from this model to decide which of the four quadrants each of the six latent classes belonged in.
To uncover whether teaching tendencies carried mean-ing related to our theoretical framework, we explored pat-terns of responses on our subconstructs. We took the factor scores generated on our subconstructs from the CFA in order to understand differences in group means based on quadrant placements from the LPA. The sufficiency of our quadrant placements was determined by examining the means for factors and subfactor scores associated with EAC and SOS and the consistency of the response patterns on those factors and subfactors with the expected responses based on the operational definitions of the quadrants in our theoretical framework (i.e., Quadrant 2 teaching is defined by high levels of EAC and low levels of SOS, whereas Quadrant 3 teaching is the opposite).
Descriptive Analyses of Between-Group Differences (Claim 3). In order to evaluate our third claim (a teacher’s ten-dency for teaching within a particular quadrant ought to be related to more objective measures developed from video- and artifact-based measures of teaching), we checked for convergence between our quadrant placements and our other objective measures of teaching: video-based scores of teaching on concepts and struggle (n = 27 teachers) and a subset of features of assignment-based scores (n = 54 teach-ers). Given the small number of teachers overall, and in par-ticular the fact that only two Quadrant 2 (high-EAC/ low-SOS) and three Quadrant 4 (low-EAC/low-SOS) teach-ers were included in the video sample, we limit our analysis to a description of group means.
captured teachers’ valued-added scores for the TCAP, a pre-dominately skills-based assessment, and the CRAs, an assessment with considerably more attention to students’ conceptual understanding.
Results
Claim 1: Teaching Practices Reflect a Tendency for Teaching in One of the Four Quadrants
Confirmatory factor analyses were used to investigate the factor structure of eight hypothesized subconstructs. Three models were used for comparative purposes. Model 1 tested a single general factor using all 38 items (i.e., items nested in one “reform” factor). Model 2 tested whether a second-order single-factor model was a better fit to the data (i.e., all eight subconstructs were nested in one “reform” factor). Finally, Model 3 tested whether the hypothesized second-order two-factor model (i.e., three subconstructs in EAC and five subconstructs in SOS) was a significant improvement beyond the second-order single-factor model. Of primary interest was the comparison between Model 2 and Model 3 because it tests whether par-ticipants responded differently to items thought to be theo-retically contributing to EAC and SOS. The fit indexes for the three models shown in Table 2 confirm that Model 3 is the best fit to the data, suggesting EAC and SOS were dis-tinct constructs captured through our survey.
Model 3 in Table 1 has the best demonstrated fit to our data. This is true in terms of absolute and comparative fit, where Model 3 (root mean square error of approximation [RMSEA] = .06, comparative fit index [CFI] = .794, Tucker-Lewis index [TLI] = .779) is better than Model 1 (RMSEA = .09, CFI = .524, TLI = .497) or Model 2 (RMSEA = .07, CFI = .718, TLI = .698).17 Additionally, the χ2 difference tests reveal similar improvement in model fit from Model 1 to Model 2, ∆χ2(∆df = 8, N = 256) = 571.95, p < .001, and from Model 2 to Model 3, ∆χ2(∆df = 1, N = 256) = 220.74,
p < .001. The fact that the two-factor model is a better fit suggests that our survey captured data from teachers about their practice where our hypothetical constructs EAC and SOS are correlated (r = .40), but they also remain distinct (i.e., respondents were sometimes high on one construct but low on the other and vice versa).18
Claim 2: Teachers Had a Tendency to Endorse Teaching Practices Consistent With the Theoretical Framework LPA Findings With Respect to Latent Profile Covariates. In order to separate teachers according to their tendencies for teaching within a given quadrant, we examined patterns of their responses across 10 variables, five of which allowed them to indicate their preference for one type of teaching versus another (i.e., percentage of their time teaching in a manner similar to the teacher featured in each vignette). Our LPA identified six distinct groupings of teacher responses.19 We placed each of the six empirically identi-fied latent classes into our theoretical framework (i.e., the four quadrants) based on the group means reported in the output for each latent cluster. Certain latent clusters had very distinct profiles. For example, Quadrant 4 teachers (see Figure 2, purple line; n = 42 teachers) formed a distinct group because their observed means demonstrated a stark contrast from the other groups in terms of strong tendencies to report teaching similar to the Ms. Smith vignette and strong tendencies to reject teaching like the other vignettes. Quadrant 1 teachers (see Figure 2, blue line; n = 77 teach-ers) separated into two different latent classes with reported tendencies for (a) not teaching like Ms. Smith and (b) teach-ing in ways similar to all other quadrants, especially Quad-rant 1. When combined, QuadQuad-rant 1 teachers had observed means that were distinct from Quadrant 4 teachers because their tendencies were highest for Quadrant 1 and lowest for Quadrant 4, essentially mirroring the purple line.
These two diametrically opposed profiles represent just about half of all teachers surveyed. Thus, using patterns of responses to survey items, we identified many teachers whose tendencies in their mathematics teaching do not neatly fall into reform or traditional teaching designations. For example, Quadrant 3 (low-EAC/high-SOS) teachers (see Figure 2, green line; n = 90 teachers) are most distinct in that they reject Quadrant 4 teaching (low EAC/low SOS), but they fail to self-report a strong tendency for teaching like teachers in any of the other vignettes. Finally, Quadrant 2 (high-EAC/low-SOS) teachers (see Figure 2, red line; n = 47 teachers) also separated into two different latent classes that embraced elements of low-struggle teaching like instruc-tional practices in Quadrant 4 (i.e., Ms. Smith) but differed from Quadrant 4 teachers on their average response to the
TABLE 2
Fit Indexes for Competing Models of the Structure of Mathematics Teaching Practice From Survey Responses
Model df RMSEA CFI TLI SRMR AIC χ2 ∆χ2 from previous
First-order single factor 665 .090 .524 .497 .113 23,846 2,046.79 —
Second-order single factor 657 .070 .718 .698 .112 23,290 1,474.84 571.95
Second-order two factor (correlated) 656 .060 .794 .779 .086 23,072 1254.10 220.74
fencing task vignette about allowing students to struggle in context (Mr. Clayton). Furthermore, they also express the highest tendency for Quadrant 2 (i.e., Ms. Evans) and the second-highest for Quadrant 1 (Ms. Park). What is distinct about Quadrant 2 and Quadrant 3 teachers would be lost if we tried to measure reform teaching along just a single dimension, as teachers in both quadrants would likely be lumped in the same group together somewhere between the blue and purple lines.
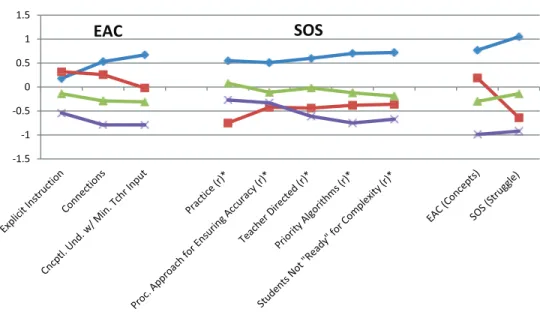
LPA findings with respect to EAC and SOS factor scores from the CFA. Corresponding to our second claim, as an empirical test of whether our interpretation of group means within our latent classes identified in the LPA resulted in theoretically meaningful quadrant designations, we exam-ined the scores of teachers within each quadrant on the subconstructs identified in the CFA. We think of this empirical test as one of cross-validation within the survey itself, while also testing whether teachers have responses to survey items fitting our theoretically defined quadrants (i.e., are there high-EAC teachers who also provide lim-ited SOS?). Our theory suggests Quadrant 1 teachers (see Figure 3, blue line) ought to be high on both EAC and SOS, and vice versa for Quadrant 4 teachers (purple line). Our theory further suggests that there would be teachers with differential scores on EAC and SOS; specifically, Quadrant 2 teachers ought to be high on EAC and low on SOS (and vice versa for Quadrant 3).
In general, these propositions hold (note the green and red lines crossing for EAC and SOS), helping to substanti-ate the existence of our theoretical profiles in actual
practice. Furthermore, we find Quadrant 2 (high-EAC/ low-SOS) teachers provided additional convergent evi-dence because of their pattern of responses on the subcon-structs. Take, for example, how the blue and red lines cross within EAC, which is theoretically consistent because Quadrant 2 teachers are likely to reject elements of stu-dents’ being asked to struggle on their own, connoted here by minimal teacher input. Likewise, the crossing of the red and purple lines within SOS is seen as further conver-gent evidence because Quadrant 2 teachers seem to embrace some elements of “productive struggle” (i.e., because they believe in providing meaning beyond proce-dures, we would expect they would score higher on the latter three subconstructs than on the previous two subcon-structs, which they do). Importantly, the pattern of find-ings represented in Figure 3 suggests that our quadrant placements correspond to the theory of teaching specified initially to which we anchored our measurement work.
Claim 3: There is Some General Correspondence Between Survey-Based Quadrant Placements and Other Measures
are simply too few teachers, and too few days of sampled instruction, to know if this constitutes divergent evidence.
We also examined mean differences for some of our assignment scores. Here, too, we find some differences con-sistent with our quadrant placements (see Figure 5). For example, Quadrant 4 (low-EAC/low-SOS) teachers pro-vided tasks with more problems (µ = 14.9). Combined with the finding that they provided high-cognitive-demand tasks only 4% of the time, this seems to suggest they provided students with more problems for repeated practice applying procedures. Conversely, Quadrant 1 (high-EAC/high-SOS) and Quadrant 2 (high-EAC/low-SOS) teachers tended to
provide fewer problems per task (µ = 8.2 and µ = 7.8, respec-tively), which is consistent with the finding that approxi-mately a quarter of their tasks were high cognitive demand (µ = 27% and µ = 22%, respectively). All in all, more objec-tive measures of teaching practice through both video- and artifact-based scoring suggest convergence with our survey-based quadrant placements. Moreover, the survey-survey-based quadrant placements are not related to extraneous covari-ates, such as grade level.20
Claim 4: Differences in Teaching Tendencies Aligned With the Quadrants Were Related to Student Learning in
Theoretically Meaningful Ways
Finally, one-way ANOVAs suggest no significant mean differences across quadrant designations when covariate-adjusted value-added scores from the TCAP were analyzed (F = 1.87, df = 189, p = .136). However, there were signifi-cant mean differences across quadrant designations when covariate-adjusted value-added scores from the CRA were analyzed (F = 4.80, df = 189, p = .003). Post hoc tests using Bonferroni adjustments revealed significant mean differ-ences between value-added estimates for students exposed to Quadrant 1 teaching relative to Quadrant 3 (effect size [ES] = .64, p = .004) and relative to Quadrant 4 teaching (ES = .68,
p = .022). Although the trend for value-added scores on the TCAP were in the same direction as the CRA (see Figure 6), only the more conceptual test was sensitive to instructional differences implied by our survey quadrant placements. This pattern of findings is consistent with prior studies showing
FIGURE 3. Between-quadrant differences in group means for subconstruct and construct scores generated from the confirmatory
factor analysis (Claim 2).
Note. These scales have been reverse scored to indicate high opportunities for productive struggle because each subconstruct indicates high proclivity for low struggle.
FIGURE 4. Between-quadrant group means for scores from
greater instructional sensitivity for assessments with greater attention to students’ conceptual understanding.
Discussion
This work is being undertaken as a first step toward the building of a larger body of validity evidence that supports the development of self-report research measures aligned with our theory of teaching and learning. We examined whether teachers’ instructional tendencies matched our quadrant theory, whether teachers’ self-reports of their teaching practices aligned with the level of EAC and SOS theorized to represent the quadrant in which they were placed, and whether there was alignment between teaching
tendencies within the quadrants and video- and artifact-based measures and patterns of student learning as described by the theoretical framework that the measures were designed to operationalize.
Our findings are encouraging along a number of fronts. The results of the LPA give credence to our claim that teachers are responding in a variety of ways to the demands placed upon them by higher state standards and accompa-nying examinations. The strength with which the LPA cap-tured reform (Quadrant 1) and traditional (Quadrant 4) teaching was not unexpected. The fact that only half of the teachers were “covered” by those two profiles, however, provides us with impetus to continue to build and refine our multifaceted profile theory.
FIGURE 6. Between-quadrant differences in group means for covariate-adjusted value-added scores on two different assessments, the
Stein et al.
Although not included as part of the claims and evidence reported here, our video-based scoring of classroom lessons has unveiled a variety of lesson formats that appear to fit Quadrant 2 teaching (high EAC/low SOS) that do not con-form to the quintessential version of Quadrant 2 instruction (tightly structured, conceptually based instruction with min-imal tolerance for student struggle). For example, a lesson might incorporate bounded moments of student struggle into a larger, teacher-controlled classroom discussion about deriving a procedure. Understanding the different varieties of teaching within our larger quadrants is important not only from a measurement perspective but, even more important, from a development perspective (more on this below). As we continue this work, we will seek to better understand, and perhaps label, these different patterns of teaching, even within the four quadrants espoused here.
It is one thing to have LPA create four groups of teachers with teaching tendencies that appear fairly well aligned with our four quadrants. It is another thing to demonstrate that teachers who “fall into” a particular quadrant also report engaging in instructional practices consistent with the 2 × 2 matrix in Figure 1. With the evidence we have presented for Claim 2, we were able to show the expected finding that Quadrant 1 and Quadrant 4 teachers were universally high and low, respectively, on EAC and SOS. However, we also showed that Quadrant 2 (high-EAC/low-SOS) and Quadrant 3 (low-EAC/high-SOS) teachers were alternately high on one dimension but low on the other. We think this is impor-tant variation to attend to not only for researchers but for mathematics educators.
Quadrant placements also aligned well with our expected patterns of student learning. That we found significant dif-ferences in value-added scores on the CRA that were consis-tent with our theoretical predictions is a particularly important signal that we are on the right track in our mea-surement and analytic endeavors. One aspect that our theo-retical framework has not yet tackled is the identification of specific factors that may be associated with teachers’ ten-dencies to teach in a particular quadrant. We have used a measure of teachers’ mathematical knowledge as one factor that could potentially contribute to the placement of teachers into teaching profiles. Going forward, we think it will be important to investigate whether and how knowledge pre-dicts teaching practices and also how teaching practices interact with knowledge to produce student learning.
We assume these associations are complex and deserve careful consideration beyond the scope of analyses pre-sented here. However, an important distinction to keep in mind between knowledge and the self-reported teaching practices is proximity to student learning opportunities. Whereas knowledge is a distal factor with potential to influ-ence and/or amplify teaching practice, self-reported teach-ing practices allow for inferences about the direct influence of teaching for generating students’ learning opportunities.
Our preliminary analyses suggest that our quadrant place-ments (with or without teachers’ knowledge as part of the LPA) are a more powerful explanatory variable for student learning than knowledge by itself.
Limitations
The theoretical framework was useful for testing research-based claims, but it is not without limitations. First, the tech-niques employed in this manuscript relied on quadrant placements as a heuristic, which we have demonstrated to be useful as an initial instantiation of multidimensional mea-surement of mathematics teaching. We do not mean to pro-pose that quadrant placements are an end in themselves, as we ascribe to the view that measurement of teaching is our goal as opposed to the placement of teachers.21 Furthermore, the quadrants are reductionist by nature. On our surveys, we observed more than one latent class per quadrant, indicating more than four patterned responses on the surveys. When coding our videos, we have observed similar variations in teaching within quadrants. Thus, we think there are more “patterns of teaching” than quadrants. By examining mean differences, we gloss over some of this variability. We think this variability is worthy of further exploration and do not mean to imply that four quadrants are sufficient to describe mathematics teaching in all its complexity.
Second, we have acknowledged well-known problems relying on self-reported behavior on surveys and how we have tried to address these by examining patterns of survey responses to many items. After ascribing teachers to quad-rants using this method, we describe these quadrant profiles using factor scores from the same surveys. The factor scores and some of the items contributing to quadrant placements are not independent of one another.
We also think it is important to reflect on the replicabil-ity of this work. It will be important to examine test-retest reliability of our survey as well as understand if there are any maturation effects. Additionally, the method of LPA for placing teachers in quadrants is highly reliant on the vari-ables entered into the analysis. Going forward, we will seek to refine the variables in order to try to better distin-guish elements of teaching that are unique to each quad-rant. LPA is also sensitive to the sample, as patterns of responses for a teacher are being compared to other teach-ers’ patterns. This led to some quite distinct patterns among teachers, as described for Quadrants 1 and 4 in the article. However, Quadrant 3 (low EAC/high SOS) appears less distinct, as the means for this group are closest to average for any of the groups. This could represent a legitimate pat-tern, but the concern could also be that we have pulled out distinctive patterns, resulting in one group that is less coherent than the others.
compatible with other studies that measure mathematics instruction. A concern that could be raised is that the level of teaching presented herein is higher (more attention to con-cepts, more productive struggle) than what typically has been reported for U.S. classrooms (see Schmidt et al., 2002). However, a direct comparison between studies is not possi-ble because, in presenting our figures, we have standardized our scales so that readers can “see” on which variables the relative magnitude of the differences between groups is larg-est. Thus, it is impossible to infer whether we have “too many” or “not enough” teachers in any given quadrant or scoring high or low on EAC and SOS. The only way to com-pare our sample with other samples would be to administer similar survey items with similar Likert scales.
It is worth remembering that the primary purpose in developing survey measures aligned to our theoretical framework was to test whether such measures capture meaningful differences in teaching practice and, therefore, can be expected to be useful for large-scale research stud-ies. Correspondingly, our strategy was largely about differ-ences between teachers in our sample. In all of this work, we have not relied on comparing teacher responses on the survey against an objective standard. Observations that our sample appears to be performing at a “high level” imply that we might want to do that in the future. Nevertheless, we find it interesting and important that the variation we observed in our sample in teachers’ responses to our survey items is associated with meaningful differences in teaching and student learning.
Contribution of a Theoretical Framework
What role did our theoretical framework play in our endeavors? First, it drew our attention to empirically sup-ported features of teaching that matter for students’ devel-opment of conceptual understanding. We took a bet on the constructs of EAC and SOS—not only because of their empirical backing (Hiebert & Grouws, 2007) but also because they appeared to operate at an optimal grain size, meaning that they probably contain within them a coherent and somewhat stable constellation of subconstructs (such as those we identified and tested in Claim 2). Yet they are not so large that they mix together dozens of discrete fea-tures whose interactions remain unexamined. Our approach contrasts with the use of larger categories of teaching, such as reform versus traditional instruction, that are used to refer to a wide variety of features (e.g., students’ working in small groups, the use of manipulatives, etc.) that—in different and often ill-defined configurations—are taken to define the category.
Second, the theoretical framework guided the develop-ment of all of our measures, which ensures common con-structs as a focus of measurement and provides the optimal environment for empirical tests for our claims contributing
to a validity argument. Thus, we are testing whether teach-ers’ responses to survey items and their resultant quadrant placement are observable in practice and whether they cor-relate with other measures in ways that are expected and explainable by the theory.
Third, the theoretical framework provides meaning to instructional features and their interrelationships as well as their relationship to what and how students learn. As research-ers, theory helps us to understand what we are studying and to make predictions. Theory is useful to teachers as well, in that it provides a conceptual framework for making sense of research findings and their own teaching. Without theory, teachers are left with isolated findings and little guidance on how and when to employ “proven” techniques.
Implications for the Common Core Era
Our quest to design measures of teaching at scale that validly represent ways in which teachers are responding to calls to “teach for conceptual understanding” has renewed relevance in the present Common Core environment. Because more states are using the Common Core or Common Core–related standards and assessments, increasing num-bers of teachers—whose students’ learning will be judged based on these assessments—have begun to shift their prac-tice to support students’ development of conceptual under-standing. This state of affairs (large numbers of teachers working toward a common goal) is fertile ground not only for large-scale approaches to the development of curriculum and professional development but also for large-scale approaches to measuring teaching. Here, we have taken the first steps toward constructing a validity argument regarding the inferences that can be made about teaching based on teachers’ responses to one such large-scale measure of teach-ing: survey items aimed at measuring theoretically based and empirically supported features of mathematics instruc-tion that matter for student learning in the Common Core era. As our validity argument progresses, we will feel increasingly confident in the use of this instrument to pro-vide an efficient means of tailoring large-scale efforts to improve teaching as well as its ability to provide initial insights (obtained through comparative analysis) into the kinds of experiences and settings that appear to foster—or not—the improvement of teaching and student learning.
![FIGURE 1. 2 × 2 matrix displaying our profiles of teaching along two dimensions (explicit attention to concepts [EAC] and students’ opportunity to struggle [SOS]).](https://thumb-eu.123doks.com/thumbv2/123dok_br/18134931.325752/3.918.476.838.106.322/displaying-profiles-teaching-dimensions-explicit-attention-concepts-opportunity.webp)