Photoperiod Regulates Lean Mass Accretion,
but Not Adiposity, in Growing F344 Rats Fed
a High Fat Diet
Alexander W. Ross☯, Laura Russell☯, Gisela Helfer, Lynn M. Thomson, Matthew J. Dalby,
Peter J. Morgan*
Rowett Institute of Nutrition and Health, University of Aberdeen, Aberdeen, Scotland, United Kingdom
☯These authors contributed equally to this work. *[email protected]
Abstract
In this study the effects of photoperiod and diet, and their interaction, were examined for their effects on growth and body composition in juvenile F344 rats over a 4-week period. On long (16L:8D), relative to short (8L:16D), photoperiod food intake and growth rate were in-creased, but percentage adiposity remained constant (ca 3-4%). On a high fat diet (HFD), containing 22.8% fat (45% energy as fat), food intake was reduced, but energy intake in-creased on both photoperiods. This led to a small increase in adiposity (up to 10%) without overt change in body weight. These changes were also reflected in plasma leptin and lipid levels. Importantly while both lean and adipose tissue were strongly regulated by photoperi-od on a chow diet, this regulation was lost for adipose, but not lean tissue, on HFD. This implies that a primary effect of photoperiod is the regulation of growth and lean mass accre-tion. Consistent with this both hypothalamicGHRHgene expression and serum IGF-1 levels were photoperiod dependent. As for other animals and humans, there was evidence of cen-tral hyposomatotropism in response to obesity, asGHRHgene expression was suppressed by the HFD. Gene expression of hypothalamicAgRPandCRH, but notNPYnorPOMC, ac-corded with the energy balance status on long and short photoperiod. However, there was a general dissociation between plasma leptin levels and expression of these hypothalamic energy balance genes. Similarly there was no interaction between the HFD and photoperiod at the level of the genes involved in thyroid hormone metabolism (Dio2,Dio3,TSHβor
NMU), which are important mediators of the photoperiodic response. These data suggest that photoperiod and HFD influence body weight and body composition through indepen-dent mechanisms but in each case the role of the hypothalamic energy balance genes is not predictable based on their known function.
a11111
OPEN ACCESS
Citation:Ross AW, Russell L, Helfer G, Thomson
LM, Dalby MJ, Morgan PJ (2015) Photoperiod Regulates Lean Mass Accretion, but Not Adiposity, in Growing F344 Rats Fed a High Fat Diet. PLoS ONE 10(3): e0119763. doi:10.1371/journal.pone.0119763
Academic Editor:Julie A. Chowen, Hosptial Infantil
Universitario Niño Jesús, CIBEROBN, SPAIN
Received:September 26, 2014
Accepted:January 16, 2015
Published:March 19, 2015
Copyright:© 2015 Ross et al. This is an open
access article distributed under the terms of the
Creative Commons Attribution License, which permits unrestricted use, distribution, and reproduction in any medium, provided the original author and source are credited.
Data Availability Statement:All relevant data are
within the paper and its Supporting Information files.
Funding:The authors would like to acknowledge the
Introduction
For many mammals physiological indices such as food intake, growth, energy balance and re-productive status are not fixed, but vary with the season of the year [1]. The evolutionary ad-vantage of these changes is to ensure that animals are optimally adapted for survival to their changing seasonal environment. The changes in physiology are often marked in magnitude, tightly controlled by photoperiod and homeostatic. They are therefore unlike changes induced by environmental stresses such as food deprivation or overnutrition [2]. Evidence to date also suggests that the marked changes in seasonal energy balance and growth involve novel neuro-endocrine mechanisms and on this basis may provide an opportunity to develop new insights into the neuroendocrine control of physiology.
Studies on a number of species have indicated that the effects of photoperiod on the neuro-endocrine system are mediated through the hormone, melatonin, which acts on the pituitary, pars tuberalis [3]. In turn this triggers downstream alteration of thyroid hormone and retinoic acid metabolism within the tanycyctes and ependymal cells around the third ventricle of the hypothalamus [3,4]. It is thought that changes in both thyroid hormone and retinoic acid bio-availability within the hypothalamus alter the neuroendocrine systems controlling growth, en-ergy balance and reproduction [5,6].
The juvenile F344 rat has become a particularly useful model for the study of the effects of photoperiod on growth, body weight and energy balance [7]. Under short photoperiod food in-take is reduced, growth rates are slower, and body weights lower relative to rats held under long photoperiod. The slower rate of growth under short photoperiod is associated with lower hypothalamicGHRHgene expression and lower serum IGF-1 levels [7]. Consistent with the re-duced levels of food intake under short photoperiod are lower levels of the orexigenic gene, AgRP, in the arcuate nucleus (ARC). Paradoxically, despite lower food intake, expression of the orexigenic geneNPYis higher in the ARC in short relative to long photoperiod. It has been suggested that the main role of NPY under these conditions may be to inhibit GHRH and hence the growth axis, leaving AgRP as the main regulator of food intake [7].
In both animal models and humans it has been shown that the neuroendocrine growth axis is influenced by either obesity status or feeding on a high fat diet, leading to increased adiposity. In humans the amplitudes of both spontaneous and stimulated pulsatile GH secretion are blunted [8,9,10]. Likewise, in rats and mice, obesity is associated with hyposomatotropism [11,12,13,10,14,15,16]. The origins of this reduced somatotrophic activity appears to vary ac-cording to the model examined. For example in Zucker rats, a genetic model of obesity, both GHRHandSRIFgene expression are suppressed in obese relative to lean rats, indicating hypo-thalamic involvement in the hyposomatotropism [14,13]. By contrast in ob/ob and db/db mice as well as diet-induced obese mice and rats, there is no central effect suggesting a more periph-eral origin to the condition [17,15,16,18]. In humans, childhood obesity is associated with in-creased height (growth) as well as adiposity [19]. At the same time, in both children and juvenile rodent models, obesity is associated with suppressed activity of the growth hormone axis [19,10]. Thus there may not always be a direct correlation between growth hormone secre-tion, IGF-1 levels and growth.
The susceptibility of photoperiodic species to high fat diets and adiposity seems to vary ac-cording to species. Siberian hamsters, Shaw’s Jird and Bank voles have each been shown to be resistant to diet-induced obesity when fed a HFD [20,21,22]; by contrast Syrian hamsters be-come obese [23]. It has been suggested that those animals which lose body or fat mass in re-sponse to short photoperiod as part of their normal seasonal strategy are resistant to diet induced obesity, whereas those that gain weight or increase fat mass in response to short photo-period are prone to obesity on a HFD [20].
Competing Interests:The authors have declared
Juvenile F344 rats gain less weight on short photoperiod than on long photoperiod [24,7], and so might be predicted to be resistant to diet-induced obesity. A recent study of F344 rats, which were fed a very high fat diet, supports this prediction, based on epididymal fat and leptin levels [25]. However in this study, a more comprehensive assessment of body composition has been used and we show that photoperiodically-sensitive F344 rats are susceptible to diet-induced obesity. Moreover in the light of the suppressive effects that diet diet-induced obesity and increased adiposity have on the somatotrophic axis in both juvenile and adult rodents models and humans, we sought to examine the potential interactions between the effects of consuming a HFD and photoperiod on the regulation of growth, food intake and body weight in juvenile F344 rats.
Materials and Methods
Animals
Male F344/NHsd rats aged 3–5 weeks were obtained from Harlan, USA. Initially the 40 rats were group housed, 5 per cage for one week under 12 h light:12 h dark photoperiod withad li-bitumaccess to water and standard chow (CRM(P), Rat and Mouse Breeder and Grower, stan-dard AIN93G-based pelleted diet, product code 801722, Special Diet Services, Witham, Essex, UK). This diet provided 3.59 kcal/g of energy with 9.08% calories as fat, 68.9% as carbohydrate and 22.0% as protein, and contained fat, carbohydrate and protein at 3.4, 4.2 and 18.4%w/w re-spectively. Rats (weight range of 77.7–106.4g, median 86.6g), were then randomly assigned to four weight-matched groups (n = 10 per group) and housed singly in standard rat cages type RC2/f, size 39.5 x 57.0 x 22.5cm, w x l x h. Two groups were switched to a short photoperiod (8 h light: 16 h dark; SD) and the remaining two groups to a long photoperiod (16 h light: 8 h dark; LD). All rats had continuousad libitumaccess to water. One group in each photoperiod was providedad libitumeither a high fat diet, or the standard chow diet, for 4 weeks. The high fat diet (TD.06415) was obtained from Harlan Teklad Custom Diets (Madison, USA) and pro-vided 4.6 kcal/g with 44.8% of calories in the form of fat, 36.2% as carbohydrate and 19.0% as protein and contained fat, carbohydrate and protein at 22.8, 41.4 and 21.7%w/w respectively. This experiment was repeated to provide sufficient tissues and brains for analysis (repeat study weight range of 124.6–150.0g, median 141g). Group sizes were initially selected based on previous experience where F344 rats showed a significant weight difference after 4 weeks in photoperiod, then in the repeat study, these comprised of 8 rats per group, determined by a power calculation based on results obtained. For example, for gene expression changes that typically showed a difference in expression of ~60% with a standard deviation of 29.6, an R value of 1.99 (where R is the ratio of the difference required to detect the between-animal standard deviation) then, in a power calculation for 95% confidence, 8 animals per group were required. Apart from room lighting changes, all other environmental conditions were the same; temperature was 21°C +/- 2°C, relative humidity of 55% +/- 10% and average light inten-sity of 150 lux, with plastic tunnel and shredded paper enrichment and G6 woodchip bedding. Daily visual health checks on all rats were performed and no welfare-related interventions were required.
collected for serum and plasma and brains were immediately removed and frozen on dry ice, while livers, kidneys, muscle, epididymal fat pads and pituitaries were collected and wet weights recorded. ZT3 was chosen as a single time point to assess the effects of photoperiod as we have previously shown that the dark/light transition synchronises the expression of the clock gene Per1 and the transcription factor ICER [27]. On this basis it is used as a standard time point to determine the effect of photoperiod on hypothalamic gene expression [5,7,28]. It is also important to note that previous studies have shown the validity of using single time-point determinations to assess the effect of photoperiod, since there is minimal diurnal varia-tion in the hypothalamic genes or hormone levels studied in this paper [29].
Ethics statement
All animal procedures were performed according to the Animals (Scientific Procedures) Act, 1986, were licenced by the UK home office under Project Licence PPL60/3615 and PPL60/4282 and approved by the local ethics committee at the University of Aberdeen, Rowett Institute of Nutrition and Health (Approval numbers SA06/17E and SA12/10E).
Gene Expression Studies
Coronal sections (20μm) of rat forebrains were cut from -4.36 mm to -2.16 mm relative to
Bregma for the ARC and -2.16 mm to -0.96 mm for the paraventricular nucleus (PVN) accord-ing to the rat atlas [30] and collected onto poly-lysine coated glass slides as described previously [7]. Riboprobes for in situ hybridization were prepared from cDNA templates that were cloned as described previously forNPY[31],NMU[32],pro-opiomelanocortin (POMC)and Agouti-related peptide (AgRP)[33],corticotrophin releasing hormone (CRH)[34],types 2 and 3 deiodi-nases (Dio2 and Dio3)[35] andgrowth hormone releasing hormone (GHRH)[7]. cDNA fragment of the ratthyroid stimulating hormoneβsubunit (TSHβ)(505 bp), was amplified by PCR using standard conditions from F344 rat hypothalamic cDNA, using the forward primer 5’-CCGAAGGGTATAAAATGAACAGAG and reverse primer 5’ -ACCAGATTGCATTGC-CATTACAGT designed against the ratTSHβcDNA sequence (GenBank accession number XM_008761373). The amplified product was cloned into pCR-Blunt 4-TOPO vector (Invitro-gen, Paisley, UK) following the manufacturer’s protocol. The sequence was verified by sequenc-ing with Beckman Coulter sequencsequenc-ing chemistry on a CEQ8000 automated sequencer
(Beckman Coulter UK Ltd, High Wycombe, Bucks, UK). The TSHβtemplate was linearised usingNot1 andSpe1 restriction enzymes for use with T3 and T7 polymerases to generate anti-sense and anti-sense riboprobes respectively.
Messenger RNA levels were measured by in situ hybridization (ISH) as previously described in detail [33]. Briefly, brain sections were fixed, acetylated (with the exception of NPY) and hy-bridized overnight at 58°C with sense and antisense riboprobes labelled with35S (1.0–1.5 x 10¹⁰dpm/L). Slides were treated with RNase A, washed at 60°C in 0.1x sodium citrate salt for 30 minutes, dried and then apposed to Hyperfilm Max autoradiographic film (Amersham Pharmacia Biotech UK Ltd., Buckinghamshire, UK). A standard curve was generated with14C microscales (Amersham Pharmacia Biotech UK Ltd., Buckinghamshire, UK) and used to cal-culate gene expression levels (integrated optical density) using ImagePro Plus, version 6 (Media Cybernetics, Buckinghamshire, UK). No signals were detected for any of the sense probes in the hypothalamus.
Circulating Hormones and Metabolites
growth factor-1 (IGF-1) levels were measured using an Octeia immunoenzymometric assay kit (IDS Ltd., Boldon, UK) suitable for use with rat/mouse samples. Growth hormone levels were measured using a rat/mouse growth hormone ELISA kit (Millipore (UK) Limited, Watford, UK) in pituitary extracts prepared according to the manufacturer’s protocol.
Plasma glucose, non-esterified fatty acid (NEFA) and triglyceride levels were determined using a Konelab 30 machine (Thermo Fisher Scientific, Basingstoke, UK). The sensitivity of the assays were 0.34 mmol/L, 0.04 mmol/L and 0.06 mmol/L and the intra assay CVs 0.35%, 2.0% and 2.9%, respectively.
Statistics
Body weight, food intake and body composition data were analysed via a repeated measures three-way analysis of variance on the rat groups (Genstat version 10, Rothamsted Research, UK). Tissues, gene expression and hormone data were analysed by a two-way analysis of vari-ance with use of the Holm-Sidak post-test, followed by one-way analysis of varivari-ance using mul-tiple comparison tests with either Fisher LSD method or Dunn’s method on ranks and t-test where appropriate on treatment groups (Sigma Plot 12, Systat Software Inc., London, UK). Means without a common letter were statistically different with statistical significance set at p<0.05.
Results
Photoperiod and high fat diet on food intake, body weight and body
composition
Juvenile F344 rats reared from 4–6 weeks of age on either long or short photoperiod showed di-vergent body weight. Those on short photoperiod were 14% lower (P<0.001) in weight after 4
weeks relative to those on long photoperiod. On a HFD there was no significant additional ef-fect on body weight in rats reared on either LD or SD (Fig. 1a). In the SD HFD fed group, one rat failed to respond to photoperiod and gained weight similar to the LD rats. In addition, a rat from the SD chow fed group failed to thrive, gaining less weight than the remainder of the group. These two rats were considered outliers and were omitted from all analyses, thus the SD chow and SD HFD groups each had n = 9 rats in the analyses.
Consistent with the difference in body weights on LD and SD, there was a clear LD-SD dif-ference in both food and protein intakes (both p<0.001) when fed a chow diet (Fig. 1b,c).
However, when fed a HFD diet, food and protein intakes were lower than the food and protein intakes on a chow diet, for both LD (food and protein, p<0.001) and SD rats (food, p<0.001,
protein p = 0.008) (Fig. 1b,c). In addition there were small differences in food (P = 0.03) and protein (p = 0.015) intakes between LD and SD rats on the HFD (Fig. 1b,c). Energy intake was higher in LD than in SD when fed either chow (p<0.001) or HFD (p = 0.004). In addition,
en-ergy intake on a HFD was significantly higher than chow in both photoperiods (p<0.001),
(Fig. 1d). This is reflected in changes in body composition where there was a small but signifi-cant effect of photoperiod on fat mass between rats fed on chow in LD and SD, (Fig. 1e). Con-sumption of a HFD markedly increased adiposity to a similar level in terms of gross fat (p<0.001) and fat as a percentage of body weight (p<0.001) in rats on both LD and SD within
1 week (Fig. 1e,f). This effect of HFD was maintained over 4 weeks, but there was no significant effect of photoperiod (Fig. 1e,f).
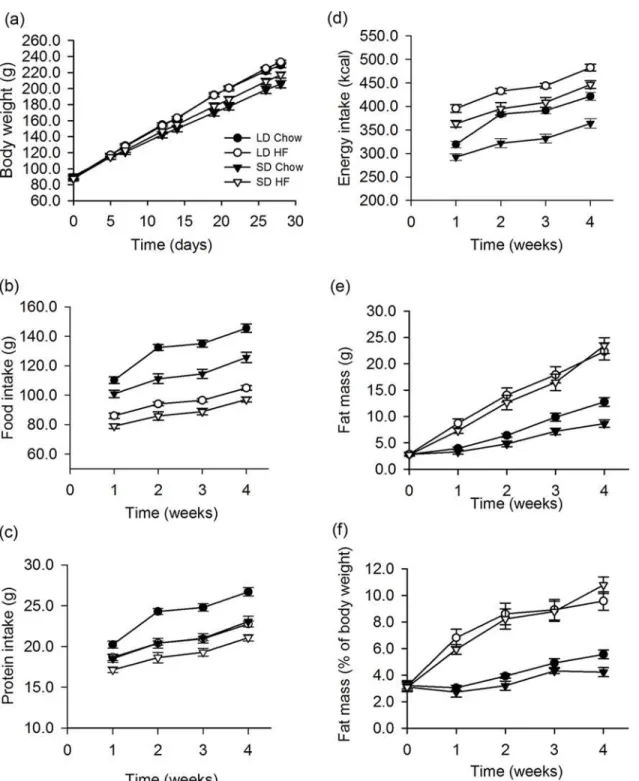
Fig 1. Effect of photoperiod and high fat diet (HFD) on body weight, food, protein and energy intake and body fatness of juvenile F344 rats over 4 weeks of treatment.(a) Body weight was significantly higher in LD compared to SD (p<0.001) on chow diet with no effect of a HFD after 4 weeks. (b) Food
intake in grams was significantly higher in LD than SD on chow diet (p<0.001) and these intakes were higher than the intakes of the HFD fed rats (p<0.001).
There was a small photoperiodic difference in food intake when fed the HFD (p = 0.03). (c) Protein intake was higher in the LD than the SD chow fed rats (p<0.001). HFD fed rats showed lower protein intakes than the chow fed rats (LD; p<0.001, SD; p = 0.008) and there was a significant effect of photoperiod
(p = 0.015). (d) Energy intakes were higher in LD than SD rats fed either chow (p<0.001) or HFD (p = 0.004), while rats fed the HFD had higher energy
intakes than chow in both photoperiods (p<0.001). (e) Fat mass measured by Echo MRI was slightly higher in LD than SD rats on chow (p = 0.026), while the
HFD fed rats did not differ in their intakes with photoperiod. The HFD fed rats had markedly higher fat masses that were significantly higher than chow fed rats (p<0.001). (f) A HFD markedly increased adiposity as a percentage of body weight compared to chow fed rats and to a similar level in rats on both LD and SD
(p<0.001) with no effect of photoperiod. In all figures HF refers to HFD fed rats.
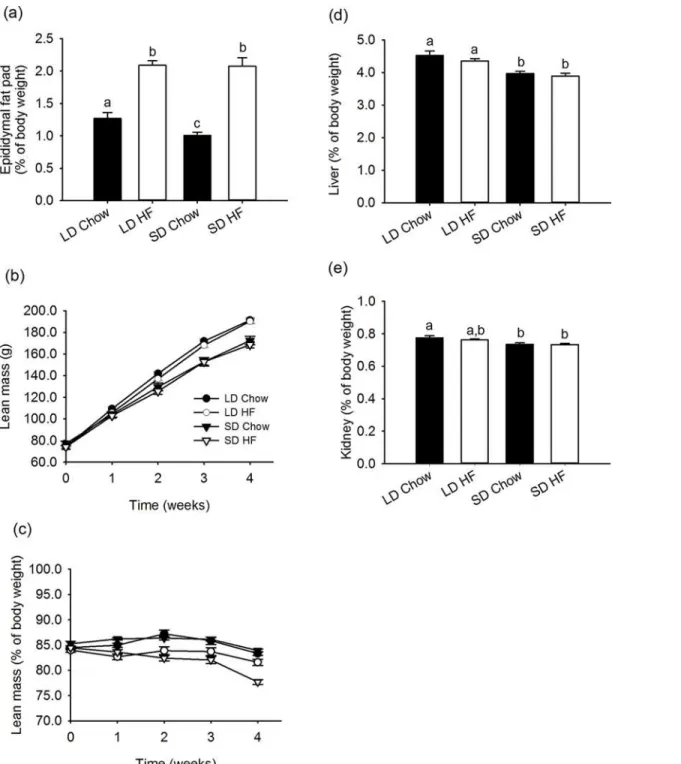
Fig 2. Effect of photoperiod and high fat diet (HFD) on epididymal fat, lean mass and liver and kidney weight of juvenile F344 rats over, or after, 4 weeks of treatment.(a) Epididymal fat pad mass as a percentage of body weight, was greater in LD than SD chow fed rats (p = 0.048). The fat pads masses were significantly greater with HFD feeding than chow in both photoperiods (p<0.001), but there was no effect of photoperiod with HFD feeding. (b) Absolute
lean mass was higher in LD than SD rats fed either chow or HFD. The lean masses were not changed by HFD feeding. (c) Lean mass as a percentage of body weight was not significantly different between LD and SD chow fed rats. The lean masses of HFD fed rats were lower than those of the chow fed rats with the SD HFD fed rats being significantly leaner than the LD HFD fed rats (p<0.001). (d) Liver mass was lower in SD than LD chow and HFD fed rats (both
p<0.05). The HFD did not impact on the liver masses in either photoperiod. (e) Kidney mass was also lower in both SD chow and HFD fed rats than chow fed
LD (P<0.05).
(p<0.001), (Fig. 2a). A clear effect of photoperiod on absolute lean (fat free) mass was
ob-served, being significantly higher in chow and HFD fed LD than SD rats (p<0.001), yet there
was no significant effect of HFD on lean mass under either photoperiod (Fig. 2b). In terms of lean mass as a percentage of body weight, there was no effect of photoperiod on chow fed rats, whereas the HFD fed rats were slightly but significantly less lean in SD than LD (p<0.001) and
less lean than the chow fed rats (LD; p = 0.009, SD; p<0.001). The visceral organs showed
simi-lar responses with the liver and kidney both closely reflecting the decrease in absolute lean mass in SD and no effect of HFD (Fig. 2d,e).
Blood hormone and metabolite levels
Serum levels of leptin, plasma levels of NEFA and TG were each unaffected by photoperiod in rats fed a chow diet; however each were markedly increased in rats fed HFD. Photoperiod had no additional effect (Fig. 3a-c). Blood levels of glucose were unaffected by diet or photo-period (Fig. 3d).
Hypothalamic gene expression
Photoperiod had a strong effect on the expression of genes involved in energy balance and growth within the hypothalamus after 4 weeks of treatment. Expression of the orexigenic gene,
Fig 3. Effect of photoperiod and high fat diet (HFD) on hormone and metabolites levels in juvenile F344 rats after 4 weeks of treatment.(a-c): (a) serum Leptin, (b) plasma NEFA and (c) plasma Triglyceride levels were not changed by photoperiod but were significantly higher in HFD fed rats in both photoperiods (all p<0.05). (d) Glucose levels were unchanged with diet or photoperiod.
AgRP, in the ARC was lower in SD than LD (p<0.001), (Fig. 4a). Also expression ofCRH(an
inhibitor of food intake) in the PVN was increased in rats on SD relative to LD (p = 0.044), (Fig. 4b). ForAgRP, HFD reduced the expression level further in SD (p = 0.001), (Fig. 4a), but no additional effect onCRHexpression was observed with HFD feeding (Fig. 4b). These gene expression changes are consistent with a lower level of food intake in SD rats.
By contrast expression of the orexigenic geneNPY, in the ARC, tended to increase in SD rel-ative to LD rats but the level did not reach significance in this study, whereas a significant in-crease in SD has been observed in our previous studies [7] (Fig. 4c). HFD had no effect onNPY gene expression. As previously described there are two distinct areas of expression for the POMCgene in the hypothalamus. The first is in the ARC, a region normally associated with its anorexigenic activity. Here there was no effect of either photoperiod or HFD onPOMCgene expression (Fig. 4d). The second was in the ventral ependymal region, where strong suppres-sion ofPOMCmRNA was observed in response to SD relative to LD (p<0.001), (Fig. 4d). This
finding is concordant with a previous study [7]. However there was no effect of the HFD under either photoperiod (Fig. 4d).
The expression ofGHRHin the ARC was affected by both photoperiod and HFD (Fig. 4e). Under SD there was lower expression ofGHRHrelative to LD (p = 0.007) with chow. The HFD further suppressed gene expression under both LD (p = 0.014) and SD (p = 0.002), (Fig. 4e).
Growth hormone and IGF-1
Serum IGF-1 levels were 21.4% lower in F344 rats fed chow diets and exposed to SD for 4 weeks relative to LD treated animals (p<0.05). There was no difference in this response for
ani-mals given the HFD (Fig. 5a).
At a pituitary level, GH levels were unaffected by either photoperiod or diet (Fig. 5b).
Photoperiodic signalling genes in the pars tuberalis and ependymal cells
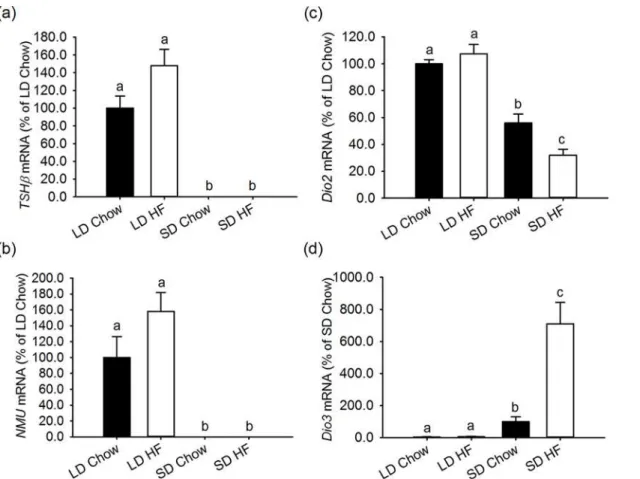
Using animals obtained in a separate study, which showed similar changes in body composi-tion, the impact of photoperiod and HFD were studied on the expression ofNMUandTSHβin the pars tuberalis, as well asDio2andDio3expression in the ependymal cells around the third ventricle. As reported previously [36], bothTSHβandNMUare strongly expressed in animals on LD, but only weakly (undetectably) expressed in rats on SD. The HFD had no additional ef-fect on these responses (Fig. 6a,b).
Within the hypothalamus, expression ofDio2andDio3were found to be sensitive to photo-period, withDio2expressed more weakly andDio3more strongly in SD relative to LD (both p<0.001) (Fig. 6c,d). HFD had no effect on the expression of either gene under LD conditions,
yet strong effects under SD conditions. HFD caused a marked suppression ofDio2(p<0.001)
(Fig. 6c) and a 7-fold increase inDio3expression under SD (p = 0.001) (Fig. 6d).
Discussion
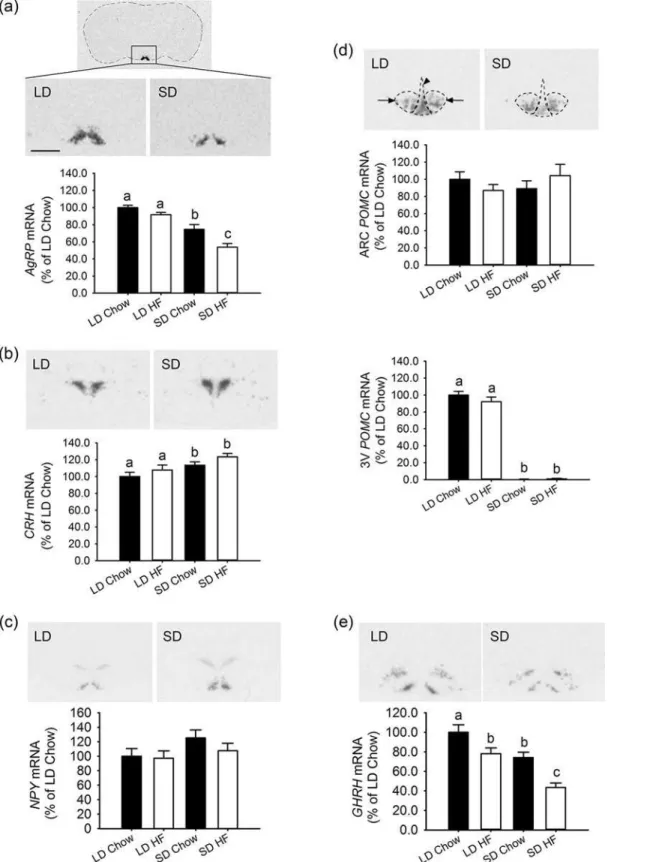
Fig 4. Effect of photoperiod and high fat diet (HFD) on hypothalamic expression of genes involved in energy balance growth in juvenile F344 rats 4 weeks of treatment, measured by quantitative in situ hybridisation.(a)AgRPmRNA expression quantified in the ARC was lower in SD than LD chow fed rats (p<0.001). The HFD had no effect in LD but reduced theAgRPlevels further than chow fed rats in SD (p = 0.001). (b)CRHmRNA expression in the PVN
lean mass and adipose tissue accretion suggest that a primary effect of photoperiod in juvenile F344 rats is to set the trajectory for growth in these animals.
The effect of photoperiod, but not HFD, on serum IGF-1 levels, is consistent with this effect on lean mass. When fed a HFD, F344 rats adjust food and protein intake downward, as also ob-served by Togo et al. [25]. This suggests that F344 rats attempt to balance their food intake in terms of energy with the macronutrient (protein) requirements for growth. The resulting adi-posity observed in this study, implies that while food intake is suppressed, when on a high fat diet, it is not possible to suppress intake sufficiently to prevent gain in body fat. The fact that rats suppress protein intake on a HFD relative to chow fed rats on the same photoperiod, yet manage to achieve the same lean mass, indicates that the HFD must modulate protein uptake or metabolism. Evidence from the literature suggests that a HFD alters not only the structure of the gut, but also can increase amino acid transport across the gut [37,38]. Thus it is likely that a HFD increases the efficiency of amino acid uptake and this could account for the lower level of protein intake on a HFD relative to chow fed rats.
These data contrast with a recent study, which reported F344 rats to be seemingly resistant to diet induced obesity (DIO), on the basis of measurements of epididymal fat and serum leptin levels, when fed a diet containing 55% fat. [25]. At present there is no obvious explanation for this difference in response of F344 rats to high fat diets between the two studies. Possible expla-nations may lie in differences in the high fat diets used and/or differences in the strain of F344 rat. In support of the latter we have previously reported differential responses to photoperiod in different strains of F344 rats [7], which indicates that F344 rats obtained from commercial suppliers/geographical locations are not genetically homogeneous.
The current study also revealed a clear interaction between HFD and photoperiod at the level ofGHRHgene expression. In common with Zucker rats there is a reduction in hypotha-lamicGHRHexpression, when fed a HFD [13,14]. Such an effect has not been seen in either mice or rats fed a HFD [17,15,16]. In those cases,GHRHgene expression was measured by Northern blotting or qPCR rather than in situ hybridisation used in this study. The latter is expression in either photoperiod. (d)POMCmRNA expression in the ARC is outlined and marked by arrows while atypicalPOMCexpression in the ependymal layer of the 3rdventricle is marked by an arrowhead. In the ARC,POMClevels were unaffected by photoperiod or diet. In contrast, levels of POMCmRNA were markedly reduced in SD photoperiod (p<0.001) with no additional effects of HFD feeding. (e)GHRHmRNA expression in the ARC was lower in SD than LD chow fed rats. HFD reduced theGHRHexpression in LD and even further in SD. Scale bar = 1.0mm for all images.
doi:10.1371/journal.pone.0119763.g004
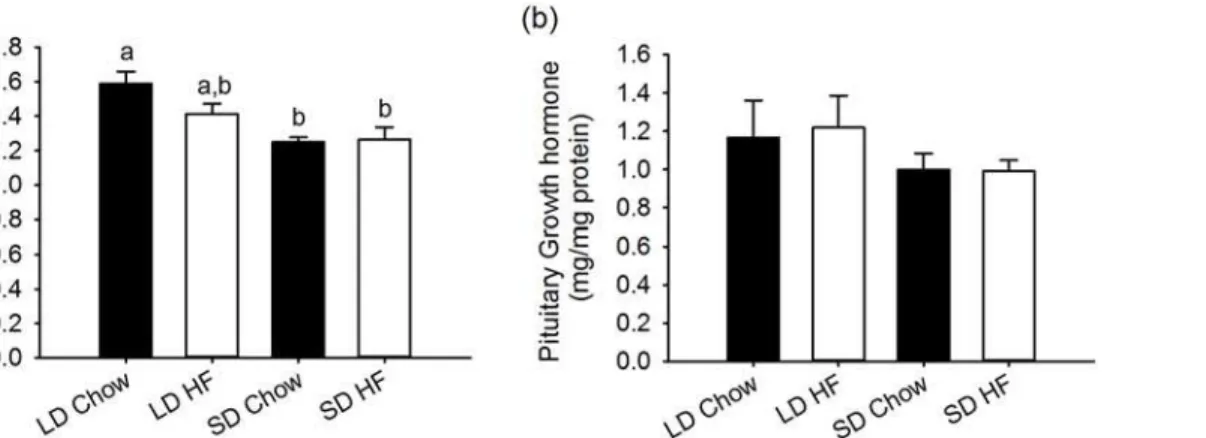
Fig 5. Effect of photoperiod and high fat diet (HFD) on serum IGF-1 and pituitary growth hormone (GH) levels in juvenile F344 rats after, 4 weeks of treatment.(a) IGF-1 levels in serum were lower in SD chow and HFD fed rats than LD chow fed while LD HFD fed rats were not significantly different. (b) Growth hormone levels in the pituitary were unaffected by either photoperiod or HFD.
likely to provide more accurate assessment of gene expression in specific regions of the brain. Despite the lowerGHRHexpression in F344 rats on HFD under both LD and SD, there were no concomitant changes in serum IGF-1 levels over the 4 weeks of the experiment. Nonetheless IGF-1 was clearly suppressed by SD relative to LD, as previously described [7]. Since studies in mice have shown that it can take up to 8 weeks for effects of HFD on circulating IGF-1 levels to become apparent, with no observable change after 4 weeks of HFD [11], it is possible that changes in IGF-1 in F344 rats may become evident following a longer period of HFD feeding. It is also possible that the temporal mRNA expression profile for GHRH does not correlate fully with the temporal protein expression of GHRH, which could help to explain the lack of correlation of the serum IGF-1 and tissue GHRH mRNA responses.
Pituitary GH is a rather crude measure and despite clear effects of photoperiod on growth and serum IGF-1, there were no observable effects of photoperiod or HFD on pituitary GH. Since pulsatile GH is suppressed by HFD in other rodent models, even after only 4 weeks of treatment, and in humans [11], measurement of pulsatile GH is required to gain a proper as-sessment of the effects of photoperiod and HFD on GH status. Thus while the relative levels of serum IGF-1 correlate with the levels of fat free mass under the different conditions of
Fig 6. Effect of photoperiod and high fat diet (HFD) on gene expression ofTSHβandNMUin the pars tuberalis of the pituitary and Dio2 and Dio3 in the tanycytes around the third ventricle in juvenile F344 rats after 4 weeks of treatment.Gene expression was measured by quantitative in situ hybridisation. (a,b) Expression ofTSHβ(a) andNMU(b) mRNAs in the pars tuberalis were significantly lower in both chow and HFD fed SD compared to LD rats. (c)Dio2mRNA levels in the ependymal cells around the 3rdventricle were lower in SD than LD chow and HFD fed rats (p<0.001). HFD reduced Dio2 further in SD compared to LD conditions (p<0.001). (d)Dio3mRNA expression was higher in SD than LD rats. HFD increased theDio3mRNA level significantly in SD (p<0.001), but not in LD.
photoperiod and HFD feeding, this study has shown that central inhibition of GHRH may be an early event in the pathogenic effects of a HFD on the somatotrophic axis.
A number of blood metabolites have been implicated in the regulation of the somatotrophic axis and these include glucose, leptin and NEFA [10]. The role of glucose in the regulation of the GH axis is contentious [10,8]. There is some evidence that glucose may suppress hypotha-lamic GHRH in diabetic rats [39], but the lack of change in glucose levels between chow fed and HFD rats in this study suggests that glucose does not play a major role in regulating GHRH. Leptin is a circulating hormone that increases with adiposity resulting from a HFD [40], but in humans serum GH levels are inversely correlated with leptin [41,42]. In rats, leptin is associated with activation of the GH axis [8,10,43], yet such a role is at odds with the results reported in this study. Plasma NEFA levels also increased with adiposity and they have been shown to inhibit the GH axis, by inhibiting GH secretion from the pituitary [44]. In this study while circulating NEFAs increased in rats on a HFD there were no associated changes in serum IGF-1 levels suggesting that there is no effect at the level of the pituitary or below. There is some evidence that NEFAs may influence the GH axis at the level of the hypothalamus [45] and thus the increased levels of NEFA may be causal in the suppression of hypothalamic GHRH, although this remains to be established [10].
Despite strong effects of HFD on food and protein intakes, other than forAgRPthe expres-sion of hypothalamic energy balance genes (CRH,POMCand NPY) were unaffected by HFD. While it is known that HFD can alter the circadian feeding behaviour of rats and mice there is no evidence that tissue rhythms in the hypothalamic SCN and arcuate nucleus are affected by HFD [46,47]. On this basis it is unlikely that effects of HFD may have been missed due to a phase shift in expression.
The effects of photoperiod on neuroendocrine function involve TSHβand Dio2/3 in the pars tuberalis (PT) and tanycytes respectively [52,53,54,5]. It may also involve NMU, which is expressed in the PT and is under photoperiodic control [36]. The effects of photoperiod on TSHβ,NMU,Dio2and Dio3 gene expression are consistent with previous observations, namely LD increasesTSHβ,NMUandDio2expression and decreasesDio3expression relative to SD [36]. This would give rise to a net increase in hypothalamic T3 production under LD relative to SD. How this affects the neuroendocrine regulation of energy balance and growth is still un-known. While the HFD had no effect on hypothalamic energy balance genes, it did suppress GHRHgene expression under both photoperiods. It seems unlikely that these effects of a HFD onGHRHare mediated through changes inDio2andDio3gene expression or associated changes inTSHβandNMU, as the pattern of gene expression changes in response to a HFD do not suggest a direct or simple correlative relationship. Instead it is more likely the effects of a HFD onGHRHinvolve mechanisms that are independent of the neuroendocrine pathways regulated by photoperiod.
Overall the results from this study clearly support the conclusion that over the short term, photoperiod exerts tight control of growth in F344 rats, in terms of lean mass accretion. To achieve the target rate of lean mass accretion (growth) set by photoperiod, it is implied that food intake is adjusted to match the protein requirements for growth. On a HFD, rats reduce their food intake, which suggests that protein uptake and assimilation must be more efficient on a HFD than on a chow diet. Nonetheless energy intake is increased leading to greater depo-sition of adipose tissue. This rebalancing of food intake, energy intake and protein intake, with-out overt effects on genes involved in the hypothalamic energy balance circuits, indicates that factors other than leptin must be involved in determining this new equilibrium when animals are placed on a HFD. By contrast a HFD exerts a suppressive effect on the growth axis at the level of the hypothalamus (GHRH), and it appears that these effects are independent of the photoperiod regulatory mechanisms. The effects on GHRH appear to be an early effect of a HFD on the somatotrophic axis and it seems likely that overt effects on serum IGF-1 levels and lean mass accretion will only be seen after prolonged exposure (>4 weeks) to a HFD.
Acknowledgments
The authors also thank Donna Wallace and Animal House staff at the Rowett Institute of Nu-trition and Health, University of Aberdeen for the daily care of experimental rats and for body weight, food intake and MRI measurements.
Author Contributions
Conceived and designed the experiments: AWR LR PJM. Performed the experiments: AWR LR GH LMT MJD. Analyzed the data: AWR LR MJD PJM. Wrote the paper: AWR LR PJM.
References
1. Ebling FJP. On the value of seasonal mammals for identifying mechanisms underlying the control of food intake and body weight. Horm Behav. 2014; 66: 56–65. doi:10.1016/j.yhbeh.2014.03.009PMID: 24681216
2. Morgan PJ, Ross AW, Mercer JG, Barrett P. What can we learn from seasonal animals about the regu-lation of energy balance? Prog Brain Res. 2006; 153: 325–337. PMID:16876584
3. Dardente H, Hazlerigg DG, Ebling FJP. Thyroid hormone and seasonal rhythmicity. Front Endocrinol. 2014 Feb 26; 5:19. doi:10.3389/fendo.2014.00019PMID:24616714
5. Ross AW, Helfer G, Russell L, Darras VM, Morgan PJ. Thyroid Hormone Signalling Genes Are Regulat-ed by Photoperiod in the Hypothalamus of F344 Rats. Yamazaki S, Regulat-editor. PLoS ONE. 2011 Jun 22; 6(6):e21351. doi:10.1371/journal.pone.0021351PMID:21731713
6. Helfer G, Ross AW, Russell L, Thomson LM, Shearer KD, Goodman TH, et al. Photoperiod regulates vi-tamin A and Wnt/β-catenin signaling in F344 rats. Endocrinology. 2012; 153: 815–824. doi:10.1210/ en.2011-1792PMID:22210746
7. Ross AW, Johnson CE, Bell LM, Reilly L, Duncan JS, Barrett P, et al. Divergent regulation of hypotha-lamic neuropeptide Y and agouti-related protein by photoperiod in F344 rats with differential food intake and growth. J Neuroendocrinol. 2009; 21: 610–619. doi:10.1111/j.1365-2826.2009.01878.xPMID: 19490367
8. Scacchi M, Pincelli AI, Cavagnini F. Growth hormone in obesity. Int J Obes Relat Metab Disord. 1999; 23: 260–271. PMID:10193871
9. Berryman DE, Glad CAM, List EO, Johannsson G. The GH/IGF-1 axis in obesity: pathophysiology and therapeutic considerations. Nat Rev Endocrinol. 2013; 9: 346–356. doi:10.1038/nrendo.2013.64 PMID:23568441
10. Müller EE, Locatelli V, Cocchi D. Neuroendocrine control of growth hormone secretion. Physiol Rev. 1999; 79: 511–607. PMID:10221989
11. Huang L, Steyn FJ, Tan HY, Xie TY, Veldhuis JD, Ngo ST, et al. The decline in pulsatile GH secretion throughout early adulthood in mice is exacerbated by dietary-induced weight gain. Endocrinology. 2012; 153: 4380–4388. doi:10.1210/en.2012-1178PMID:22802464
12. Renier G, Gaudreau P, Hajjad H, Deslauriers N, Houde-Nadeau M, Brazeau P. Decreased pituitary growth hormone response to growth hormone-releasing factor in cafeteria-fed rats: dietary and obesity effects. Neuroendocrinology. 1990; 52: 284–290. PMID:2145525
13. Ahmad I, Finkelstein JA, Downs TR, Frohman LA. Obesity-associated decrease in growth hormone-releasing hormone gene expression: a mechanism for reduced growth hormone mRNA levels in geneti-cally obese Zucker rats. Neuroendocrinology. 1993; 58: 332–337. PMID:8255393
14. Tannenbaum GS, Lapointe M, Gurd W, Finkelstein JA. Mechanisms of impaired growth hormone se-cretion in genetically obese Zucker rats: roles of growth hormone-releasing factor and somatostatin. Endocrinology. 1990; 127: 3087–3095. PMID:1979030
15. Cattaneo L, De Gennaro Colonna V, Zoli M, Müller E, Cocchi D. Characterization of the hypothalamo-pituitary-IGF-I axis in rats made obese by overfeeding. J Endocrinol. 1996; 148: 347–353. PMID: 8699149
16. Cattaneo L, Luoni M, Settembrini B, Müller EE, Cocchi D. Effect of long-term administration of Hexarelin on the somatotrophic axis in aged rats. Pharmacol Res. 1997; 36: 49–54. PMID:9368914
17. Luque RM, Kineman RD. Impact of obesity on the growth hormone axis: evidence for a direct inhibitory effect of hyperinsulinemia on pituitary function. Endocrinology. 2006; 147: 2754–2763. PMID: 16513828
18. Iwakura H, Akamizu T, Ariyasu H, Irako T, Hosoda K, Nakao K, et al. Effects of ghrelin administration on decreased growth hormone status in obese animals. Am J Physiol Endocrinol Metab. 2007; 293: E819–825. PMID:17595213
19. Marcovecchio ML, Chiarelli F. Obesity and growth during childhood and puberty. World Rev Nutr Diet. 2013; 106: 135–141. doi:10.1159/000342545PMID:23428692
20. El-Bakry HA, Plunkett SS, Bartness TJ. Photoperiod, but not a high-fat diet, alters body fat in Shaw's jird. Physiol Behav. 1999; 68: 87–91. PMID:10627066
21. McElroy JF, Mason PW, Hamilton JM, Wade GN. Effects of diet and photoperiod on NE turnover and GDP binding in Siberian hamster brown adipose tissue. Am J Physiol. 1986; 250: R383–388. PMID: 3953850
22. Peacock WL, Speakman JR. Effect of high-fat diet on body mass and energy balance in the bank vole. Physiol Behav. 2001; 74: 65–70. PMID:11564453
23. Wade GN. Dietary obesity in golden hamsters: reversibility and effects of sex and photoperiod. Physiol Behav. 1983; 30: 131–137. PMID:6836036
24. Heideman PD, Sylvester CJ. Reproductive photoresponsiveness in unmanipulated male Fischer 344 laboratory rats. Biol Reprod. 1997; 57: 134–138. PMID:9209091
25. Togo Y, Otsuka T, Goto M, Furuse M, Yasuo S. Photoperiod regulates dietary preferences and energy metabolism in young developing Fischer 344 rats but not in same-age Wistar rats. Am J Physiol Endo-crinol Metab. 2012; 303: E777–786. doi:10.1152/ajpendo.00209.2012PMID:22811472
27. Messager S, Ross AW, Barrett P, Morgan PJ. Decoding photoperiodic time through Per1 and ICER gene amplitude. Proc Natl Acad Sci USA. 1999; 96: 9938–9943. PMID:10449798
28. Ross AW, Webster CA, Mercer JG, Moar KM, Ebling FJ, Schuhler S, et al. Photoperiodic regulation of hypothalamic retinoid signaling: association of retinoid X receptor gamma with body weight. Endocrinol-ogy. 2004: 145: 13–20. PMID:12960009
29. Ellis C, Moar KM, Logie TJ, Ross AW, Morgan PJ, Mercer JG. Diurnal profiles of hypothalamic energy balance gene expression with photoperiod manipulation in the Siberian hamster, Phodopus sungorus. Am J Physiol Regul Integr Comp Physiol. 2008; 294: R1148–1153. doi:10.1152/ajpregu.00825.2007 PMID:18234745
30. Paxinos G, Watson C. The Rat Brain in Stereotaxic Coordinates. 2007. Elsevier Academic Press, San Diego.
31. Kamegai J, Minami S, Sugihara H, Higuchi H, Wakabayashi I. Growth hormone induces expression of the c-fos gene on hypothalamic neuropeptide-Y and somatostatin neurons in hypophysectomized rats. Endocrinology. 1994; 135: 2765–2771. PMID:7988469
32. Graham ES, Turnbull Y, Fotheringham P, Nilaweera K, Mercer JG, Morgan PJ, et al. Neuromedin U and Neuromedin U receptor-2 expression in the mouse and rat hypothalamus: effects of nutritional status. J Neurochem. 2003; 87: 1165–1173. PMID:14622096
33. Mercer JG, Moar KM, Ross AW, Hoggard N, Morgan PJ. Photoperiod regulates arcuate nucleus POMC, AGRP, and leptin receptor mRNA in Siberian hamster hypothalamus. Am J Physiol Regul Integr Comp Physiol. 2000; 278: R271–281. PMID:10644649
34. Mercer JG, Lawrence CB, Moar KM, Atkinson T, Barrett P. Short-day weight loss and effect of food dep-rivation on hypothalamic NPY and CRF mRNA in Djungarian hamsters. Am J Physiol. 1997; 273: R768–776. PMID:9277567
35. Barrett P, Ebling FJP, Schuhler S, Wilson D, Ross AW, Warner A, et al. Hypothalamic thyroid hormone catabolism acts as a gatekeeper for the seasonal control of body weight and reproduction. Endocrinolo-gy. 2007; 148: 3608–3617. PMID:17478556
36. Helfer G, Ross AW, Morgan PJ. Neuromedin U partly mimics thyroid stimulating hormone and triggers Wnt/β-Catenin signalling in the photoperiodic response of F344 rats. J Neuroendocrinol. 2013; 25: 1264–1272. doi:10.1111/jne.12116PMID:24164054
37. Sagher FA, Dodge JA, Johnston CF, Shaw C, Buchanan KD, Carr KE. Rat small intestinal morphology and tissue regulatory peptides: effects of high dietary fat. Br J Nutr. 1991; 65: 21–28. PMID:1705145
38. Thomson AB, Keelan M, Clandinin MT, Walker K. Dietary fat selectively alters transport properties of rat jejunum. J Clin Invest. 1986; 77: 279–288. PMID:3944255
39. Olchovsky D, Bruno JF, Wood TL, Gelato MC, Leidy JW, Gilbert JM, et al. Altered pituitary growth hor-mone (GH) regulation in streptozotocin-diabetic rats: a combined defect of hypothalamic somatostatin and GH-releasing factor. Endocrinology. 1990; 126: 53–61. PMID:1967164
40. Considine RV, Sinha MK, Heiman ML, Kriauciunas A, Stephens TW, Nyce MR, et al. Serum immunore-active-leptin concentrations in normal-weight and obese humans. N Engl J Med. 1996; 334: 292–295. PMID:8532024
41. Tuominen JA, Ebeling P, Heiman ML, Stephens T, Koivisto VA. Leptin and thermogenesis in humans. Acta Physiol Scand. 1997; 160: 83–87. PMID:9179315
42. Tuominen JA, Ebeling P, Laquier FW, Heiman ML, Stephens T, Koivisto VA. Serum leptin concentra-tion and fuel homeostasis in healthy man. Eur J Clin Invest. 1997; 27: 206–211. PMID:9088856
43. Carro E, Señaris R, Considine RV, Casanueva FF, Dieguez C. Regulation of in vivo growth hormone secretion by leptin. Endocrinology. 1997; 138: 2203–2206. PMID:9112421
44. Casanueva FF, Villanueva L, Dieguez C, Diaz Y, Cabranes JA, Szoke B, et al. Free fatty acids block growth hormone (GH) releasing hormone-stimulated GH secretion in man directly at the pituitary. J Clin Endocrinol Metab. 1987; 65: 634–642. PMID:2888782
45. Imaki T, Shibasaki T, Masuda A, Hotta M, Yamauchi N, Demura H, et al. The effect of glucose and free fatty acids on growth hormone (GH)-releasing factor-mediated GH secretion in rats. Endocrinology. 1986; 118: 2390–2394. PMID:2870916
46. Pendergast JS, Branecky KL, Yang W, Ellacott KLJ, Niswender KD, Yamazaki S. High-fat diet acutely affects circadian organisation and eating behavior. Eur J Neurosci. 2013; 37: 1350–1356. doi:10.1111/ ejn.12133PMID:23331763
47. Melhorn SJ, Krause EG, Scott KA, Mooney MR, Johnson JD, Woods SC, et al. Acute exposure to a high-fat diet alters meal patterns and body composition. Physiol Behav. 2010; 99: 33–39. doi:10.1016/ j.physbeh.2009.10.004PMID:19835896
49. Baskin DG, Hahn TM, Schwartz MW. Leptin sensitive neurons in the hypothalamus. Horm Metab Res. 1999; 31: 345–350. PMID:10422733
50. Ahima RS, Saper CB, Flier JS, Elmquist JK. Leptin regulation of neuroendocrine systems. Front Neu-roendocrinol. 2000; 21: 263–307. PMID:10882542
51. Barsh GS, Schwartz MW. Genetic approaches to studying energy balance: perception and integration. Nat Rev Genet. 2002; 3: 589–600. PMID:12154382
52. Watanabe M, Yasuo S, Watanabe T, Yamamura T, Nakao N, Ebihara S, et al. Photoperiodic regulation of type 2 deiodinase gene in Djungarian hamster: possible homologies between avian and mammalian photoperiodic regulation of reproduction. Endocrinology. 2004; 145: 1546–1549. PMID:14726436
53. Nakao N, Ono H, Yamamura T, Anraku T, Takagi T, Higashi K, et al. Thyrotrophin in the pars tuberalis triggers photoperiodic response. Nature. 2008; 452: 317–322. doi:10.1038/nature06738PMID: 18354476