Sumiyo Morita1, Takuro Horii1, Mika Kimura1, Yuji Arai2, Yasutomi Kamei3, Yoshihiro Ogawa4, Izuho Hatada1*
1Laboratory of Genome Science, Biosignal Genome Resource Center, Institute for Molecular and Cellular Regulation, Gunma University, Showa-machi Maebashi, Japan, 2Division of Developmental Biotechnology, Department of Bioscience and Genetics, Research Institute, National Cerebral and Cardiovascular Center, Fujishiro-dai, Suita, Osaka, Japan,3Laboratory of Molecular Nutrition, Graduate School of Environmental and Life Science, Kyoto Prefectural University, Hangi-cho, Shimogamo, Sakyo-ku, Kyoto, Japan,4Department of Molecular Endocrinology and Metabolism, Graduate School of Medical and Dental Sciences, Tokyo Medical and Dental University, Bunkyo-ku, Yushima, Tokyo, Japan
Abstract
C57BL/6J (B6) mice are susceptible to high-fat diet (HFD)-induced obesity and have been used in metabolism research for many decades. However, the genetic component of HFD-induced obesity has not yet been elucidated. This study reports evidence for a paternal transmission of HFD-induced obesity and a correlated expression of Igf2 and Peg3 (paternal expressed gene 3) imprinted genes. We found that PWK mice are resistant to HFD-induced obesity compared to C57BL/6J mice. Therefore, we generated and analyzed reciprocal crosses between these mice, namely; (PWK6B6) F1 progeny with B6 father and (B66PWK) F1 progeny with PWK father. The (PWK6B6) F1 mice were more sensitive to diet-induced obesity compared to (B66PWK) F1 mice, suggesting a paternal transmission of diet-induced obesity. Expression analysis of imprinted genes in adipocytes revealed that HFD influences the expression of some of the imprinted genes in adipose tissue in B6 and PWK mice. Interestingly,Igf2and Peg3, which are paternally expressed imprinted genes involved in the regulation of body fat accumulation, were down-regulated in B6 and (PWK6B6) F1 mice, which are susceptible to HFD-induced obesity, but not in PWK and (B66PWK) F1 mice, which are resistant. Furthermore, in vitro analysis showed thatIgf2, but notPeg3, had an anti-inflammatory effect on TNF-a induced MCP-1 expression in adipocytes. Taken together, our findings suggest that the down-regulation ofIgf2andPeg3imprinted genes in adipocytes may be involved in the paternal transmission of HFD-induced obesity.
Citation:Morita S, Horii T, Kimura M, Arai Y, Kamei Y, et al. (2014) Paternal Allele Influences High Fat Diet-Induced Obesity. PLoS ONE 9(1): e85477. doi:10.1371/ journal.pone.0085477
Editor:Raul M. Luque, University of Cordoba, Spain
ReceivedJuly 14, 2013;AcceptedNovember 27, 2013;PublishedJanuary 8, 2014
Copyright:ß2014 Morita et al. This is an open-access article distributed under the terms of the Creative Commons Attribution License, which permits unrestricted use, distribution, and reproduction in any medium, provided the original author and source are credited.
Funding:This work was supported in part by grants from the Ministry of Education, Culture, Sports, Science and Technology of Japan; the Ministry of Health, Labor and Welfare of Japan; the National Institute of Biomedical Innovation; and the Takeda Science Foundation. The funders had no role in study design, data collection and analysis, decision to publish, or preparation of the manuscript.
Competing Interests:The authors have declared that no competing interests exist.
* E-mail: [email protected]
Introduction
In mammals, the maternal and paternal genomes are not functionally equivalent. This is due to a small number of genes called imprinted genes, which exhibit the parental allele-specific expression. There are two types of imprinted genes, namely, paternally expressed genes, in which the paternal allele is expressed and the maternal allele is repressed, and maternally expressed genes, in which the maternal allele is expressed and the paternal allele is repressed.
Several imprinted genes are associated with body weight dysregulation. In humans, genetic disorders affecting imprinted genes lead to obesity. Prader-Willi syndrome (PWS) is a genetic disorder resulting from the loss of expression of a cluster of paternally expressed genes on chromosome 15q11-q13 [1], which leads to obesity. Peg1/Mest is a paternally-expressed gene1/ mesoderm-specific transcript, which promotes adipogenesis and obesity when overexpressed [2,3].Pref1/Dlk1(preadipocyte factor 1/Delta, Drosophila Homolog-like 1) is another paternally expressed gene that is expressed in preadipocytes and inhibits the differentiation of preadipocytes into mature adipocyte [4]. In addition, Pref1/Dlk1-null mice develop adult-onset obesity [5], while mice overexpressingPref1/Dlk1 in adipose tissue develop a
lean phenotype with glucose intolerance [6]. Moreover, Peg3 knockout mice are characterized by increased body fat [7]. Other imprinted genes, such asIgf2,Igf2r, andp57Kip2, may be involved in the regulation of adipocyte growth [8].
Obesity, which is defined as an increase in white adipose tissue (WAT) mass, arises from a complex interaction between genetic and environmental factors. Over the last 30 years, the incidence of obesity has increased rapidly in industrial countries, and has led to an increase in obesity associated metabolic disease, such as type 2 diabetes, and cardiovascular disease. It is therefore crucial that we gain greater understanding of the molecular and genetic mech-anisms governing the development of obesity.
(PWK6B6) F1 mice were more sensitive to dietary obesity
compared to (B66PWK) F1 mice. These results suggested a
paternal transmission of diet-induced obesity.
We analyzed several of the imprinted genes involved in obesity, in adipocytes of mice fed a control diet and mice fed a HFD, and found that the paternal transmission of obesity correlated with the expression of the imprinted genes, Igf2 and Peg3, which might contribute to the symptoms associated with obesity.
Materials and Methods
Ethics Statement
All animal experiments were approved by the Animal Care and Experimentation Committee, Gunma University, Showa Campus, Japan, and were conducted according to the guidelines of this committee.
Animals and Diets
C57BL/6J mice were purchased from Charles River Japan. PWK mice were purchased from RIKEN BioResource Center, Tsukuba, Japan. Mice were housed in box cages, maintained on a 12-h light/12-h dark cycle. C57BL/6J and PWK male mice and F1 male progeny obtained by reciprocal crosses between them were placed into single cages and fed for 15 weeks either a normal diet (Research Diets, New Brunswick, NJ, D06072701) or a HFD (Research Diets, New Brunswick, NJ, D07012601) from 6-weeks-old.
Glucose Tolerance Test
A glucose tolerance test was carried out on animals that had been fasted for 16 h. After determination of fasted glucose levels, each animal received an intraperitoneal (i.p.) injection of 2 g/kg body weight glucose. Blood glucose levels were detected after 30, 60, 90, 120, and 180 min. Areas under the curves (AUCs) for plasma glucose levels (AUCglucose) were calculated using the trapezoidal rule.
Cell Culture
The 3T3-L1 cells were purchased from American Type Culture Collection (Manassas, VA). Cells were grown and maintained in DMEM containing 10% fetal bovine serum. For adipocyte differentiation, cells were treated with standard growth medium described above supplemented with 1.7 M insulin (Sigma), 0.5 uM dexamethasone (Sigma), and 0.8 mM isoobutylmethylxanthine (IBMX, Sigma) for 3 days. After 3 days, the medium was replaced with growth medium supplemented with 1.7 M insulin only. Medium was changed every 2 days. For chronic treatment with TNF-a (3 ng/ml of TNF-a for 72 h), differentiated 3T3-L1 adipocytes (day 7) were starved overnight in 0.5% serum containing media prior to stimulation with TNF-a, and media was replaced with fresh media every 24 h. For down-regulation of Peg3in differentiated 3T3-L1, we transfected siRNA ofPeg3(Gene Solution siRNA, Qiagen) into differentiated 3T3-L1 (day 4) using Lipofectoamine 2000 (Invitrogen). After 2 days of transfection, cells were collected and subjected to total RNA preparation using Trizol (Invitrogen). To overexpress Peg3in 3T3-L1 cells, mouse
Peg3 cDNA was inserted into the pcDNATM 3.1 Directional
TOPO Expression vector (Invitrogen) using PCR with primers designed to amplify the open reading frame ofPeg3. Cells were transfected using Lipofectamine 2000 (Invitrogen). As a control, the expression vector withoutPeg3cDNA was transfected. Stably transfected cells were selected using G418 (800 mg/mL) prior to experimental analysis.
2-Deoxyglucose uptake Assay
Differentiated 3T3-L1 adipocytes were starved in low-glucose DMEM with 0.5% serum overnight prior to insulin stimulation. 2-Deoxyglucose uptake assays were performed with 2-2-Deoxyglucose (2DG) Uptake Measurement Kit (Cosmo Bio, Japan).
Quantitative RT-PCR Analysis
Total RNA was prepared from isolated tissues using the Allprep DNA/RNA mini kit (Qiagen). Gene expression levels were measured with LightCycler 480 (Roche) using the SYBR Premix Ex Taq (TAKARA) according to the manufacturer’s instructions. Expression levels were normalized against the level of 18S ribosomal RNA. Primer sequences were as follows:
Igf2: 59-TGACACGCTTCAGTTTGTCTG-39,
59-AAGCAG-CACTCTTCCACGAT-39
Peg1: 59-GGCCTACGCATCTTCTACCA-39, 59
-TGGATGTTGGAAAGCCATGT-39,
Peg3: 59-AGCCGAAGTGGGAGAGAAAC-39, 59
-TCTCGAGGCTCCACATCTCT-39
Dlk1: 59-TGTGACCCCCAGTATGGATT-39,
59-CCAGGGGCAGTTACACACTT-39
Zac1: 59-AGTGCTCGAAGGCTGAGTGT-39, 59
-TCTGGAGGTGGTTCTTCAGG-39
Grb10: 59-CAGGACTCAGCATTGGTTCC-39,
59-CAG-TACGAACGCCTTTGGAT-39
MCP1: 59-AGCACCAGCCAACTCTCACT-39, 59
-CGTTAACTGCATCTGGCTGA-39
Glut4:59-CTGTCGCTGGTTTCTCCAAC-39, 59
-CAGGAG-GACGGCAAATAGAA-39
Adiponectin: 59-GATGGCACTCCTGGAGAGAA-39,
59-GCTTCTCCAGGCTCTCCTTT-39
18s: 59-CCCGAAGCGTTTACTTTGAA-39, 59
-CCCTCTTAATCATGGCCTCA-39.
Bisulfite DNA Methylation Analysis
Genomic DNA of isolated tissues was prepared using the Allprep DNA/RNA mini kit (Qiagen), and treated with the Epitect Plus DNA Bisulfite Kit (Qiagen) according to the manufacturer’s instruction. The modified DNA was amplified with the primer as follows:
Peg3: 59-ATTTTGTTTGGGGGTTTTTAATATT-39,
59-CCTATCACCTAAATAACATCCCTAC-39.
Igf2: DMR1-F 59
-TTTTTATTTTTGGTTTTTTTGGTTTT-39, DMR1-R
59-ACTACCCTCTCAAATACCCCTTAAA-39, DMR2-F1
59-TTGGAGAGGAGGTGTTAGTTAGTAG-39, DMR2-R1 59
-AAAAATAATTCCTTCTTCAACCTTC-39 DMR2-F2 59
-TTTATTGATGGTTGTTGGATATTTT-39, DMR2-R2
59-CTAACTAACACCTCCTCTCCAAAAC-39 H19-DMR-F 59
-TATAGGGGTGGTAAGATGTGTGTATT-39, H19-DMR-R
59-CTTAAAAAATCCCAAAACAAAAAAA-39.
The amplified fragments were ligated into the TOPO vector (Invitrogen) and sequenced.
Statistical Analysis
Student’s t-test was used for single comparisons and ANOVA was used for multiple comparisons.
Results
The Paternal Allele Influences Body Weight Gain
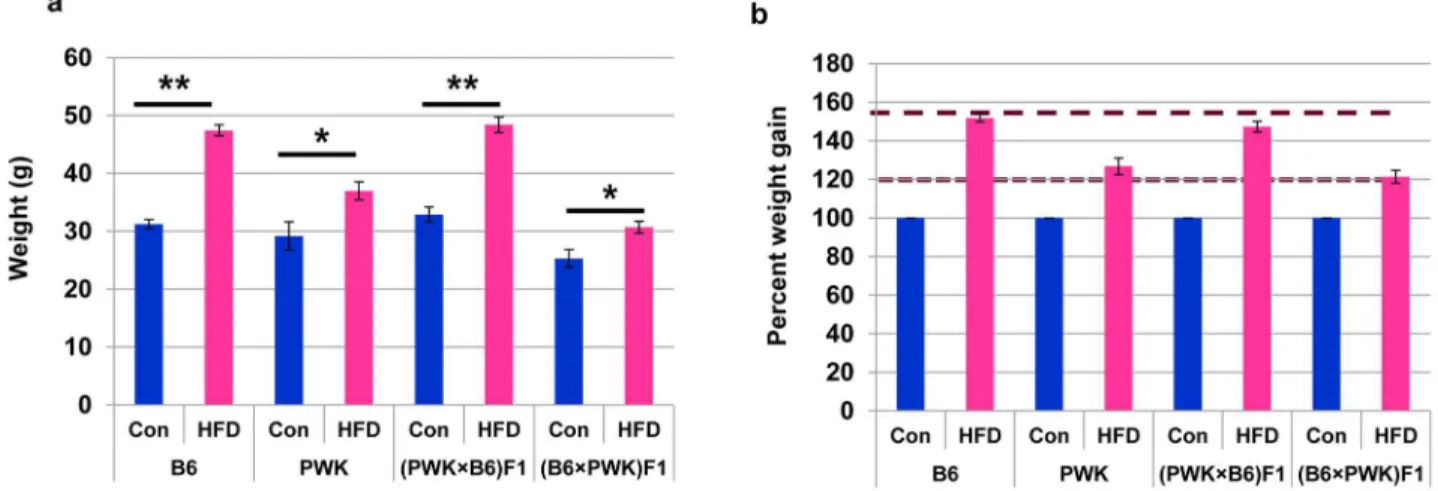
weight of B6 mice fed the HFD was approximately 50% higher compared to B6 mice fed the control diet, while PWK mice fed the HFD was only 20% heavier compared to PWK mice fed the control diet (Fig. 1a, b), suggesting that B6 mice are more susceptible to obesity than PWK mice. HFD also resulted in approximately 50% higher body weight gain in (PWK6B6) F1 mice, compared to the same mice fed the control diet (Fig. 1a, b).
By contrast, (B66PWK) F1 mice fed the HFD had only 20%
heavier body weight gain compared to the same mice fed the control diet. Thus, F1 mice with B6 father gain more weight than those having PWK father, suggesting that paternally inherited factors influence the HFD-induced obesity in B6 mice.
Glucose Tolerance is Linked with the Paternal Allele
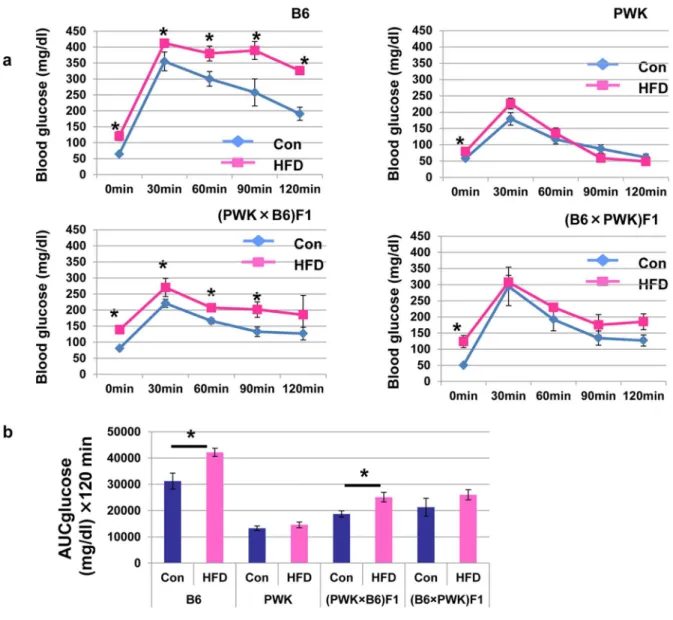
B6 mice fed a HFD showed impaired glucose tolerance compared to those fed a control diet (Fig. 2a). By contrast, PWK mice fed a HFD showed normal glucose tolerance similar to mice fed a control diet. (PWK6B6) F1 mice fed a HFD showed impaired glucose tolerance compared to the same mice fed a
control diet, while (B66PWK) F1 mice fed a HFD showed a
normal glucose tolerance. This was also illustrated by measure-ment of AUCglucose (Fig. 2b). These data suggest that impaired glucose tolerance induced with a HFD is dependent on the paternal allele, the same as for obesity.
High-fat Diet Alters the Expression of Imprinted Genes in WAT
Several imprinted genes have been associated with the development of obesity through effects on adipocyte differentiation and function. Therefore, we analyzed the expression of seven imprinted genes, which could be involved in adipocyte differen-tiation and insulin signaling, in WAT of the parental strains B6 and PWK (Fig. 3a). In B6 mice,Igf2rexpression was increased in WAT of diet-induced obese mice. By contrast, the expression of Peg3,Igf2,Zac1 and Grb10was significantly decreased in WAT of diet-induced obese B6 mice. In PWK mice,Igf2rexpression was unchanged in WAT of diet-induced obese mice and control mice, and Zac1and Grb10 expressions was decreased in WAT of diet-induced obese mice compared to control mice, similar to B6 mice, although the expression ofPeg3andIgf2was not affected in WAT of obese PWK mice. Therefore, the down-regulation ofPeg3and Igf2 and up-regulation ofIgf2r in adipocytes from HFD-induced
obesity mice is specific to B6 mice. Changes in the expression of other imprinted genes were observed in both B6 and PWK mice. To clarify whether the down-regulation of these paternally expressed imprinted genes is dependent on the B6 allele, we further analyzed the expression of Peg3 and Igf2, which are paternally expressed genes, and Igf2r, which is maternally expressed gene, in (PWK6B6) F1 mice and (B66PWK) F1 mice
(Fig. 3b). In (PWK6B6) F1 mice, HFD down-regulates the
expression ofPeg3and Igf2, while in (B66PWK) F1 mice, HFD does not alter the expression of Peg3 and Igf2. However, Igf2r expression was not altered in both (PWK6B6) F1 and (B66PWK) F1 mice. Therefore, the down-regulation of the paternally expressed genes, Peg3 and Igf2, occurs only in the F1 offspring with B6 father.
High Fat Diets Induce Down-regulation of Peg3 and Igf2 in WAT, which is not Caused by Alteration of DNA Methylation Status in the Differentially Methylated Region (DMR)
Peg3andIgf2were down-regulated in WAT of B6 obese mice, and therefore we examined the DNA methylation status of the Peg3andIgf2DMR [11,12,13] in WAT of B6 mice fed a control diet and mice fed a HFD, using the bisulfite sequencing method. As shown in Fig. 4 (a, b), there was no significant difference in the DNA methylation status in the DMR ofPeg3andIgf2, suggesting thatPeg3andIgf2 down-regulation in WAT of B6 obese mice is not caused by alterations of DNA methylation in their DMRs. We also examined the DNA methylation statuses of thePeg3andIgf2 DMRs in WAT of PWK mice fed a control diet or a HFD. As expected, there was also no significant difference in the DNA methylation status of the DMRs ofPeg3orIgf2(Fig. 4a, b).
Igf2 Protects Adipocytes from the Inflammatory Effect of TNF-a
Recent studies suggest that obesity is closely associated with chronic, low-grade inflammation in adipose tissue [14,15]. Accumulation of adipose tissue macrophages in adipose tissue has been linked to increasing body weight, adipose tissue inflammation and insulin sensitivity. Monocyte chemoattractant protein (MCP)-1, which is expressed in macrophages, is also expressed in adipose tissues. Adipocyte-derived MCP-1 induces macrophage migration into adipose tissue and stimulates the
Figure 1. Body weight changes in B6, PWK, and the progeny of their reciprocal crosses.(a) Body weight of B6, PWK, (PWK6B6) F1 and
(B66PWK) F1 mice fed normal chow and HFD for 15w. (b) Comparison of body weight normalized to mice fed normal chow. *P#0.05, **P#0.01.
secretion of inflammatory cytokines including TNF-a, which ultimately leads to adipocyte dysfunction [16]. In addition, MCP-1 inhibits insulin-dependent glucose uptake, and MCP-1-deficient mice lack insulin resistance [17]. Adiponectin is also expressed in adipose tissue and modulates several metabolic processes that
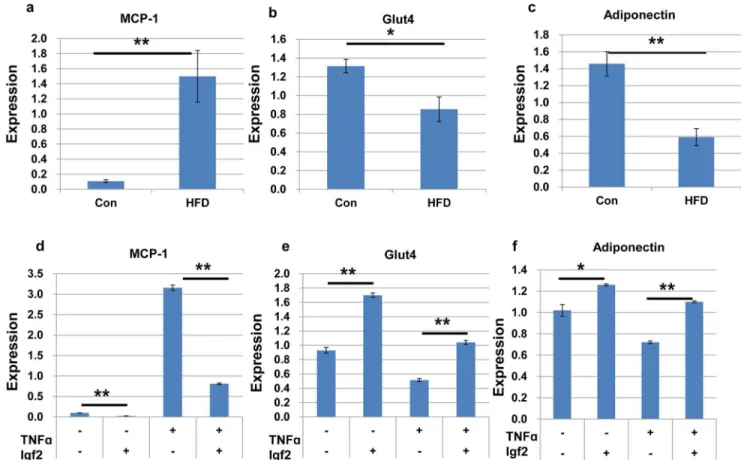
regulate glucose [18]. In WAT, MCP-1expression was much
higher, andGlut4andadiponectinexpression was lower in B6 mice fed a HFD than in B6 mice fed a control diet (Fig. 5a, b, c). Therefore we tested whether changes in the expression ofIgf2and Peg3have an effect on adipose tissue inflammation using 3T3-L1 cells. First, we analyzed the effect of Igf2 on the expression of MCP-1. Igf2 protein treatment for 72 h decreased MCP-1 expression in differentiated 3T3-L1 adipocytes (Fig. 5d). Further-more, low-dose TNF-a (3 ng/ml for 72 h) treatment of differen-tiated 3T3-L1 adipocytes, in the presence of Igf2, also repressed the expression ofMCP-1(Fig. 5d). We next examined the effect of Igf2 on insulin signaling in adipocytes. Igf2 treatment up-regulated Glut4expression in adipocytes, alone, as well as in the presence of TNF-a (Fig. 5e). In addition, Igf2 treatment up-regulated adiponectin expression in adipocytes (Fig. 5f). These results
suggest that Igf2 has an anti-inflammatory effect on TNF-a -inducedMCP-1,Glut4, andadiponectinexpression in adipocytes.
We also analyzed the effect of down-regulation and
up-regulation of Peg3 on the expression of MCP-1, Glut4 and
adiponectin in differentiated 3T3-L1 adipocytes. However, the down-regulation or up-regulation of Peg3 had no effect on the expression ofMCP-1,Glut4, oradiponectin(data not shown).
Igf2 Affects Glucose uptake in Adipocyte
Obesity leads to an increase in TNF-a expression in WAT, which ultimately leads to adipocyte dysfunction [16]. To determine whether Igf2 protects the adipocytes from the physiological effects of TNF-a, we analyzed insulin-stimulated glucose uptake in 3T3-L1 adipocytes in the presence of TNF-a with or without Igf2 treatment. As shown in Fig. 6, Igf2 treatment increased the insulin-stimulated glucose uptake in the presence or absence of TNF-a. These findings imply that down-regulation of Igf2 in adipocytes from HFD-induced obesity mice may result in inflammation and down-regulation of glucose uptake.
Figure 2. Effect of diet on glucose tolerance in B6, PWK, (PWK6B6) F1 and (B66PWK) F1.(a) Glucose tolerance tests were performed after
an overnight fast in B6, PWK, (PWK6B6) F1 and (B66PWK) F1 fed normal chow and HFD. *P#0.05. (b) AUC-glucose represents the total clearance of
Glut4 Expression in Muscle is Higher in PWK Mice than in B6 Mice
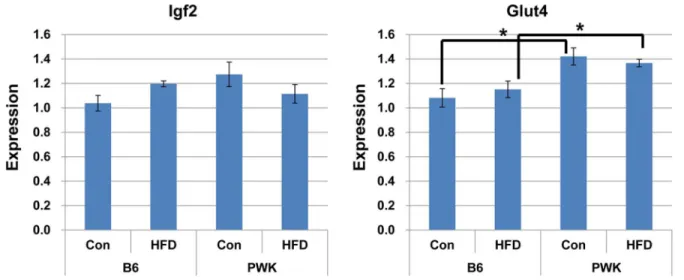
Muscle is a major tissue that affects glucose clearance andIgf2 increases glucose uptake into muscle [19,20]. We analyzed Igf2 expression in muscle of B6 and PWK mice fed a control diet or a HFD (Fig. 7). In contrast to WAT,Igf2 and Glut4 expression in muscle did not differ between mice fed a control diet and mice fed a HFD. However,Glut4expression in muscle was higher in PWK mice than in B6 mice.
Discussion
In this study, we report evidence for paternal transmission of HFD-induced obesity, which correlated with the expression of
Peg3 and Igf2 imprinted genes. We found that PWK mice are
resistant to HFD-induced obesity compared to C57BL/6J (B6) mice. Using the reciprocal crosses between these mice, we found that (PWK6B6) F1 mice are more sensitive to dietary obesity compared to (B66PWK) F1 mice, suggesting a paternal transmis-sion of diet-induced obesity. One way by which paternal transmission might occur is genomic imprinting.
Our findings suggest that down-regulation ofPeg3andIgf2 in adipocytes contributes to diet-induced obesity and the symptoms associated with obesity. Several imprinted genes are associated
with body weight dysregulation, and we found thatPeg3andIgf2 might be involved in the paternal transmission of propensity to diet-induced obesity. Peg3 is a paternally expressed gene and previous reports have shown that targeted mutation ofPeg3results in increased body fat in mice [7]. In addition,Peg3is a candidate gene for the regulation of intramuscular fat content in pigs [21], suggesting its involvement in adipocyte differentiation.Igf2is also a paternally expressed gene and Igf2-deficient mice are severely growth retarded [22]. Igf2 acts as part of the IGF signaling pathway to regulate postnatal growth, and decreased expression of Igf2is associated with increased fat mass in a mouse model [23]. In adult humans, lower circulating IGF2 levels have been associated with an increased risk of weight gain and obesity [24]. In addition, several studies have reported the correlation between Igf2 genotype and obesity in humans [25,26].
In addition to fat gain,Peg3andIgf2might also contribute to the symptoms associated with obesity. Chronic low-grade inflamma-tion in adipose tissue is an important feature of obesity and type 2 diabetes. In WAT,MCP-1expression was much higher, andGlut4 andadiponectinexpression was lower in B6 mice fed a HFD than in B6 mice fed a control diet.MCP-1 stimulates the secretion of inflammatory cytokines including TNF-a, and ultimately leads to adipocyte dysfunction. Adiponectin is an anti-inflammatory cytokine and enhances insulin action by reducing ectopic fat Figure 3. Expression of imprinted genes in adipose tissue.(a) Expression of imprinted genes in adipose tissue of B6 and PWK mice fed control diet and HFD. *P#0.05, **P#0.01. (b) Expression ofPeg3,Igf2, andIgf2rin adipose tissue of (PWK6B6) F1 and (B66PWK) F1 mice fed control diet and
HFD. *P#0.05, **P#0.01.
deposition [27], and a low level of circulating adiponectin is closely associated with type2 diabetes [28]. We therefore analyzed the effect of expression changes of the paternal imprinted genes,Peg3 andIgf2, in in vitro studies using differentiated 3T3-L1 cells. We demonstrated that Igf2 effectively inhibited TNF-a-induced
increase of MCP-1 expression in 3T3-L1 adipocytes and
up-regulated Glut4and adiponectintranscription. In addition, we also showed that Igf2 increased the insulin-stimulated glucose uptake in 3T3-L1 adipocytes together with a low-dose TNF-a treatment. These results suggest that Igf2 has an anti-inflammatory effect and enhances glucose metabolism. However, we did not detect an effect ofPeg3down-regulation or up-regulation on the expression of MCP-1, Glut4, or adiponectin. Further studies are needed to understand the effect ofPeg3on chronic low-grade inflammation. The glucose tolerances of B6 and PWK mice fed a control diet drastically differed. In B6 mice, a HFD is associated with glucose tolerance due to changes in insulin sensitivity and insulin secretion [29,30,31,32]. The difference in glucose clearance between B6 and PWK mice might be due to a difference in insulin secretion or insulin sensitivity. One possible factor is the serum adipokine concentration. Adipose tissue produces and secretes adipokines such as adiponectin [33], and adiponectin has insulin-sensitizing and glucose-clearing effects [34,35]. A high serum concentration of adiponectin might contribute to the enhanced glucose clearance
and insulin sensitivity of PWK mice compared to B6 mice.Glut4 expression in muscle was higher in PWK mice than in B6 mice, suggesting that the efficiency of glucose uptake by muscle was higher in PWK mice than in B6 mice. This could also explain the difference in glucose clearance between PWK and B6 mice. Additional studies are required to determine the mechanism underlying the enhanced glucose clearance of PWK mice compared to B6 mice.
Down-regulationof Peg3andIgf2in adipocytes could contribute to diet-induced obesity and the symptoms associated with obesity. However, our findings raise an interesting question of whyPeg3 andIgf2are down-regulated in the adipose tissue of HFD-induced obese B6 mice and not in HFD-induced obese PWK mice, which will be the focus of future studies in our laboratory.
Most imprinted genes have one or more regions in which the maternal or the paternal alleles are differentially methylated, and the DNA methylation states are associated with the expression of imprinted genes.Peg3 and Igf2, like other imprinted genes, are
regulated by DMR. We found that Peg3 and Igf2 are
down-regulated in adipocytes of diet-induced obese B6 mice compared to control mice. However, the DNA methylation of the imprinting control region ofPeg3and Igf2was not changed, indicating that DNA methylation is not involved in the expression changes of these genes. We are now investigating the mechanism of down-Figure 4. The DNA methylation status of thePeg3andIgf2DMR.Analysis ofPeg3(a) andIgf2(b) DMR were performed by bisulfite sequencing in B6 and PWK mice fed with control diet and HFD. Methylated and unmethylated CpG sites are indicated by closed and open circles, respectively. Percentages of methylated CpG sites are indicated in parentheses.
regulation ofPeg3andIgf2in obese B6 mice. Understanding this mechanism will facilitate the development of novel approaches to the treatment of obesity.
The expression of other imprinted genes,Zac1andGrb10,was significantly reduced in WAT of diet-induced obese B6 and PWK mice. Expression ofZac1in WAT was much higher in PWK mice than in B6 mice. Zac1 is a paternally expressed gene that up-regulates Igf2 expression through binding to a shared enhancer
[36]. The mechanism underlying down-regulation of Zac1 in
WAT of diet-induced obese B6 and PWK mice is unclear; however, the difference inZac1expression between B6 and PWK mice might affectIgf2expression.
Grb10is a maternally expressed imprinted gene and can interact with a variety of receptor tyrosine kinases, including the insulin receptor [37]. The functional role of Grb10 in insulin signaling is controversial. Some experiments have indicated that Grb10 is a positive regulator of insulin signaling, while others have indicated that Grb10 inhibits insulin action [37]. In addition, mice in which Grb10is disrupted exhibit reduced adiposity [38]. The mechanisms underlying down-regulation of Grb10 in WAT of diet-induced obese B6 and PWK mice, and the higher expression ofGrb10 in B6 mice fed a control diet than in PWK mice fed a control diet are unknown. Expression of Dlk1, which is a paternally expressed imprinted gene, varied widely in WAT of B6 and PWK mice; therefore, there was no statistically significant difference between the strains.
In conclusion, we report that HFD-induced obesity is paternally transmitted and is correlated with expression of thePeg3andIgf2 imprinted genes, and that down-regulation of Peg3 and Igf2 in adipocytes can contribute to diet-induced obesity and the symptoms associated with obesity. These findings suggest that Peg3andIgf2 improve obesity and glucose metabolosm in mice fed a HFD.
Figure 5. The effect of Igf2 on the expression ofMCP-1,Glut4andadiponectin. Expression ofMCP-1(a,Glut4(b), andadiponectin(c) in WAT of B6 mice fed a control diet or a HFD.Expression ofMCP-1(d),Glut4(e), andadiponectin(f) in the presence of Igf2 and TNF-awere
analyzed in differentiated 3T3-L1 adipocytes treated with TNF-a(3 ng/ml) for 72 h in the presence or absence of Igf2 (400 ng/ml). *P#0.05, **P#0.01.
doi:10.1371/journal.pone.0085477.g005
Figure 6. Insulin-stimulated glucose uptake in differentiated 3T3-L1 adipocytes. Differentiated 3T3-L1 adipocytes were treated with or without TNF-a(3 ng/ml) for 72 h in the presence or absence of
Igf2 (400 ng/ml). *P#0.05.
Author Contributions
Conceived and designed the experiments: SM IH. Performed the experiments: SM TH MK YA. Analyzed the data: SM. Contributed
reagents/materials/analysis tools: SM TH MK YA YK YO IH. Wrote the paper: SM.
References
1. Nicholls RD, Knepper JL (2001) Genome organization, function, and imprinting in Prader-Willi and Angelman syndromes. Annu Rev Genomics Hum Genet 2: 153–175.
2. Takahashi M, Kamei Y, Ezaki O (2005) Mest/Peg1 imprinted gene enlarges adipocytes and is a marker of adipocyte size. Am J Physiol Endocrinol Metab 28: E117–E124.
3. Koza RA, Nikonova L, Hogan J, Rim JS, Mendoza T, et al. (2006) Changes in gene expression foreshadow diet-induced obesity in genetically identical mice. PLoS Genet 2: e81.
4. Smas CM, Sul HS (1996) Characterization of Pref-1 and its inhibitory role in adipocyte differentiation. Int J Obes Relat Metab Disord 20 (Suppl 3): S65–72. 5. Moon YS, Smas CM, Lee K, Villena JA, Kim KH, et al. (2002) Mice lacking paternally expressed Pref-1/Dlk1 display growth retardation and accelerated adiposity. Mol Cell Biol 22: 5585–5592.
6. Lee K, Villena JA, Moon YS, Kim KH, Lee S, et al. (2003) Inhibition of adipogenesis and development of glucose intolerance by soluble preadipocyte factor-1 (Pref-1). J Clin Invest111: 453–461.
7. Curley JP, Pinnock SB, Dickson SL, Thresher R, Miyoshi N, et al. (2005) Increased body fat in mice with a targeted mutation of paternally expressed imprinted gene Peg3. FASEB J 19: 1302–1304.
8. LaBaer J, Garrett MD, Stevenson LF, Slingerland JM, Sandhu C, et al. (1997) New functional activities for the p21 family of CDK inhibitors. Genes Dev. 11: 847–862.
9. Surwit RS, Kuhn CM, Cochrane C, Mccubbin JA, Feinglos MN (1988) Diet-induced Type II diabetes in C57BL/6J mice. Diabetes 37: 1163–1167. 10. Alexander J, Chang GQ, Dourmashkin JT, Leibowitz SF (2006) Distinct
phenotypes of obesity-prone AKR/J, DBA2J and C57BL/6J mice compared to control strains. Int J Obes (Lond). 30: 50–59.
11. Lucifero D, Mertineit C, Clarke HJ, Bestor TH, Trasler JM (2002) Methylaion dynamics of imprinted genes in mouse germ cells. Genomics. 79: 530–538. 12. Feil R, Walter J, Allen ND, Reik W (1994) Developmental control of allelic
methylation in the imprinted mouse Igf2 and H19 genes. Development 120: 2933–2943.
13. Tremblay KD, Duran KL, Bartolomei MS (1997) A 5’ 2-kilobase-pair region of the imprinted mouse H19 gene exhibits exclusive paternal methylation throughout development. Mol Cell Biol. 17: 4322–4329.
14. Cinti S, Mitchell G, Barbatelli G, Murano I, Ceresi E, et al. (2005) Adipocyte death defines macrophage localization and function in adipose tissue of obese mice and humans. J Lipid Res. 46: 2347–55.
15. Shoelson SE, Lee J, Goldfine AB (2006) Inflammation and insulin resistance. J Clin Invest. 116: 1793–801.
16. De Taeye BM, Novitskaya T, McGuinness OP, Gleaves L, Medda M, et al. (2007) Macrophage TNF-acontributes to insulin resistance and hepatic steatosis
in diet-induced obesity. Am J Physiol Endocrinol Metab. 293: E713–725. 17. Sartipy P, Loskutoff DJ (2003) Monocyte chemoattractant protein 1 in obesity
and insulin resistance. Proc Natl Acad Sci U S A. 100: 7265–7270.
18. Dı´ez JJ, Iglesias P (2003) The role of the novel adipocyte-derived hormone adiponectin in human disease. Eur J Endocrinol. 148: 293–300.
19. Rogler CE, Yang D, Rossetti L, Donohoe J, Alt E, et al. (1994) Altered body composition and increased frequency of diverse malignancies in insulin-like growth factor-II transgenic mice. J Biol Chem. 269: 13779–84.
20. Rossetti L, Barzilai N, Chen W, Harris T, Yang D, et al. (1996) Hepatic overexpression of insulin-like growth factor-II in adulthood increases basal and insulin-stimulated glucose disposal in conscious mice. J Biol Chem. 271: 203–8. 21. de Koning DJ, Rattink AP, Harlizius B, van Arendonk JA, Brascamp EW, et al. (2002) Genome-wide scan for body composition in pigs reveals important role of imprinting. Proc Natl Acad Sci U S A. 97: 7947–7950.
22. DeChiara TM, Efstratiadis A, Robertson EJ (1990) A growth-deficiency phenotype in heterozygous mice carrying an insulin-like growth factor II gene disrupted by targeting. Nature. 345: 78–80.
23. Jones BK, Levorse J, Tilghman SM (2001) Deletion of a nuclease-sensitive region between the Igf2 and H19 genes leads to Igf2 misregulation and increased adiposity. Hum Mol Genet. 10: 807–814.
24. Sandhu MS, Gibson JM, Heald AH, Dunger DB, Wareham NJ (2003) Low circulating IGF-II concentrations predict weight gain and obesity in humans. Diabetes. 52: 1403–1408.
25. O’Dell SD, Bujac SR, Miller GJ, Day IN (1999) Associations of IGF2 ApaI RFLP and INS VNTR class I allele size with obesity. Eur J Hum Genet. 7: 821– 827.
26. Gaunt TR, Cooper JA, Miller GJ, Day IN, O’Dell SD (2001) Positive associations between single nucleotide polymorphisms in the IGF2 gene region and body mass index in adult males. Hum Mol Genet. 10: 1491–1501. 27. Ravussin E (2002) Adiponectin enhances insulin action by decreasing ectopic fat
deposition. Pharmacogenomics J. 2: 4–7.
28. Matsuzawa Y (2010) Adiponectin: a key player in obesity related disorders. Curr Pharm Des. 16: 1896–901.
29. Toye AA, Lippiat JD, Proks P, Shimomura K, Bentley L, et al. (2005) A genetic and physiological study of impaired glucose homeostasis control in C57BL/6J mice. Diabetologia. 48: 675–86.
30. Andrikopoulos S, Massa CM, Aston-Mourney K, Funkat A, Fam BC, et al. (2005) Differential effect of inbred mouse strain (C57BL/6, DBA/2, 129T2) on insulin secretory function in response to a high fat diet. J Endocrinol. 187: 45– 53.
31. Kooptiwut S, Zraika S, Thorburn AW, Dunlop ME, Darwiche R, et al. (2002) Comparison of insulin secretory function in two mouse models with different susceptibility to beta-cell failure. Endocrinology. 143: 2085–92.
32. Ahre´n B, Pacini G (2002) Insufficient islet compensation to insulin resistance vs. reduced glucose effectiveness in glucose-intolerant mice. Am J Physiol Endocrinol Metab. 283: E738–44.
33. Piya MK, McTernan PG, Kumar S (2013) Adipokine inflammation and insulin resistance: the role of glucose, lipids and endotoxin. J Endocrinol. 216: T1–T15. 34. Berg AH, Combs TP, Du X, Brownlee M, Scherer PE (2001) The adipocyte-secreted protein Acrp30 enhances hepatic insulin action. Nat Med. 7: 947–53. Figure 7.Igf2andGlut4expression in muscle of B6 and PWK mice fed a control diet or a HFD.*P#0.05.
35. Yamauchi T, Kamon J, Waki H, Terauchi Y, Kubota N, et al. (2001) The fat-derived hormone adiponectin reverses insulin resistance associated with both lipoatrophy and obesity. Nat Med. 7: 941–946.
36. Varrault A, Gueydan C, Delalbre A, Bellmann A, Houssami S, et al. (2006) Zac1 regulates an imprinted gene network critically involved in the control of embryonic growth. Dev Cell. 11: 711–22.
37. Holt LJ, Siddle K (2005) Grb10 and Grb14: enigmatic regulators of insulin action-and more? Biochem J. 388(Pt 2): 393–406.