Submitted7 July 2016 Accepted 28 November 2016 Published2 January 2017 Corresponding author Jennifer Lu, jlu26@jhmi.edu
Academic editor James Procter
Additional Information and Declarations can be found on page 13
DOI10.7717/peerj-cs.104 Copyright
2017 Lu et al.
Distributed under
Creative Commons CC-BY 4.0
OPEN ACCESS
Bracken: estimating species abundance in
metagenomics data
Jennifer Lu1,2, Florian P. Breitwieser2, Peter Thielen3and Steven L. Salzberg1,2,4
1Department of Biomedical Engineering, Johns Hopkins University, Baltimore, MD, United States
2Center for Computational Biology, McKusick-Nathans Institute of Genetic Medicine, Johns Hopkins School
of Medicine, Baltimore, MD, United States
3Applied Physics Laboratory, Johns Hopkins University, Laurel, MD, United States
4Departments of Computer Science and Biostatistics, Johns Hopkins University, Baltimore, MD, United States
ABSTRACT
Metagenomic experiments attempt to characterize microbial communities using high-throughput DNA sequencing. Identification of the microorganisms in a sample provides information about the genetic profile, population structure, and role of microorganisms within an environment. Until recently, most metagenomics studies focused on high-level characterization at the level of phyla, or alternatively sequenced the 16S ribosomal RNA gene that is present in bacterial species. As the cost of sequencing has fallen, though, metagenomics experiments have increasingly used unbiased shotgun sequencing to capture all the organisms in a sample. This approach requires a method for estimating abundance directly from the raw read data. Here we describe a fast, accurate new method that computes the abundance at the species level using the reads collected in a metagenomics experiment. Bracken (Bayesian Reestimation of Abundance after Classification with KrakEN) uses the taxonomic assignments made by Kraken, a very fast read-level classifier, along with information about the genomes themselves to estimate abundance at the species level, the genus level, or above. We demonstrate that Bracken can produce accurate species- and genus-level abundance estimates even when a sample contains multiple near-identical species.
SubjectsBioinformatics, Computational Biology
Keywords Metagenomics, Species abundance, Microbiome, Bayesian estimation
INTRODUCTION
with a DNA-based genome, including eukaryotes that lack a 16S rRNA gene. Because it is unbiased, shotgun sequencing can also be used to estimate the abundance of each taxon (species, genus, phylum, etc.) in the original sample, by counting the number of reads belonging to each taxon.
Along with the technological advances, the number of finished and draft genomes has also grown exponentially over the past decade. At present there are thousands of complete bacterial genomes, 20,000 draft bacterial genomes, and 80,000 full or partial virus genomes in the public GenBank archive (Benson et al., 2015). This rich resource of sequenced genomes now makes it possible to sequence uncultured, unprocessed microbial DNA from almost any environment, ranging from soil to the deep ocean to the human body, and use computational sequence comparisons to identify many of the formerly hidden species in these environments (Riesenfeld, Schloss & Handelsman, 2004). Several accurate methods have appeared that can align a sequence ‘‘read’’ to a database of microbial genomes rapidly and accurately (see below), but this step alone is not sufficient to estimate how much of a species is present. Complications arise when closely related species are present in the same sample–a situation that arises quite frequently–because many reads align equally well to more than one species. This requires a separate abundance estimation algorithm to resolve. In this paper, we describe a new method, Bracken, that goes beyond simply classifying individual reads and computes the abundance of species, genera, or other taxonomic categories from the DNA sequences collected in a metagenomics experiment.
When it was first published in 2014, the Kraken metagenomics classifier represented a major enhancement in the speed with which large metagenomics sequence data could be processed (Wood & Salzberg, 2014), running over 900 times faster than MegaBlast (Morgulis et al., 2008), the closest competitor at the time. Kraken’s success and accuracy rely on its use of a very large, efficient index of short sequences of lengthk, which it builds into a specialized database. Ifkis chosen appropriately, then most sequences of lengthkin the database will be unique to a single species, and many will also be unique to a particular strain or genome. Larger values ofk will yield a database in which even more of each genome is uniquely covered byk-mers; obviously, though,kshould not be longer than the length of a sequencing read, and metagenomics projects currently generate reads as short as 75–100 base pairs (bp). Longerk-mers are also more likely to contain errors, meaning that more reads will be left unclassified ifk is too long. Smallerk-mers, in contrast, will yield higher sensitivity because the minimum match length is shorter.
Ambiguity among microbial species and strains
As the database of bacterial genomes has grown, an increasing number of genomes share large portions of their sequence with other genomes. In many cases, these genomes are nearly identical; indeed, sequencing has revealed to scientists that many formerly distinct species and genera are far closer than were known prior to sequencing. Many species have been renamed as a result, in a process that is continual and ongoing, but many other species have retained their old names, often for historical or other reasons.
For example, the speciesMycobacterium bovisis over 99.95% identical toMycobacterium tuberculosis(Garnier et al., 2003), and many cases of human tuberculosis are caused by M. bovis(which also infects cows) rather thanM. tuberculosis(Grange, 2001). Their high sequence identity indicates that they should be considered as two strains of a single species, but they retain different species names. As a compromise, taxonomists have created the categoryMycobacterium tuberculosis complex(Brosch et al., 2002) to represent a collection of taxa that now includes more than 100 strains of five different species. This category sits above the species level but below the genus level in the current microbial taxonomy, but it can best be described as a species.
Other examples are numerous and still growing. The three speciesBacillus anthracis(the causative agent of anthrax), Bacillus cereus, andBacillus thuringiensis are well over 99% identical and should all be designated as a single species (Helgason et al., 2000), although their names have not been changed despite their near-identity revealed by sequencing. As a compromise, taxonomists created the categoryBacillus cereus group, between the level of species and genus, to include these three species and at least five others (Liu et al., 2015), all of which are extremely similar to one another. In some cases, two organisms that should be called the same species may even have different genus names. For example,Escherichia coli andShigella flexneriare classified in different genera, but we know from sequence analysis that they represent the same species (Lan & Reeves, 2002).
Failure to recognize the mutability of the bacterial taxonomy can lead to erroneous conclusions about the performance of metagenomic classifiers. For example, one recent study (Peabody et al., 2015) created a mock community of 11 species, one of which was Anabaena variabilisATCC 29413, not realizing that this genome had been renamed and was synonymous with species in the genusNostoc(Thiel et al., 2014). WhenAnabaenawas removed from the database, Kraken correctly identified the reads asNostoc, but Peabody et al. erroneously considered all these reads to be misclassified.
Classification versus abundance estimation
assignments for reads from unique regions, and a true indication of total abundance can only be made by taking both species and genus (or higher) level assignments into account. This implies that for some species, the majority of reads might be classified at a higher level of the taxonomy. Kraken thus leaves many reads ‘‘stranded’’ above the species level, meaning that the number of reads classified directly to a species may be far lower than the actual number present.
Therefore, any assumption that Kraken’s raw read assignments can be directly translated into species- or strain-level abundance estimates (e.g., Schaeffer et al., 2015) is flawed, as ignoring reads at higher levels of the taxonomy will grossly underestimate some species, and creates the erroneous impression that Kraken’s assignments themselves were incorrect.
Nonetheless, metagenomics analysis often involves estimating the abundance of the species in a particular sample. Although we cannot unambiguously assign each read to a species, we would like to estimate how much of each species is present, specifically by estimating the number or percentage of reads in the sample. Several software tools have been developed to estimate species abundances in metagenomics samples [MetaPhlAn, ConStrains, GAAS, GASiC, TAEC, GRAMMy] (Angly et al., 2009;Lindner & Renard, 2012; Luo et al., 2015;Segata et al., 2012;Sohn et al., 2014;Xia et al., 2011). These tools, however, employ different strategies for read-level classification which are not always as accurate and efficient as Kraken’sk-mer approach (Lindgreen, Adair & Gardner, 2016). Rather than re-engineer Kraken to address the ambiguous read classification issue and to provide abundance estimates directly, we decided to implement the new species-level abundance estimation method described here as a separate program. This preserves both backwards compatibility for existing Kraken users, and offers the ability to generate more accurate species abundance estimates for datasets already processed by Kraken. Note that if Kraken fails to identify a species (e.g., if the species was missing from the Kraken database), Bracken too will not identify that species.
MATERIALS AND METHODS
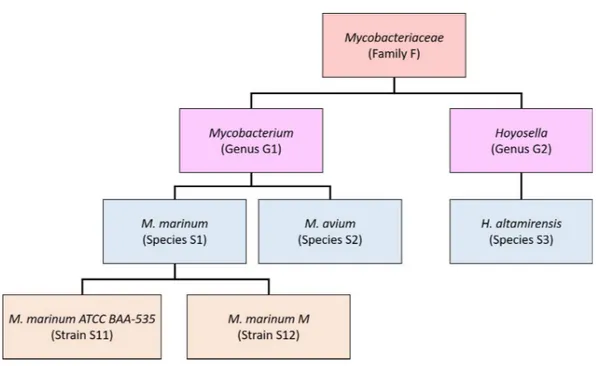
Our new method, Bracken (Bayesian Reestimation of Abundance after Classification with KrakEN), estimates species abundances in metagenomics samples by probabilistically re-distributing reads in the taxonomic tree. Reads assigned to nodes above the species level are distributed down to the species nodes, while reads assigned at the strain level are re-distributed upward to their parent species. For example, inFig. 1we would distribute reads assigned to theMycobacteriaceae family and theMycobacteriumgenus down toM. marinumandM. avium, and reads assigned to eachM. marinumstrain would be reassigned to theM. marinumspecies. As we show below, Bracken can easily reestimate abundances at other taxonomic levels (e.g., genus or phylum) using the same algorithm.
Figure 1 Schematic showing a partial taxonomic tree for theMycobacteriaceaefamily.
it, and reads assigned to theMycobacteriaceae would have to be allocated toM. marinum (S1),M. avium(S2), andHoyosella altamirensis(S3).
Reallocating reads from a genus-level node in the taxonomy to each genome below it can be accomplished using Bayes’ theorem, if the appropriate probabilities can be computed. LetP(Si) be the probability that a read in the sample belongs to genomeSi,P(Gj) be the
probability that a read is classified by Kraken at the genus levelGj, andP(Gj|Si) be the
probability that a read from genomeSiis classified by Kraken as the parent genusGj. Then
the probability that a read classified at genusGjbelongs to the genomeSican be expressed
asEq. (1):
P(Si|Gj)=
P(Gj|Si)P(Si)
P(Gj)
. (1)
Note that because we began by assuming that a read was classified at nodeGj,P(Gj)=1.
Next we consider how to computeP(Gj|Si), the probability that a read from genome
Si will be classified by Kraken at the parent genusGj. We estimate this probability for
reads of lengthrby classifying the sequences (genomes) that we used to build the database using that same database, as follows. For eachk-mer in the sequences, Kraken assigns it a taxonomy ID by a fast lookup in its database. To assign a taxonomy ID for a read of lengthr, Kraken examines allk-mer classifications in that read. For example, fork=31 andr=75, the read will contain 45k-mers. Our procedure examines, for each genome in the database, a sliding window of lengthracross the entire genome.
sequence is assigned to a taxonomy ID somewhere along the path from the genome’s taxonomy ID to the root, the highest-weighted root-to-leaf path (and thus the Kraken classification) corresponds to the deepest node.
For each genomeSiof lengthLiwe thus generate (Li−r+1) mappings to taxonomical
IDs. For nodeGj, we then count the number of reads from Sithat are assigned to it,NGj(Si).
P(Gj|Si) is then the proportion of reads fromSithat were assigned to the genus nodeGj;
i.e.,P(Gj|Si)=NGj(Si)/(Li−r+1). We also calculate the proportion of reads fromSithat
were assigned to every node from genomeSito the root node of the taxonomy tree.
The final term that we must calculate fromEq. (1)isP(Si), the probability that a read in
the sample belongs to genomeSi, which is computed in relation to other genomes from the
same genus. For example, if the sample contains three genomes in the same genus, and if 30% of all reads from those three genomes belong toSi, thenP(Si)=0.3. We estimate this
probability using the reads that are uniquely assigned by Kraken to genomeSi, as follows.
If we letUSibe the proportion of genomeSithat is unique, then
USi=
NSi
Li−r+1
(2)
whereNSiis the number ofk-mers of lengthrthat are uniquely assigned to genomeSi by
Kraken, andLiis the genome length. For example, ifLi=1 Mbp and only 250,000k-mers
are unique to genomeSi, thenUSi=0.25.
Then, using the number of readsKSifrom a sample that Kraken actually assigns toSi,
we can estimate the number of reads that likely derive fromSias:
ˆ KSi=
KSi
USi
. (3)
For example, if Kraken classifies 1,000 reads as genomeSiand 25% of the reads fromSiare
unique, then we would estimate that 4,000 reads (1,000/0.25) fromSiare contained in the
sample.
If genusGj containsngenomes, we estimate the number of readsKˆSfor each of then
genomes and then calculateP(Si) by:
P(Si)=
ˆ KSi
Pn
a=1KˆSa
. (4)
Using this result inEq. (1)above allows us to computeP(Si|Gj) for each genomeSi. Each
probabilityP(Si|Gj) is then used to estimate the proportion of the reads assigned to genus
Gjthat belong to each of the genomes below it.
These calculations are repeated for each taxonomic level above the genus level (family, class, etc.), with read distribution at each level going to all genomes classified within that taxonomic subtree.
where multiple genomes exist for a given species, the reads distributed to each genome are combined and added to the Kraken-assigned species level reads. The added reads give the final species-level abundance estimates.
This method can also estimate abundance for other taxonomic levels. In such cases, only higher nodes within the taxonomy tree undergo read distribution. After distributing reads downward, we estimate abundance for a node at the level specified by combining the distributed reads across all genomes within that node’s subtree.
Software and data availability
Bracken is written in Perl and Python and is freely available for download at http: //ccb.jhu.edu/software/bracken/. The reads from the skin microbiome experiment are freely available from NCBI under BioProjectPRJNA316735.
RESULTS AND DISCUSSION
We applied the statistical re-assignment method described here to create species-level abundance estimates for several metagenomics data sets. The overall procedure works as follows. First, we compute a set of probabilities from the Kraken database by computing, for every sequence of length R in every genome, where it will be assigned in the taxonomy (see ‘Methods’). For our experiments, we setR=75 as our datasets contain 75-bp reads. Bracken can use these probabilities for any metagenomics data set, including data with different read lengths, although the estimates might be slightly improved by re-computing with a read length that matches the experimental data.
Second, we run Kraken on the dataset to produce read-level taxonomic classifications. We then apply our abundance estimator, Bracken, which uses the numbers of reads assigned by Kraken at every level of the taxonomy to estimate the abundances at a single level (e.g., species). Note that to exclude false positives, Bracken ignores species with counts below a user-adjustable threshold. In our experiments, we selected a threshold of 10 reads.
Experiments on a 100-genome metagenomics data set
For our first experiments, we used a data set containing simulated Illumina reads from 100 genomes. This data, which we call here the i100 dataset, was used previously in a comparison of metagenomic assembly algorithms (Mende et al., 2012). The data contains 53.3 million paired reads (26.7M pairs) from 100 genomes representing 85 species. The reads have error profiles based on quality values found in real Illumina reads (Mende et al., 2012). The i100 dataset includes several very challenging genomes for this task, including multiple strains and species in the generaBacillusandMycobacteria, some of which are nearly identical to one another. The i100 data are freely available at http://www.bork.embl.de/~mende/simulated_data.
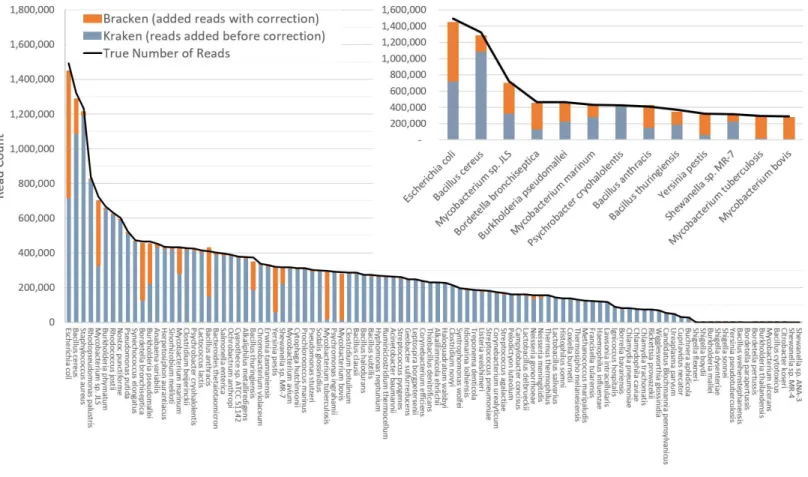
Figure 2 Estimates of species abundance in the i100 metagenomics dataset computed by Kraken (blue) and Bracken (blue+orange).For this result, the Kraken database contained 693 genomes that included the i100 genomes. The smaller graph displays results for the subset of species for which Bracken made the largest adjustments. The black line shows the true number of reads from each species. Precise numbers for the Kraken clas-sification, true read counts, and Bracken estimates are contained inTable S2A.
this is the full database from the simulation study byMende et al. (2012). The results when using the small database for classification are shown inFig. 2. For several species, the initial Kraken numbers (reads assigned to a particular species) are far too low, because many of the reads (for some genomes, a large majority) were assigned labels at the genus level or above. After reestimation with Bracken, these reads were redistributed to the species level, with the result that almost all the abundance estimates were 98–99% correct, as shown in the figure.
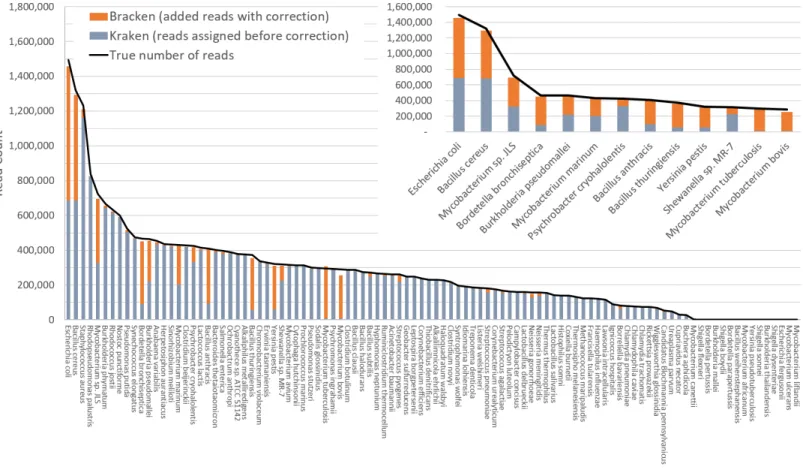
Figure 3 Estimates of species abundance computed by Kraken (blue) and Bracken (blue+orange) for the i100 metagenomics data. For this
re-sult, the Kraken database contained 2,635 distinct bacterial and archaeal taxa. The black line shows the true number of reads from each species. The smaller graph displays results for the subset of species for which Bracken made the largest adjustments. Precise numbers for the Kraken classifica-tion, true read counts, and Bracken estimates are contained inTable S2B.
Figure 3shows results when using the large database to estimate abundance for the i100 genomes. This test is much more difficult because of the large number of similar and near-identical genomes in the database. Many more reads are ambiguous, mapping identically to two or more species, which means that Kraken assigns them to the LCA of those species. Nonetheless, Bracken brings the estimated abundance of all species within 4% of the true abundance, and most fall within 1%. Note that when the re-estimation procedure distributes reads from higher nodes in the taxonomy down to multiple species within a single genus, it may over-estimate one species and underestimate its sister species if the re-allocation is imperfect.
Tables S2A–S2Bcontains the detailed numbers for all species inFigs. 2and3, along with an error rate for each species in the i100 data, expressed as the difference between the true and estimated proportions. We calculated the average error as:
1 n
n X
i=1
R
(i) true−R(esti)
R(truei)
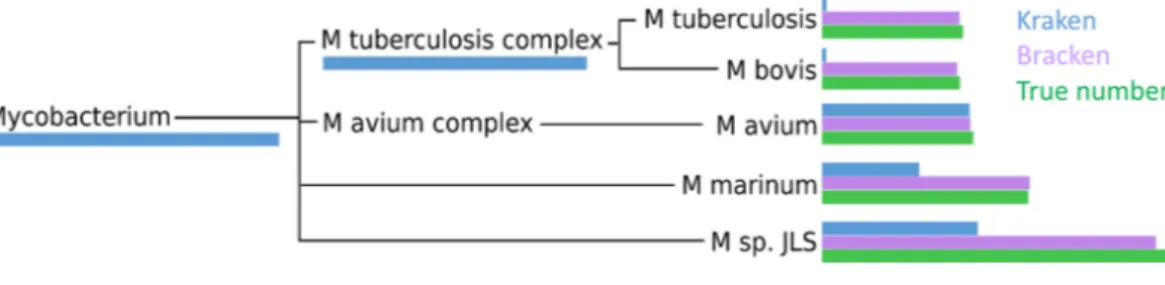
Figure 4 Number of reads within theMycobacteriumgenus as assigned by Kraken (blue), estimated by Bracken (purple) and compared to the true read counts (green).Initially, Kraken assigned only 325,073 reads toMycobacterium sp. JLSalthough 722,880 reads originated from this species. Bracken reassigned 370,601 reads from theMycobacteriumgenus toM. sp. JLS. Bracken’s re-estimated abundance forM. sp. JLSis much closer to the true read count.Table S3contains precise numbers for all species shown here.
wherenis the number of species in the i100 data,R(truei) is the true number of reads for speciesi, andR(esti) is the Bracken estimate of the number of reads for speciesi. When using the small database, the average relative error of Bracken is 1.75% across all 85 species in the i100 data. For the larger database, the average relative error is 1.89%. We also calculated false positive rates for the i100 data as the percentage of total reads incorrectly classified after Bracken abundance estimation. For the small database, the false positive rate is 0.13% and for the large database, the false positive rate is 0.24%.
Within the i100 genomes, the five species belonging to theMycobacteriumgenus (M. tuberculosis, M. bovis, M. avium, M. marinum, andM. sp. JLS) pose a particular challenge for abundance estimation due to the similarities among their individual genomes. For example, Kraken classified only 9,733M. tuberculosisreads at the species level, and classified the remaining 285,414 reads as eitherMycobacterium(a genus) orM. tuberculosis complex(a taxonomic class intermediate between genus and species), as shown inFig. 4andTable S3. For theseMycobacteriagenomes, Bracken reallocated the reads from higher-level nodes to yield species abundance estimates within 4% of the true abundance.Figure 4andTable S3 show the number of reads assigned to each species by Kraken, the true number of reads, and the number of reads assigned to each species by Bracken after abundance reestimation.
The five species of the Mycobacteriumgenus also provide an example of potential overestimation by Bracken. Bracken apportions all ambiguous reads classified by Kraken at the genus level (and above) to the existing species identified by Kraken. Because Bracken uses a probabilistic method in distributing the reads, one species may receive too many reads while another may receive too few. For example, Kraken assigned 543,916 reads to M. tuberculosis complex. Bracken re-allocated 296,543 of these reads toM. tuberculosisand the remaining 247,453 reads toM. bovis. When added to Kraken’s original assignments, Bracken estimated that 306,792 reads belonged toM. tuberculosis(11,645 reads more than the true number) that 256,927 reads belonged toM. bovis(31,473 reads less than the true number). It is likely that some of the additional reads Bracken allocated toM. tuberculosis originated from M. bovisinstead. However, despite the over- and under-estimation, Bracken’s estimates fell within 4% of the true number of reads for both species.
M. tuberculosis complex would assigned toM. tuberculosisby Kraken. These reads would no longer be ambiguous because no otherMycobacteriumspecies from theM. tuberculosis complex would be present in the database. In general, reads belonging to species excluded from the database will either be assigned to species with very high similarity to the missing species or will remain unclassified.
Experiments on a real metagenomics sample created from known species
For a more realistic evaluation of the performance of Bracken, we generated new sequence data using a set of bacteria that are commonly found on healthy human skin. This mock community was assembled by combining purified DNA from nine isolates that were identified and sequenced during the initial phase of the Human Microbiome Project (Human Microbiome Project, 2012): Acinetobacter radioresistens strain SK82, Corynebacterium amycolatum strain SK46,Micrococcus luteus strain SK58,Rhodococcus erythropolis strain SK121,Staphylococcus capitis strain SK14,Staphylococcus epidermidis strain SK135, Staphylococcus hominisstrain SK119,Staphylococcus warneristrain SK66, andPropionibacterium acnesstrain SK137. To generate the skin microbiome community, purified DNA was obtained from the Biodefense and Emerging Infections Research Resources Repository (BEI Resources). Each of the nine bacterial isolates was grown under conditions recommended by BEI Resources, collected by centrifugation during log growth phase at a 600nm optical density (OD600) of 0.8–1.2, and genomic DNA was isolated using MasterPure DNA isolation reagents (Epicentre). Purified genomic DNA was quantified using the high sensitivity picogreen assay (Invitrogen), pooled in equal amounts by mass, and prepared for sequencing using Nextera XT library preparation reagents (Illumina). The sample was then sequenced on a HiSeq sequencer, generating a total of 78,439,985 million read pairs (157 million reads), all of them 100 bp in length. These were then classified as pairs by Kraken, which concatenates the two reads from each pair and assigns them to a single taxonomic category.
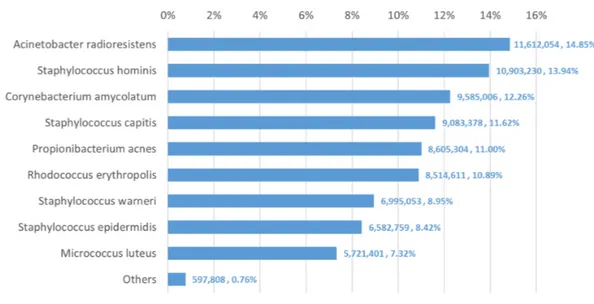
We used Bracken to estimate both species and genus-level abundance in the skin microbiome community. In the Bracken results, the nine true species comprise over 99% of the species-level abundance estimates. The mixture was created with approximately equal amounts of each of the nine genomes, so the expectation was that each species would account for∼11% of the total. However, as shown inFig. 5, the estimates varied from 7.3% to 14.8%. Details for the exact number of reads assigned by Kraken and the abundance estimates by Bracken are shown inTable S4.
Figure 5 Estimates of species abundance made by Bracken for the metagenomics community contain-ing isolates of nine bacterial species commonly found on human skin.Precise numbers can be found in
Table S4.
genera. The abundances found in this data, therefore, may correspond fairly closely with the true abundances.
The genus-level abundance estimates computed by Bracken also correspond closely to the expected abundances for the six genera included in the sample. Four of the nine species belong to the genus Staphylococcus, which was thus expected to comprise 44% (4×11%) of the sample. The Bracken estimate was 43.3%. Each of the other genus classifications has only one species present, and their abundance estimates are the same for both genus and species.
The comparison between the Kraken classification of reads and Bracken’s reassignment revealed that the nine species are sufficiently distinct to allow Kraken to classify a large majority of reads at the species level, with very few reads being classified at higher levels of the taxonomy. Specifically, Kraken classified 76.4 million reads to the nine species included in the sample. Only 1.3 million reads out of the 78.2 million total (1.6%) were classified by Kraken at the genus level or above. (The remaining reads were unclassified.) In this case Bracken does not provide a substantial benefit, because reassignment of the 1.3 million reads could yield at most a 1.6% change in the estimated composition of the sample.
Abundance estimation timing and resource requirements
files require∼65 KB of space.Table S5lists detailed timing, RAM, and space requirements for each file and step of the Bracken abundance estimation algorithm.
CONCLUSION
Estimating the abundance of species, genera, phyla, or other taxonomic groups is a central step in the analysis of many metagenomics datasets. Metagenomics classifiers like Kraken provide a very fast and accurate way to label individual reads, and at higher taxonomic levels such as phyla, these assignments can be directly translated to abundance estimates. However, many reads cannot be unambiguously assigned to a single strain or species, for at least two reasons. First, many bacterial species are nearly identical, meaning that a read can match identically to two or more distinct species. Second, the bacterial taxonomy itself is undergoing constant revisions and updates, as genome sequencing reveals the need to re-assign species to new names. These revisions sometimes create new taxa that share near-identical sequence with a distinct species. In these situations, Kraken correctly assigns the read to a higher-level taxonomic category such as genus or family. This creates a problem in that Kraken’s classifications cannot be used directly for species abundance estimation.
Bracken addresses this problem by probabilistically re-assigning reads from intermediate taxonomic nodes to the species level or above. As we have shown here, these re-assignments produce species-level abundance estimates that are very accurate, typically 98% correct or higher. For genus-level abundance, accuracy is even higher because fewer reads have ambiguous assignments at that level. For abundance estimation at higher levels, ranging from family up to phylum, Kraken’s original read assignments can be used directly to create abundance estimates.
ACKNOWLEDGEMENTS
We would like to thank Derrick Wood for valuable suggestions on the implementation of the algorithm, and Kasper Hansen for helpful comments and feedback on a draft version of this manuscript.
ADDITIONAL INFORMATION AND DECLARATIONS
Funding
This work was supported in part by the US National Institutes of Health R01-HG006677 and R01-GM083873 and by the US Army Research Office W911NF-1410490. The funders had no role in study design, data collection and analysis, decision to publish, or preparation of the manuscript.
Grant Disclosures
Competing Interests
Steven L. Salzberg is currently serving as an Academic Editor for PeerJ.
Author Contributions
• Jennifer Lu and Florian P. Breitwieser conceived and designed the experiments,
performed the experiments, analyzed the data, contributed reagents/materials/analysis tools, wrote the paper, prepared figures and/or tables, performed the computation work, reviewed drafts of the paper.
• Peter Thielen performed the experiments, analyzed the data, wrote the paper, reviewed
drafts of the paper.
• Steven L. Salzberg conceived and designed the experiments, analyzed the data, wrote the
paper, reviewed drafts of the paper.
Data Availability
The following information was supplied regarding data availability:
Bracken is written in Perl and Python and is freely available for download at http://ccb.jhu.edu/software/bracken/. The reads from the skin microbiome experiment are freely available from NCBI under BioProjectPRJNA316735.
Supplemental Information
Supplemental information for this article can be found online athttp://dx.doi.org/10.7717/ peerj-cs.104#supplemental-information.
REFERENCES
Angly FE, Willner D, Prieto-Davo A, Edwards RA, Schmieder R, Vega-Thurber R, Antonopoulos DA, Barott K, Cottrell MT, Desnues C, Dinsdale EA, Furlan M, Haynes M, Henn MR, Hu Y, Kirchman DL, McDole T, McPherson JD, Meyer F, Miller RM, Mundt E, Naviaux R, Rodriguez B, Stevens RK, Wegley L, Zhang L, Zhu B, Rohwer F. 2009.The GAAS metagenomic tool and its estimations of viral and microbial average genome size in four major biomes.PLos Computational Biology 5:e1000593DOI 10.1371/journal.pcbi.1000593.
Benson DA, Clark K, Karsch-Mizrachi I, Lipman DJ, Ostell J, Sayers EW. 2015. GenBank.Nucleic Acids Research43:D30–D35DOI 10.1093/nar/gku1216.
Bowers RM, Clum A, Tice H, Lim J, Singh K, Ciobanu D, Ngan CY, Cheng JF, Tringe SG, Woyke T. 2015.Impact of library preparation protocols and template quantity on the metagenomic reconstruction of a mock microbial community.BMC Ge-nomics16:856 DOI 10.1186/s12864-015-2063-6.
Garnier T, Eiglmeier K, Camus JC, Medina N, Mansoor H, Pryor M, Duthoy S,
Grondin S, Lacroix C, Monsempe C, Simon S, Harris B, Atkin R, Doggett J, Mayes R, Keating L, Wheeler PR, Parkhill J, Barrell BG, Cole ST, Gordon SV, Hewinson RG. 2003.The complete genome sequence ofMycobacterium bovis.Proceedings of the National Academy of Sciences of the United States of America100:7877–7882 DOI 10.1073/pnas.1130426100.
Grange JM. 2001.Mycobacterium bovisinfection in human beings.Tuberculosis81:71–77 DOI 10.1054/tube.2000.0263.
Helgason E, Okstad OA, Caugant DA, Johansen HA, Fouet A, Mock M, Hegna I, Kolsto AB. 2000.Bacillus anthracis,Bacillus cereus, andBacillus thuringiensis–one species on the basis of genetic evidence.Applied and Environmental Microbiology66:2627–2630 DOI 10.1128/AEM.66.6.2627-2630.2000.
Human Microbiome Project C. 2012.Structure, function and diversity of the healthy human microbiome.Nature 486:207–214DOI 10.1038/nature11234.
Lan R, Reeves PR. 2002.Escherichia coliin disguise: molecular origins of Shigella. Microbes and Infection4:1125–1132DOI 10.1016/S1286-4579(02)01637-4. Lindgreen S, Adair KL, Gardner PP. 2016.An evaluation of the accuracy and speed of
metagenome analysis tools.Scientific Reports6:Article 19233DOI 10.1038/srep19233. Lindner MS, Renard BY. 2012.Metagenomic abundance estimation and diagnostic
testing on species level.Nucleic Acids Research41:e10DOI 10.1093/nar/gks803. Liu Y, Lai Q, Göker M, Meier-Kolthoff JP, Wang M, Sun Y, Wang L, Shao Z. 2015.
Genomic insights into the taxonomic status of the Bacillus cereus group.Scientific Reports5:Article 14082DOI 10.1038/srep14082.
Luo C, Knight R, Siljander H, Knip M, Xavier RJ, Gevers D. 2015.ConStrains identifies microbial strains in metagenomic datasets.Nature Biotechnology33:1045–1052 DOI 10.1038/nbt.3319.
Mende DR, Waller AS, Sunagawa S, Jarvelin AI, Chan MM, Arumugam M, Raes J, Bork P. 2012.Assessment of metagenomic assembly using simulated next generation sequencing data.PLoS ONE7:e31386DOI 10.1371/journal.pone.0031386. Morgulis A, Coulouris G, Raytselis Y, Madden TL, Agarwala R, Schaffer AA.
2008.Database indexing for production MegaBLAST searches.Bioinformatics 24:1757–1764DOI 10.1093/bioinformatics/btn322.
Peabody MA, Van Rossum T, Lo R, Brinkman FS. 2015.Evaluation of shotgun
metagenomics sequence classification methods using in silico andin vitrosimulated communities.BMC Bioinformatics16:363DOI 10.1186/s12859-015-0788-5. Riesenfeld CS, Schloss PD, Handelsman J. 2004.Metagenomics: genomic analysis of
microbial communities.Annual Review of Genetics38:525–552 DOI 10.1146/annurev.genet.38.072902.091216.
Schaeffer L, Pimentel H, Bray N, Melsted P, Pachter L. 2015.Pseudoalignment for metagenomic read assignment. ArXiv preprint.arXiv:1510.07371v07372.
Sohn M, An L, Pookhao N, Li Q. 2014.Accurate genome relative abundance estimation for closely related species in a metagnomic sample.BMC Bioinformatics15:Article 242DOI 10.1186/1471-2105-15-242.
The International Human Genome Sequencing Consortium. 2001.Initial sequencing and analysis of the human genome.Nature409:860–921DOI 10.1038/35057062. Thiel T, Pratte BS, Zhong J, Goodwin L, Copeland A, Lucas S, Han C, Pitluck
S, Land ML, Kyrpides NC, Woyke T. 2014.Complete genome sequence of Anabaena variabilisATCC 29413.Standards in Genomic Sciences9:562–573 DOI 10.4056/sigs.3899418.
Venter JC, Adams MD, Myers EW, Li PW, Mural RJ, Sutton GG, Smith HO, Yandell M, Evans CA, Holt RA, Gocayne JD, Amanatides P, Ballew RM, Huson DH, Wortman JR, Zhang Q, Kodira CD, Zheng XH, Chen L, Skupski M, Subramanian G, Thomas PD, Zhang J, Gabor Miklos GL, Nelson C, Broder S, Clark AG, Nadeau J, McKusick VA, Zinder N, Levine AJ, Roberts RJ, Simon M, Slayman C, Hunkapiller M,
Bolanos R, Delcher A, Dew I, Fasulo D, Flanigan M, Florea L, Halpern A, Han-nenhalli S, Kravitz S, Levy S, Mobarry C, Reinert K, Remington K, Abu-Threideh J, Beasley E, Biddick K, Bonazzi V, Brandon R, Cargill M, Chandramouliswaran I, Charlab R, Chaturvedi K, Deng Z, Di Francesco V, Dunn P, Eilbeck K, Evangelista C, Gabrielian AE, Gan W, Ge W, Gong F, Gu Z, Guan P, Heiman TJ, Higgins ME, Ji RR, Ke Z, Ketchum KA, Lai Z, Lei Y, Li Z, Li J, Liang Y, Lin X, Lu F, Merkulov GV, Milshina N, Moore HM, Naik AK, Narayan VA, Neelam B, Nusskern D, Rusch DB, Salzberg S, Shao W, Shue B, Sun J, Wang Z, Wang A, Wang X, Wang J, Wei M, Wides R, Xiao C, Yan C, Yao A, Ye J, Zhan M, Zhang W, Zhang H, Zhao Q, Zheng L, Zhong F, Zhong W, Zhu S, Zhao S, Gilbert D, Baumhueter S, Spier G, Carter C, Cravchik A, Woodage T, Ali F, An H, Awe A, Baldwin D, Baden H, Barnstead M, Barrow I, Beeson K, Busam D, Carver A, Center A, Cheng ML, Curry L, Danaher S, Davenport L, Desilets R, Dietz S, Dodson K, Doup L, Ferriera S, Garg N, Gluecksmann A, Hart B, Haynes J, Haynes C, Heiner C, Hladun S, Hostin D, Houck J, Howland T, Ibegwam C, Johnson J, Kalush F, Kline L, Koduru S, Love A, Mann F, May D, McCawley S, McIntosh T, McMullen I, Moy M, Moy L, Murphy B, Nelson K, Pfannkoch C, Pratts E, Puri V, Qureshi H, Reardon M, Rodriguez R, Rogers YH, Romblad D, Ruhfel B, Scott R, Sitter C, Smallwood M, Stewart E, Strong R, Suh E, Thomas R, Tint NN, Tse S, Vech C, Wang G, Wetter J, Williams S, Williams M, Windsor S, Winn-Deen E, Wolfe K, Zaveri J, Zaveri K, Abril JF, Guigo R, Campbell MJ, Sjolander KV, Karlak B, Kejariwal A, Mi H, Lazareva B, Hatton T, Narechania A, et al. 2001.The sequence of the human genome.Science 291:1304–1351DOI 10.1126/science.1058040.
Venter JC, Remington K, Heidelberg JF, Halpern AL, Rusch D, Eisen JA, Wu D,
Wood DE, Salzberg SL. 2014.Kraken: ultrafast metagenomic sequence classification us-ing exact alignments.Genome Biology15:Article R46DOI 10.1186/gb-2014-15-3-r46. Xia LC, Cram JA, Chen T, Fuhrman JA, Fengzhu S. 2011.Accurate genome relative