©2013 Science Publication
doi:10.3844/ajessp.2013.292.300 Published Online 9 (4) 2013 (http://www.thescipub.com/ajes.toc)
Corresponding Author: Mohd Khairul Amri Kamarudin, School of Social, Development and Environmental Studies, Faculty of Social Sciences and Humanities, National University of Malaysia, 43600, Bangi Selangor, Malaysia Tel: +603-89214745 Fax: +603 -89213291
BED-LOAD SEDIMENT PROFILE AND EFFECT OF
RIVER BANK EROSION ON RIVER CROSS-SECTION
1
Mohd Ekhwan Toriman,
1Frankie Marcus Ata,
1Mohd Khairul Amri Kamarudin and
2Mushrifah Idris
1
School of Social, Development and Environmental Studies, Faculty of Social Sciences and Humanities,
2
School of Environmental and Natural Resources Sciences, Faculty of Sciences and Technology,
National University of Malaysia, 43600, Bangi Selangor, Malaysia
Received 2012-03-19, Revised 2012-05-03; Accepted 2013-07-20
ABSTRACT
The processes of lateral and riverbank erosion are among the elements of river morphology dynamic resulting from natural processes and human activities. This process has been studied in detail throughout the research for four months starting from 7 October 2009 to 26 January 2010. In this research, technique of erosion pins were applied at five plots selected along the Chini River in Pahang, Malaysia in order to evaluate the rate of for lateral and river bank erosion. The results in the lateral erosion indicates that, the average highest erosion was recorded at plot 4 (3 cm), followed by plot 3 (2.3 cm), plot 2 (1.42 cm), plot 1 (1.2 cm) and plot 5 recorded the lowest average which is 0.59 cm respectively. Overall, the total average of lateral erosion recorded at all five plots is 8.51 cm. Meanwhile, results obtained from river cross-section variation indicated that plot 1 and 2 show changes from the V shape in early observation to U shape at the end of the observation period. This shows that side-erosion was active in the entire process. Furthermore, plot 3, 4 and 5 remained U shape until the latest observation but it was found that the riverbed was getting shallow. For the regression analysis, two independent variables were selected to relate with rate of river bank erosion namely steep gradient bank height of the bank. These independent variables show a positive relationship with the rate of the side and river bank erosion where the value of r² is 0.820 and 0.645 for both variable of gradient and height. For the analysis of soil particle distribution, the mean value is a sand and very coarse with phi ø -2.00 to phi ø 0.00. The standard Deviation (D) indicates of worst deposition, between phi ø 1.00 to phi ø 4.00. Skewness(S) shows very small size to oversize which is between phi ø -1.00 to phi ø +1.00 and the value of Kurtosis (K) for this river is dominated by grain size mesokurtic and platikurtic. Therefore, the Slope Stabilization or river bank slope protection of River Chini area is proposed to reduce the river bank erosion and sediment production.
Keywords: Riverbank Erosion, River Geomorphology, Types of Erosion, Bedload Sedimentation, Particle Size
1.
INTRODUCTION
Overall, the erosion of rivers in Malaysia is still in a normal condition although some rivers are eroding severely. However, the problem regarding river bank erosion lead to the changes in plans and geometry as well as destroying living habitats on the river side.
of the collapsed structure and the last factor is the movement of the soil at the top of the banks due to the increase of water content during the flood. Riverbank erosion is highly influenced by the composition of the material on the banks of the river. River of sand material is more susceptible to erosion of river banks composed of clay materials. In geomorphology, bank erosion process is an important element in the formation of the earth, rivers, drainage design changes and content changes during the deposition of hard rock in the river (Lawler, 1993). To obtain results in geomorphology, will take some time. The objectives of this study is to measure erosion rates in some selected plots along the river Chini and identify the main sources of bank erosion occurred in Chini River.
Erosion is a process of breaking chunks of land surface and its transfer to another by moving water or wind. Water is a very dangerous agent than the wind. Water soluble and will not only run but also erode the nutrients and soil grains break away. Loss of surface soil will cause problems in agriculture. The process of the earth’s surface caused by the impact action of moving agents such as running water, wind, waves and glaciers. There are two types of corrosion is an erosion of geological and erosion. Geological erosion of natural erosion in areas that have not been tampered with. Soil erosion is the erosion caused by human action when man interferes with nature.
The action involves the process of erosion, transport and sedimentation is normal along the river (Toriman and Haryati, 2007). River erosion occurs through hydraulic action, solution, abrasion and fighting (Troeh et al., 1980). Hydraulic action is a process of water erosion on the river side and the groove base. Strong flow power of the water will dig out loose rock structure such as gravel, sand, silt and clay found on the side and at the bottom of the river flow (Schuerch et al., 2006). Abrasion is a process of exposure on the basis of load flow by rivers such as boulders of sand and silt in the river flow (Toriman, 2007). These loads are shifted toward the river bottom will be deepened base shifted toward the side of the river will widen the valley (Brunsden and Thornes, 1979). Hit is process of diminution occurring at a load current material the river this carried by river water. The burden of the river such as chips and pieces of rock friction and colliding with each other (Chan and Toriman, 2004). For example, larger boulders broken into small fragments. The solution is a process that causes rocks dissolved and destroyed in the river. Rain will form carbonic acid in the air (Toriman, 2007). Acid of rain this acidic then will come down and flows in the river water. A chemical reaction occurs when the rain has come upon the limestone. Carbonic acid contained in water will dissolve the limestone consists of calcium carbonate (Dury, 1969).
Stream velocity factors an important role in the lateral erosion activity. Stream velocity also depends on the volume of water supplied at any one time. Generally, a high rate of speed and volume of water which has a lot of strong erosion rates compared to the slow speed of the water and a small volume. According to Strahler (2006), the flow of the river is affected by turbulence, the vortex state of constantly forming and disappearing. Erosion becomes more effective when the river is on winding causes the velocity of water flow and prevented compared to Straight River.
According to Toriman and Haryati (2007), a medium sized river (stream order 3, 4 or 5) will carry out sized river flow faster than the smaller (<order3). Therefore, river bank erosion studies can be divided into a first method of proof of long term sedimentology and botanical evidence, the second is a measure of medium-term and repeated planimetrik repeated cross-sectional size and short duration of the last method of Photogrammetry Method, the pin erosion, photo electronic erosion pins. Weathering is important role in the formation of the river erosion. Weathering can be divided into two types of chemical weathering and mechanical weathering (Jammaluddin and Ismail, 1988). Chemical weathering does with the presence of water. River grooves accommodate water flows will dissolve the soil in riverside. Through the energy generated by the flow of water, the chemical weathering process is continuing in the river. Similarly, the process of mechanical weathering, weathering is happening on the banks of the river. One of the elements weathering process that are common the action of plant roots and burrowing animals at the banks river (Jammaluddin and Ismail, 1988). Splashing erosion can be also possible on the banks of the river. Furthermore, the presence of heavy rains also has an impact on the characteristics of lateral erosion by the river. Heavy rain caused the river discharge increased and thus could result in erosion of the sides. The increase in volume and velocity of surface runoff in the surrounding sloping area also results in loss of soil in large numbers.
exhaustion that occur at banks of the river flow. This erosion also knows as horizontal erosion can happen on both banks of river flow. Highly effective during flood events. This is because, during floods, the river water has kinetic energy and high potential. This broad erosion is more common in the river bends the beam, which is able to expand the size of the river flow. For example, deep bends in the river banks.
Reverse erosion or extension of the base of the groove is the beam deduction into the river. The deduction process to form point plunge, the formation of waterfalls and rapids. Based on studies, waterfall down to the bottom of the river flow caused the river eroded and excavated. This situation created on the banks of the grooves does not have the cached and may result in the occurrence of mass movement processes. Formed on the banks of the river will fall into occur when the mass movement. Next, create the conditions reverse parallel to the slope of the river bank and river forming captives. Riverbank erosion phenomenon was associated with the presence of water and the role of water in the soil or water in the soil. Water flowing into an area will produce energy for carrying out work such as an erosion corrosion side of a deep and widening the river valleys. Water flow in streams is driven by gravity and this force produces pressure on the banks of the river (Strahler, 2006). The process flow, such as
transport, deposition and erosion are directly produced by the presence of water or lubricated to act as advocates on the material being moved.
2. MATERIALS AND METHODS
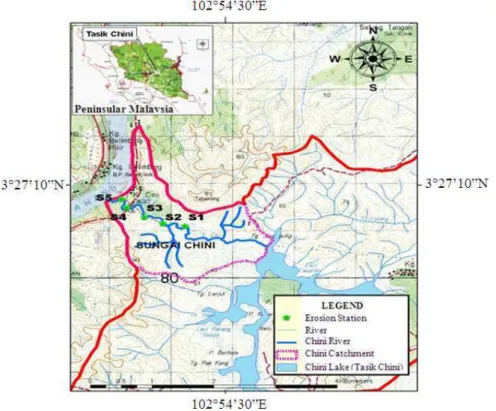
The study area for the analysis of river bank erosion is the Chini River, located in Pahang. Chini River is located at latitude 3°26’36.41”N and 3°27’10.26”E. Chini River is 4.8 km in length connecting the Sungai Pahang and lake Chini. Chini River, flowing out of the lake and flows into the Pahang River (Toriman et al., 2009). Therefore, Lake Chini is also accessible by water transport through the river from the village on the northern leather back Pahang River (Gasim and Toriman, 2006) in this study, erosion was measured in two areas that are actively undergoing the process of erosion of river meandering and straight areas. Plot of choice is in the river bends and a straight-shaped river along the Chini River. There are five plots of choice to study the erosion rate for four months of observations carried out. This is because, Chini River is a river that is prone to erosion, transport and deposition are active. Figure 1 shows a map of the study area.
Method of use of erosion pins used in this study. Typically, the erosion pin length is 35 cm with a diameter of 4 mm. These pins are inserted into the side of the river in a horizontal position parallel to the river. The distance used for each pin erosion is 0.5 meters. Reading will be taken to pin erosion by using a small measuring tape each time observations are made. Calculation of erosion is calculated based on the average the following formula:
erosion on all observations (cm) Average erosion (cm)
The number of erosion pins
=∑
The 100 g of sample are weighed and then sieving process is done using a tool called “sieve shaker” for a period of 15 min. According to Udden-Wentworth method (Udden, 1914; Wentworth, 1922), to facilitate analysis, the construction of an arithmetic ordinate of the graph using the weight value is to be made. Phi size is determined by looking at the schedule and grades size of sedimentary particles (Simon and Kenneth, 2001) for each value of phi. Graph paper using a log scale (logarithmic scale) was used for the purpose of this study.
3. RESULTS
3.1. Trends Review Space
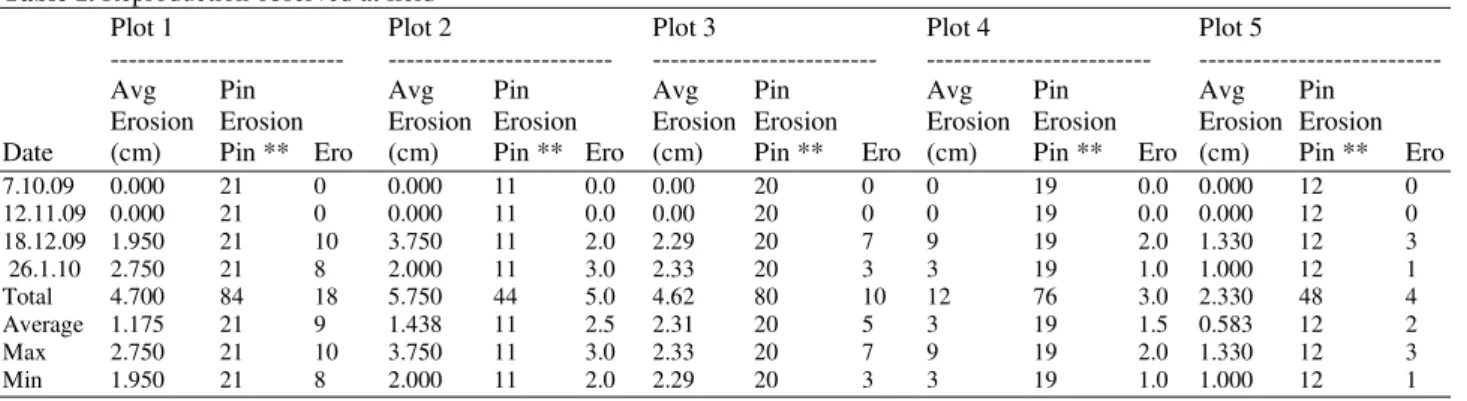
The study was taken place at Chini River which happened within the period of four months where it started in the middle of October 2009 until at the end of January 2010. This is the following results of observation from five plots, within the period of the study taken place (Table 1). Erosion trends that happened in both five plots showed different results among each plot compare to the other plot. Plot 4 showed the total average of erosion is higher where it is3 cm higher with the highest total of erosion (12 cm) compare to the other plots. The second highest of total average of erosion is recorded at plot 3 as much as 1.44 cm with the total of erosion of 5.75 cm. Then, it followed by plot 1 and plot 4 with the total of erosion that almost equally with each other that is 4.7 for plot 1 and 4.62 cm for plot 4. Plot 5 recorded the lowest total average of erosion that is 0.58 cm with the total erosion as much as 2.33 cm.
The average erosion according to the number of pins that eroded is different for every plot and for each observation. In this study, plot 1 using 21 pins, plot 2 using 11 pins, plot 3 using 19 pins while plot 4 using 19 pins and lastly, plot 5 using 12 pins. All the pins are used until the last observations were made. Overall, as many as 83 pins were used in five plots and 39 pins were eroded from the five plots. Plot 1 showed the highest number which undergoes erosion that is on third observation as
much as 10 pins from the total of 21 pins and fourth observation in total of 8 pins followed by plot 2 which recorded the total of 5 pins, plot 3 as much as 10 pins, plot 4 with 3 pins and finally plot 5 with 4 pins. Relatively, the average of eroded pin is more actively happened under the edge of the river causing the upper part of the river edge collapse because there was no support under the edge of the river. Next, the analysis of width ratio then showed that plot 1 and plot 2 entirely exhibit the total width-depth ratio a decrease from 0.48-0.46. The ratio value that indicates this reduction means these plot experiencing widening process and the erosion deepen the river which actively occurring in this area. For plot 3 until plot 5, its value of width-depth ratio indicates that there is an increasing ratio number at the end of the observation. In plot 3, the initial ratio value is 0.36 and it increased to 0.37 at the end of observation. Plot 4 then recorded a constant ratio number at the beginning of observation that is 0.39 before it’s increased to 0.40 at fourth observation. For plot 5, there is an increase from 0.44 until 0.47 at the end of observation. By the increase of ratio values, it shows that within the plot area there is a river widening process and the river floor becomes shallow because the deposition process taking place.
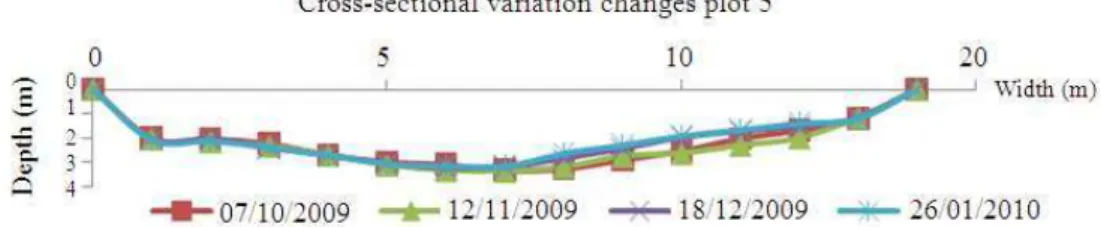
The process of river erosion can change the cross-section of a river groove into u shaped groove or V shaped groove. Water that flows in the river channel can be eroded by hydraulic impact, abrasion and scraping using the power from the water itself to dissolve the substance that present on the river floor or river wall (Jamaluddin, 1989). Therefore, the trend of average erosion that can cause the changes of the cross-section of a river can be explained through Fig. 2.
3.2. Trends Review Time
Table 1. Reproduction observed at field
Plot 1 Plot 2 Plot 3 Plot 4 Plot 5
--- --- --- --- ---
Avg Pin Avg Pin Avg Pin Avg Pin Avg Pin
Fig. 2. Variation of the cross-section of the study plots
Table 2. The period of observation days and the average erosion Date 7.10.2009 12.11.2009 18.12. 2009 26.01.2010 Total Bills of Day - 36 36.00 39.00 111.0000 Plot 1 (cm) 0 0 1.950 2.750 4.7000 Plot 2 (cm) 0 0 3.750 2.000 5.7500 Plot 3 (cm) 0 0 2.290 2.330 4.6200 Plot 4 (cm) 0 0 9.000 3.000 12.0000 Plot 5 (cm) 0 0 1.330 1.000 2.3300
4. DISCUSSION
4.1. Statistical Analysis
According to Rahim (1999), regression technique is a technique made to predict ant to determine whether a free variable can affect another variable or else can it leads to an increase or decrease toward depending variable or predicted. This analysis can be presented through one equation that shows the increasing rate (or decrease) of depending variable causing a decrease (or increase) on free variable. This equation can be shown as follows:
Where:
y + = Depending variable
X = Free variable which becomes predictor
A = A constant located at the interception of the variable y B = Increasing rate (or decrease)/slope of the regression
line
In this regression analysis, the data is overall average for free variable in every plot such as average discharge, average gradient and average height. This used to see the relationship or connection between variables or the chosen parameter with the changes erosion rate of the side of the river bank as a whole during the observations carried out.
4.2. Parameters Gradient of Erosion
According to Wischmeier and Smith (1965), when a gradient is increasing so the velocity of surface runoff is also increasing and it eventually increases the power of erosion. This means, the rainfall will provide energy to the
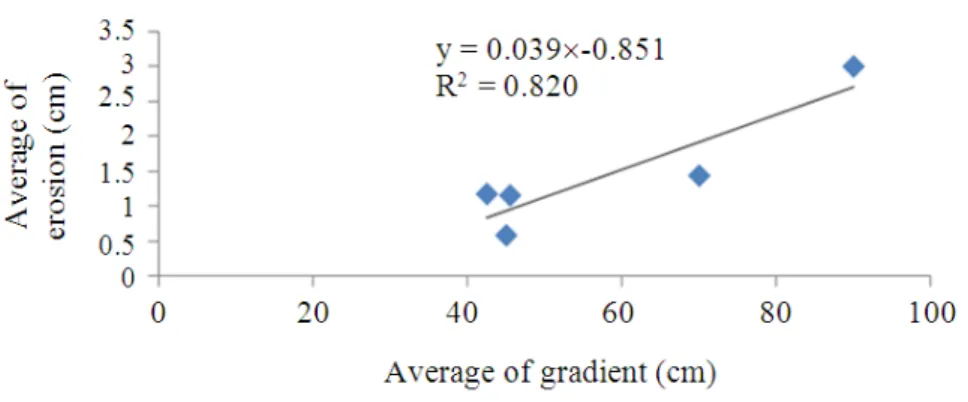
erosion process and to some extent also encourages the changes on the banks of the river. The results show the gradient factor has strong relationships with average erosion. This can be shown through statistical analysis shown by value of the regression coefficient of gradient for overall study plot is very influential with the value r2 as much as 0.820 or 82% of gradient factor affecting the rate of side erosion. While the equation is y = -0.851 + 0.039x (Fig. 3). This means the gradient factor has a close relationship with the erosion of riverside, the higher the slope, the higher the rate of erosion that can occur.
As a whole, those study plots have very steep of a bank slope as in plot 2, plot 3, plot 4 and plot 5. These four plots had a gradient value greater than 45 degrees as in plot 2 where the gradient is 70 degrees and plot 4 as much as 90 degrees. Apart from that, those study plots also endure backward erosion and the erosion actively deepens the river bed. Therefore, bank slides happen and the cliff collapse will likely happen on those plots.
4.3. Parameters Height of Erosion
The height factor of river bank is related with the gradient factor of river bank which determines whether the erosion process is actively happen or not. Even though there are other factors that affecting the erosion rate but the result of statistical analysis for those five plots show the relationship towards average erosion with river banks. Through regression analysis, the result can be represented as y = -1.722 + 1.511x and r2 value is 0.645 (Fig. 4). The regression value shows the average has a significant relationship with height factor. These mean the higher the cliff, the more the erosion process is likely to happen. Overall, these study plots have high and Steep River Bank and because of that, the erosion process actively deepens the river bed which causes the river bank prone to collapse. For example as in plot 2, plot 3 and plot 4.
4.4. Bad-Load Sediment Analysis
Fig. 3. Regression graph with the average slope of the average erosion for the whole study plot
Fig. 4. Regression graph of average height with the average erosion for the whole study plot
As much as five parameters had been determined by analyzing the size of grain sediments such as median, min, standard deviation, skewness and kurtosis (Kamarudin et al., 2009).
Median is middle value on one set data arranged in order. In this study, the highest median in these five study plots are in plot 5 that is in the middle of river bank as much as 0.34 phi, second highest is on plot 2 on the river bed as much as -0.19phi, plot 1 is on the river bottom as much -0.25phi. After that, upper bank on plot 2, upper bank and river bed on plot 5 each recorded as much as -0.38 phi. River bed on plot 3 and 4 recorded same phi value as much -0.50. Phi. Middle bank on plot 2, middle bank on plot 1 and upper bank on plot 3 recorded -0.54 phi value plot 2 middle bank and -0.58 for middle bank on plot 1 and upper bank on plot 3. Middle bank on plot 3 and upper bank on plot 1 and 4 recorded second lowest phi value in analysis study as much 0.67 for plot 3 and
-0.71 for plot 1 and 4. Median shows the lowest phi value on plot 4 in the middle.
Mean on every plot were analyze to determine the types of sediment particle on Chini River area which consists sand, very coarse grain, coarse grain, medium grain, fine grain and fine slit type. Based on , the highest min was recorded on the middle bank on plot 5 as much 0.76 phi followed by base area 0.33 phi, upper bank on plot 5 0.21 phi and river base on plot 2 is 0.18 phi. These three values show its type of grain which is coarse grain. On the other study plots, types of grain that were recorded is very coarse grain where the value of phi is between -1 phi until 0 phi.
2000). Based on the analysis that had been made, most standard deviation show poor level of uniformity where the value is between 1.0-2.0 phi. Based on bad-load sediment analysis, the distribution of sediment size analysis tables, upper bank and middle bank on plot, all areas on plot 2, all areas on plot 3, all areas in plot 4 and middle bank and base of plot 5 have poor levels of sediment uniformity where the value of phi on plot 1, 1.39 phi and 1.49 phi. Plot 2 shows 1.72 phi, 1.49 and 1.83 phi. Plot 3 shows 1.62, 1.40 1.76 phi. Plot 4 shows 1.71, 1.49 and 1.70 phi while plot 5 shows 1.87 and 1.45 phi. Then, there are 2 areas that have poor value of uniformity that is on river base on plot 2 as much 2.07 phi and upper bank on plot 5 as much 2.01 phi.
Skewness is one of the parameter used to study the distribution of sediment size. Skewness was used to see the size of sediment which start from very fine sediment (+1.00 phi to +3.00 phi) until vary coarse size of sediment (-0.30 phi to -1.00 phi). Based on the study that were made on all the study plots, most the value of skewness that were recorded is very fine where the phi value is between +1.00 phi to +3.00 phi. But there is skewness value that shows the size of the sediment is fine at river base on plot 1. Half of the river sands show positive skewness because most of the fine sediment were deposited after the river subside after flood or rain while beach sand shows negative skewness because the fine sediment can be easily separated (Tongkul, 2000). The result finds that all skewness value are in positive condition along Chini River where the river current is too slow and it will encourage sediment deposition process to occur.
The last parameter in analyzing the distribution of soil size is kurtosis. Kurtosis can determine tentuaturan level of sediment upper bank and middle bank on plot 1 are mesokurtic and the river bed is platikurtic. For plot 2, all areas are mesokurtic shaped while all areas on plot 3 are leptokurtic shaped. On plot 4, upper bank and base are mesokurtic shaped and upper bank is platikurtic. The last plot where the upper bank and middle bank are platikurtic and the river base is mesokurtic.
5. CONCLUSION
The erosion problem on the side of the river bank is a serious problem occurs along rivers in Malaysia. In this study, Chini River also faces the same problem with other rivers which undergo very serious side erosion. As a whole from the statistical analysis results, it shows that the gradient factor and height are the strongest factor in affecting the rate of side erosion of the Chini River bank.
Nonetheless, discharge factor, velocity of water and rain giving the least effect on the rate of side erosion.
These erosion problem causing the increase of sediment problem on the river bed and eventually will cause serious drastic changes on forms the earth of Chini River. Slow regulatory action will cause these problems becomes worse and the river will undergo reduction of river level resulted from deposition of the residue from the river banks. Appropriate actions should be taken in order to ensure the drainage system of Chini River is well preserve and taken care.
6. ACKNOWLEDGMENT
The researchers thankful to the National University of Malaysia and Tasik Chini Research Centre (UKM-PPTC) for funding support under grant (Ukmtopdown-st-08-FRGS0003-2010), hospitality and their contributions.
7. REFERENCES
Brunsden, D. and J.B. Thornes, 1979. Landscape sensitivity and change. Trans. Instit. Briti. Geographers, 4: 463-484.
Chan, F.O. and M.E. Toriman, 2004. Geografi Alam Sekitar Fizikal STPM. 1st Edn., Fajar Bakti Sdn. Bhd. Kuala Lumpur, Malaysia, pp: 536.
Dury, G.H, 1969. Rational descriptive classification of duricrusts. Earth Sci. J., 3: 77-86.
Gasim, M.B. and M.E. Toriman, 2006. ydrology, water quality and land-use assessment of Tasik Chini’s feeder rivers, Pahang, Malaysia. Geografia Malaysian J. Soc. Space, 2: 72-86.
Jamaluddin, M.J., 1989. Pengantar Geomorfologi. 1st Edn., Kuala Lumpur: Dewan Bahasa and Pustaka, Malaysia, pp: 404.
Jammaluddin, M.J.D. and A. Ismail, 1988. Pengantar Geografi Fizikal. Universiti Sains Malaysia.
Kamarudin, M.K.A., M.E. Toriman, S.A. Sharifah Mastura, M. Idris and N.R. Jamil, 2009. Temporal variability on lowland river sediment properties and yield. Am. J. Environ. Sci., 5: 657-663. DOI: 10.3844/ajessp.2009.657.663
Lawler, D.M., 1993. The measurement of river bank erosion and lateral channel change: A review. Earth Surf. Proc. Landforms, 18: 777-821. DOI: 10.1002/esp.3290180905
Schuerch, P., A.L. Densmore, B. McArdell and P. Molnar, 2006. The influence of landsliding on sediment supply and channel change in a steep mountain catchment. Geomorphology, 78: 222-235. DOI:10.1016/j.geomorph.2006.01.025
Simon, J.B. and P. Kenneth, 2001. Gradistat: A grain size distribution and statistics package for the analysis of unconsolidated sediments. Earth Surface Proc. Landforms, 26: 1237-1248. DOI: 10.1002/esp.261
Strahler, A., 2006. Introducing Physical Geography. 4th Edn., J. Wiley, Hoboken, N.J., New York.
Tongkul, F., 2000. Sedimentologi. 1st Edn., National University of Malaysia, Bangi Selangor DE., Malaysia, pp: 199.
Toriman, M.E. and C.L. Haryati, 2007. Ciri hidrologi dan hakisan tebing sungai di sungai lendu, alor gajah melaka. J. e-Bangi, 2: 1-19.
Toriman, M.E., 2007. Geografi Alam Sekitar Fizikal 1. 1st Edn., Kuala Lumpur: Publisher Oxford Fajar Sdn. Bhd. Malaysia, pp: 532.
Toriman, M.E., M.K.A. Kamarudin, N.A. Abd Aziz, M.B. Gasim and M. Idris, 2009. Modeling the hydrologic-hydraulic of backwater flow and sediment particle Saiz Analysis in Sungai Chini, Pahang. J. E-Bangi, 4: 56-69.
Troeh, F.R., J.B. Hobbs and R.L. Donahue, 1980. Soil and Water Conservation, Productivity and Environmental Protection. 1st Edn., Prentice Hall, Englewood Cliffs, N.J., USA., pp: 718.
Udden, J.A., 1914. Mechanical composition of clastic sediments. Geol. Soc. Am. Bull., 25: 655-744. Wentworth, C.K., 1922. A scale of grade and class terms
for clastic sediments. J. Geol., 30: 377-392. DOI: 10.1086/622910