basin analysis: the geotechnical map
of suitability for the urbanization
of Itapevi – São Paulo, Brazil
Gestão de risco de desastres e análise de bacias hidrográficas:
a carta geotécnica de aptidão à urbanização de Itapevi – SP, Brasil
Vitor Vieira Vasconcelos[I]
Sandra Momm[II]
Kátia Canil[III]
Fernando Rocha Nogueira[IV]
Abstract
Geotechnical maps of suitability for urbanization can provide directives for land use in terms of susceptibility to disasters. This paper presents methodological innovations for the development of these maps by incorporating hydrographic basin analysis in a case study conducted in the municipality of Itapevi. The Shalstab (Shallow Slope Stability) model evaluated the susceptibility of an area to landslides and correlated events. Wet zones were mapped by combining the Hand (Height to the Nearest Drainage) model with floodplain mapping and proximity to concave slopes. Participatory mapping delineated critical flood areas and possible impacts of land use on sub-basins. Urbanization trends were modeled using multivariate kernel analysis. This study presents perspectives on disaster risk management integrated with those of basin management.
Keywords: disasters; hydrographic basin; geotechnics; Itapevi; cartography.
Resumo
As cartas geotécnicas de aptidão à urbanização fornecem diretrizes para ocupação do solo fren-te à susceptibilidade a desastres. Apresentam-se inovações metodológicas para elaboração dessas cartas incorporando a análise de bacias hidrográ-ficas em um estudo de caso do município de Itape-vi. Empregou-se o modelo Shalstab (Shallow Slope Stability) para avaliar a susceptibilidade a desliza-mentos e eventos correlatos. As zonas úmidas fo-ram mapeadas conjugando o modelo Hand (Height to the nearest drainage), mapeamento de planícies fluviais e a proximidade a encostas côncavas. Um mapea mento participativo identificou áreas críti-cas de inundação e possíveis impactos ocupação de suas sub-bacias. As tendências de urbanização foram modeladas por kernel multivariado. São discuti das perspectivas de gestão de risco de desas-tres junto à gestão de bacias hidrográficas.
Introduction
Normative and conceptual aspects of g e o t e c h n i c a l m a p s o f s u i t a b i l i t y f o r urbanization
The municipal government has the constitutional responsibility to manage land use, including the authority to establish restrictions, criteria and precautions for entrepreneurs or the government itself. The municipality shares this responsibility with other public entities, respecting the distinct role of each government level, from local to regional, regarding the general and specific rules and their respective enforcement. In this spectrum of competences and practices related to spatial dynamics and considering that the frequency of extreme events and disasters has been increasing in Brazil, such as in “Vale do Itajaí”, State of Santa Catarina, in 2008 and in “Região Serrana”, State of Rio de Janeiro, in 2011, the Brazilian Federal Government promulgated, through Federal Law n. 12.608 of 2012, the National Policy of Civil Protection and Defense. This policy prioritized the integration of policies related to disaster risk reduction among various sectorial and development policies, especially those related to territorial planning. Article 22 of the policy amends Federal Law n. 12.304 of 2010, which obligates municipal governments to develop geotechnical maps of suitability for urbanization, with urbanism guidelines regarding the safety of new land allotments.
The concept of suitability for urbanization, considering physical processes that trigger disasters, relies on terrain characterization regarding process related to geology (gravitational mass movements) and hydrology (floods) by indicating guidelines for land use,
specific recommendations and restrictive areas (Prandini, 1980; Sobreira and Souza, 2012). Its application is focused on urban expansion areas within municipalities, including areas in the consolidation phase or those that are still not urbanized. In addition to physical parameters, other factors are taken into account, such as successional stages of vegetation cover and aspects related to environmental legislation that define restrictions to land use. In this way, geotechnical maps synthesize technical knowledge about the physical environment and its underlying processes (hence the prefix geo) in a given area to subsidize the establishment of measures for appropriate land use (hence the suffix technic). Its cartographic product enables the government to develop guidelines for urban territorial planning of urban expansion areas in municipalities, thus facilitating the formulation and revision of municipal masterplans.
seeks a territorial approach for risk reduction and prevention, integrating conventional disciplines such as geology and hydrology with components of spatial dynamics, planning and management. This paper analyzes one experience in which the methodological challenge of developing these maps is coupled to the challenge of municipal planning and management in terms of its possible re-applicability to municipalities in developing countries such as Brazil. The emphasis lies on the territorial aspects of hydrographic basins and their interactions through hydrological dynamics. Regarding the structural problems of the development model and the public management, the existence of geotechnical maps of suitability for urbanization alone would not be sufficient to change the scenario, but when associated with actions of risk reduction and prevention, these maps would certainly add new elements for the culture and system of municipal management (Reimer, 2013).
Methodological development
of geotechnical maps of suitability
for urbanization
Public policy for the development and application of geotechnical maps of suitability for urbanization has been implemented in Brazil, with the participation of universities and research institutes that have proposed methodological innovations to contribute to progress regarding practices in urban territorial planning. In addition to technical-scientific studies, the initiatives for geotechnical maps have included efforts to involve and commit municipal technicians to the development of
maps and the validation of results. Indeed, municipal governments are the institutions that should appropriate these studies as management tools and reference them for approving parceling projects, the expansion of urban perimeters, and the urbanization of precarious or unconsolidated settlements.
This continuous dialogue between academies and public authorities has revealed several limitations in the conventional methodologies of geotechnical maps. In general, the majority of studies of disaster susceptibility mapping have used techniques involving the vertical overlay of spatial information layers, thus conjugating the characteristics of rocks, soils, relief, and land use, among others. However, under a hydrogeodynamic landscape approach, these conventional techniques do not take into account processes with horizontal flows, such as overland and subsurface water flow, or processes that are influenced by characteristics of connectivity and proximity (Vasconcelos, 2011). For example, the following processes would not be satisfactorily addressed by techniques involving the vertical overlay of spatial layers:
c the land use of a hydrographic basin
influences areas that are susceptible to floods. In this context, the progressive spread of impervious land upstream in a basin would make the downstream valley bottoms more susceptible to more frequent and extensive flooding;
c changes in runoff drainage upslope may
cause slope destabilization and trigger mass movements.
c the land use of a hydrographic basin used
c the basis of a steep slope near a
flood-prone area may be destabilized during a flood, causing bluff collapse;
c the characteristics of accessibility and
proximity to areas of interest, as well as those of relative barriers (e.g., rivers, steep areas, and conservation areas), influence the processes of urban expansion.
Thus, it is necessary to develop methods that integrate processes of horizontal and vertical topology to more properly address the suitability of an area for urbanization in terms of its susceptibility to disasters.
Context and objectives
This paper was developed from the experience of the authors in the development of many geotechnical maps of suitability for urbanization under the financial support of the Ministry of Cities of Brazil. This paper focuses on the methodological innovations that allow better evaluation of the topology of processes in hydrographic basins, regarding their influence on susceptibility to disasters and the respective guidelines for land use. The specific objectives regarding these methodological innovations are as follows:
c use of the Shalstab (Shallow Slope Stability)
model to incorporate the influence of water flow in assessing the susceptibility of an area to landslides and correlated events;
c the delimitation of Wet Zones through
the integrated use of the Hand (Height to the Nearest Drainage) model, the geomorphological mapping of fluvial plains, and the topological criteria of neighborhoods of concave hillslopes;
c mapping the severity of socioeconomic
effects of flood events regarding the level of land occupation of basins that drain to critical flood areas;
c mapping urbanization trends based on
the neighborhood of inductive or restrictive elements to urban expansion using multivariate kernel analysis;
c discussion of perspectives on territorial
management in the face of disaster risk using the hydrographic basin analysis obtained via the aforementioned methods.
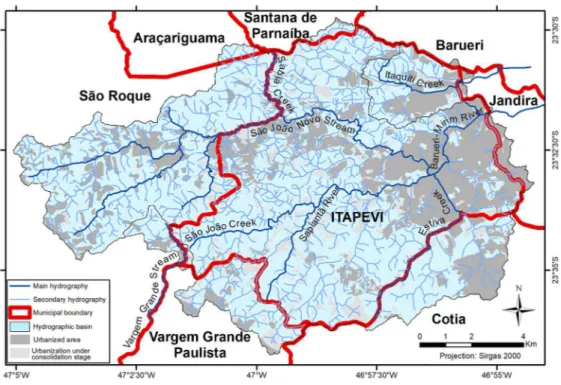
These methods are discussed based on the results obtained for the municipality of Itapevi in the State of São Paulo. The municipality of Itapevi was selected because it adequately exemplifies the causal chain of land use effects in hydrographic basins.
Methodology
Study area
Figure 1 – Location maps of the municipality of Itapevi
lies downstream of an extensive drainage area (Figure 2), and it has suffered recurrent social and economic losses due to floods.
Methods
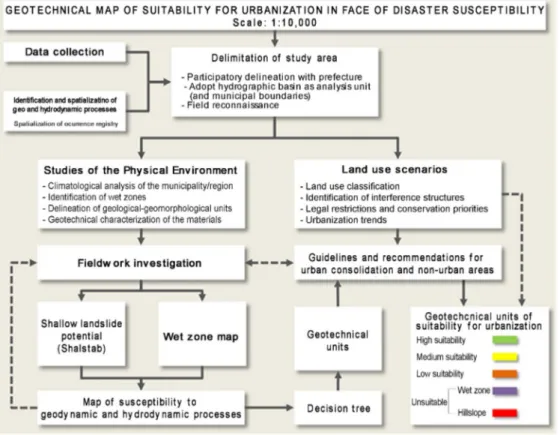
Figure 3 presents the general methodological steps used to develop the geotechnical map of the municipality of Itapevi. Within this general methodology, this paper focuses on innovative methods that facilitate basin analysis, especially in the study of susceptibility to hydrogeodynamic events and the possible
consequences of urbanization trends. Further details of the other steps, such as geomorphological mapping, land use mapping, and the mapping of legal constraints and conservation priority, can be found in Nogueira and Canil (2017a; 2017b).
Considering that the main users of geotechnical maps are urban planners, Diniz and Freitas (2013) recommended involving the technical and management teams of the municipal administration during all steps of the development of the map, i.e., as providers of information and materials during the integral development of the maps and validating their
results and guidelines. In Itapevi, the contact with the technical team of the municipality included sensitization, technical meetings and workshops. Effort was made to ensure the participation and effective involvement of managers and local technicians from various municipal fields (e.g., civil works, environment, habitation, planning, and civil defense) during all steps of the process, i.e., from the delimitation of the intervention area to the analysis of the main geotechnical-geological and hydrological processes affecting the municipal territory, as well as in developing the map design and legend. After the geotechnical map was completed, technical workshops were conducted to validate the results and to train the municipal staff on using this planning tool. This partnership allowed dialogue between researchers and government managers, thus facilitating their acquaintance with the process and its results.
Susceptibility to landslides
and correlated events
Shalstab – Mapping shallow landslide potential
As presented by Montgomery and Dietrich (1994) and Dietrich and Montgomery (1998), the Shalstab model is a predictive model that associates, on a spatial and temporal scale, areas susceptible to landslides and the hydrological regime of a basin. This model is based on the temporal relationship between the occurrence of landslide processes and the spatial influences of their conditioning factors, namely, topographic conditions, which are associated with erosive processes and the formation of fluvial channels (mostly steep
slopes with the favorable convergence of the hydraulic gradient during rainfall events); soil properties (density, hydraulic conductivity, thickness, friction angle and cohesion); and climatological patterns (rainfall intensity, distribution and duration).
The infinite slope stability model is associated with the definition of the main components and stresses that cause the destabilization of a fault plane parallel to the soil surface (Dietrich and Montgomery, 1998). The saturation zones described by Beven and Kirby (1979) and O’Loughlin (1986) define the steady-state hydrological model. In this way, the model identifies the areas of the terrain with topographic and material conditions similar to others that have been historically associated with mass movement processes, thus spatially indicating the areas that are stable and unstable under certain rainfall conditions. Equation 1 integrates the aforementioned methods:
Equation 1 – Shallow Landslide Stability Model
where:
q = rainfall, in mm/day;
T = soil transmissivity, in m²/day;
θ = slope, in degrees (°); a = area of contribution, in m²;
b = contour length of the lower border of each element, in m;
c = effective cohesion of the soil, in N/m2; rs = soil density, in kg/m³;
rw = water density, equal to 1000 kg/m³; g = acceleration of gravity, equal to 9.8 m/s²; z = soil thickness, in m;
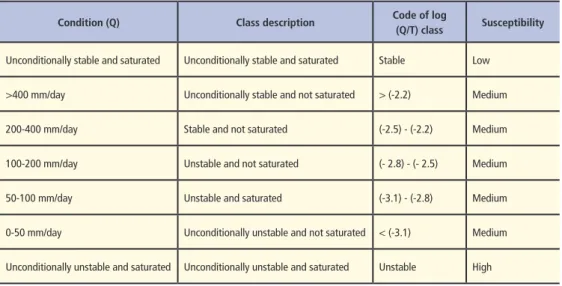
The statistical model quantifies the susceptibility based on a triggering event; in this case, this event represents rainfall. The model analyzes the topographic conditions to infer the convergence zones of water flows and the saturation points of the soil. Based on the soil properties, it is possible to mathematically define the carrying capacity of each spatial unit (pixels). The values are represented as a function of the hydrological ratio of the log (Q/T), in which a constant T value is attributed to the entire information base in relation to the Q condition. Table 1 defines the classes of susceptibility.
S a m p l e c o l l e c t i o n a n d g e o t e c h n i c a l characterization
The model was executed in Saga GIS software, using the digital terrain model (DTM) of Instituto Geográfico e Cartográfico de São Paulo – IGC (2017), with a spatial resolution of 5 meters and geotechnical parameters specified by spatial units. Representative samples of each geological unit were collected. Each soil was described first in situ and then in the laboratory using visual-tactile identification to estimate its typology, texture, and main mineralogy and thus to infer information about the geomechanical behavior of the soil.
Condition (Q) Class description Code of log
(Q/T) class Susceptibility
Unconditionally stable and saturated Unconditionally stable and saturated Stable Low
>400 mm/day Unconditionally stable and not saturated > (-2.2) Medium
200-400 mm/day Stable and not saturated (-2.5) - (-2.2) Medium
100-200 mm/day Unstable and not saturated (- 2.8) - (- 2.5) Medium
50-100 mm/day Unstable and saturated (-3.1) - (-2.8) Medium
0-50 mm/day Unconditionally unstable and not saturated < (-3.1) Medium
Unconditionally unstable and saturated Unconditionally unstable and saturated Unstable High
The calibration of the geotechnical-hydrological model of Shalstab was performed by reviewing technical studies on the source material of each mapped geotechnical unit, performing fieldwork, assessing the parameters obtained in laboratory investigations, and obtaining empirical knowledge about the characteristics of the weathering cover (rock-alteration mantle) in the region. Following the framework of Nogami and Villibor (1995), the peculiarities of tropical soils (e.g., heterogeneity, mineralogical variations, grain forms) that exert great influence on their geomechanical behavior were considered. In this way, it was possible to estimate the best input values for the model in terms of the geomechanical characteristics of the soil, including its effective cohesion (c), effective friction angle, natural and saturated soil density, and hydraulic conductivity (K). In scenarios created to simulate different depths,
the saturated specific masses of the soils were used to infer the conditions of the greater contribution of the soil weight and the most unfavorable critical geomechanical parameters.
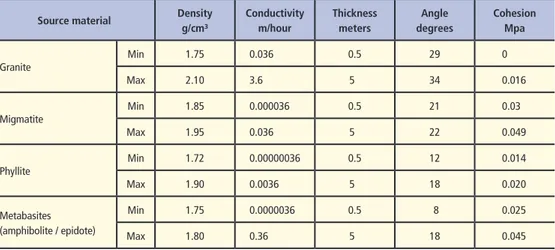
Soil characteristics exert a great influence on the stability of slopes because they change the soil resistivity and its capacity to transmit the water that infiltrates into the soil during rainfall events. Considering the total extent of the study area, the relative complexity of the observed processes in each geological-geomorphological unit in the region, the inherent limitations of fieldwork investigations and the quality of the geotechnical event database, it was necessary to include some methodological adaptations in the modeling approach. In this context, the soil parameters were associated with the spatial limits of each geological unit, thus defining its minimum and maximum values. Table 2 presents the normalized values.
Source material Density g/cm³
Conductivity m/hour
Thickness meters
Angle degrees
Cohesion Mpa
Granite
Min 1.75 0.036 0.5 29 0
Max 2.10 3.6 5 34 0.016
Migmatite
Min 1.85 0.000036 0.5 21 0.03
Max 1.95 0.036 5 22 0.049
Phyllite
Min 1.72 0.00000036 0.5 12 0.014
Max 1.90 0.0036 5 18 0.020
Metabasites (amphibolite / epidote)
Min 1.75 0.0000036 0.5 8 0.025
Max 1.80 0.36 5 18 0.045
The next steps included obtaining simulations with the data and analyzing the spatial distributions of the classes obtained in Shalstab. This model allowed us to compare the behaviors of distinct lithologies and, by considering the influence of the topography, to categorize the model classes in terms of their different levels of susceptibility to landslides and correlated event processes. The classes of susceptibility associated with each landslide and correlated event process followed the values presented in Table 1. The validation of the results was conducted through fieldwork and the qualitative assessment of coherence with the maps of the geological-geomorphological units of the study area.
Delimitation of Wet Zones
Conceptualization
Wet Zones are characterized by the availability, saturation and accumulation of water in the soil (inferred by the relationship between the depth of the phreatic level and the height to the water course), which are associated with other parameters, such as susceptibility to flood processes (floodplains) and riparian zones (defined as permanent preservation areas by Brazilian environmental legislation), which, occupied or not, affect the hydrological dynamics of the hydrographic basin (Varallo et al., 2016). Considering the hydrodynamics and hydro-ecology of these zones, in terms of the maintenance of ecosystem services (i.e., considering droughts and floods), these zones play important roles in maintaining water quantity and quality because they operate as filters for pluvial waters, runoff
and subsurface flow (Tundisi and Tundisi, 2010; Liu et al., 2013).
Although Wet Zones are inherently related to the hydrographic network, their precise boundaries are not easily determined. Their lateral boundaries conventionally include floodplains. However, the processes that continuously sculpt their fluvial geomorphology, including flood recurrence on annual, decennial and even century timescales, as well as the instantaneous timescales of runoff flows, make it necessary to consider the terrains subjected to other processes in the definition of Wet Zones, such as sites of runoff convergence and the exudation of the phreatic level (Gregory et al., 1992; Lima and Zakia, 2017). For example, the saturated zone of a micro-basin can expand considerably into surrounding springs or even during a rainfall event, which implies the need to also consider the concave areas that are adjacent to the headwaters as integral parts of Wet Zones (Lima and Zakia, 2017). In this context, this paper considers Wet Zones to comprise floodplains and the following areas:
a) Zones that surround streams and their headwaters, which may expand during prolonged rainfall (riparian zones1); and
b) Terrain concavities, to which flow lines converge, such as the concavities frequently found around headwaters (and along riparian zones).
To differentiate the lands subjected to the characteristic processes of hillslopes from those recurrent in plains, all Wet Zones were subdivided into two zones:
1) Hillslope Wet Zones – HWZ 2) Plain Wet Zones – PWZ
contrast, hillslope Wet Zones exhibit a relevant intersection between landslides and correlated events and hydrodynamic processes. In addition to being potentially susceptible to flash floods, the bases of hillslopes exhibit a concentration of humidity (especially in concave areas) that can lead to their destabilization, causing bluff collapse and mass movements.
Delimitation of Wet Zones
The delimitation of Wet Zones follows that proposed by Varallo et al. (2017). The Hand model (Rennó et al., 2008; Nobre et al., 2011) was used as the main indicator of the delimitation of Wet Zones. The Hand model yields an integrated analysis of hydrography and geomorphology based on the water flows over a digital terrain model. This model was developed to analyze the distinct responses of riparian vegetation in terms of the water dynamics related to watercourses, and it can be used to delimit both Wet Zones and zones with susceptibility to flooding. The DTM and hydrography of IGC (2017), used in the Shalstab model, were also used as the cartographic input for the Hand model.
The procedural sequence begins by reconditioning the DTM using the Agreedem method (Hellweger, 1997) available in the HydroTools extension of ArcGis software, which consists of “entrenching” the DTM under its respective hydrography paths to make the runoff flows in the DTM compatible with the previously delineated watercourses. The next procedure is to fill the DTM sinks, thus indicating the lowlands where runoff water tends to accumulate. The last stage is to generate the water flow directions over the DTM raster. After this sequence,
the Hand indicator is generated using the software provided by ANA (Agência Nacional de Águas – National Water Agency).
Defining the coverage of the Wet Zone from the Hand model essentially depends on the adopted threshold for the height in relation to the nearest water course. This threshold delimits the boundaries that would be achieved by floods in extreme rainfall events. To validate this threshold, fieldwork visits were conducted to planned sites where flood marks were investigated. The selection of sites took into account the following criteria:
• the concentrations of flood, overflow,
and riverbank collapse registered by the Civil Defense of the municipality;
• the floodplains delimited in the
geomorphological map at a scale of 1:10,000, developed in the same research project, conjugated to the flood susceptibility map of IPT (2013) at a scale of 1:25,000;
• the polygons obtained through HAND
modeling at different heights; and
•thecriticalsitesindicatedbythemunicipal
government.
Using the same DTM, the general curvature of the terrain was modeled. Based on fieldwork validation, concave areas were defined as those with curvature values of less than -0.004. This threshold identified areas with greater entrenchment and water accumulation, thus characterizing several headwaters/springs (Galera et al., 2017).
concavities”, representing the concave areas contiguous to Hand Wet Zones or located up to 30 meters away from them; and “isolated concavities”, representing the areas located more than 30 meters from Hand Wet Zones. This last class was not considered to represent Wet Zones.
An additional criterion to characterize Wet Zones was adopted when the Wet Zone coincided with the floodplains delimited by the geomorphological mapping. The criteria for floodplain mapping included adjacent areas to rivers with slopes of less than 3%, relief amplitudes of less than 20 meters and height to the river (Hand) values of up to 2 meters. Areas that fit the criteria of slope and relief amplitude but were higher than 2 meters above the river level were classified as terraces.
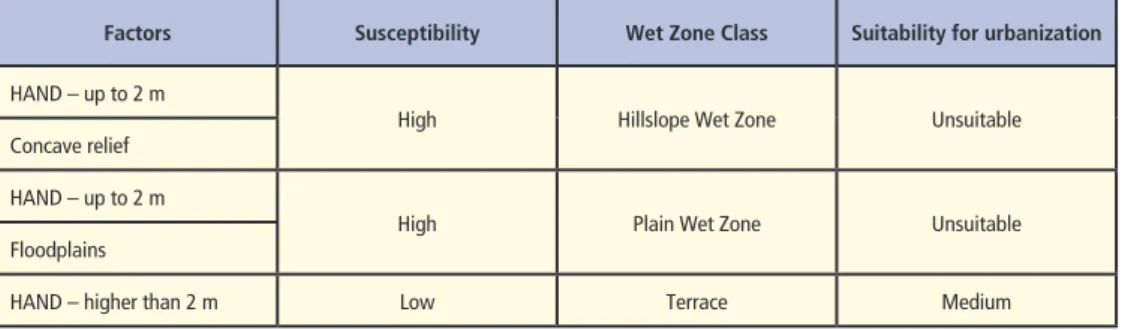
Table 3 presents the final classification obtained by combining the entire database.
Information overlay for mapping geotechnical units
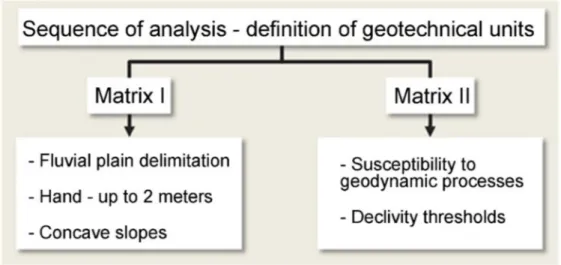
The overlay matrix used for the geotechnical map took into account the distinct variables from processes occurring on
Wet Zones and those occurring in areas where landslides and correlated events predominate (Figure 4). The combination of these variables used a multivariate analytical modeling approach referred to as a decision tree, which is available in ENVI software. The classification algorithm applies a multilevel binary analysis with questions and respective answers (Yes or No) according to the variables defined by the process manager. The tool works based on rules that segment each pixel of the map based on the criteria of each node of the function. The tree begins with a unique node, defined as the “root node”; departing from it, all of the following nodes are defined as “child nodes”. The terminal nodes of the tree, i.e., nodes that do not harbor other “child nodes”, are denominated “leaves”, and they represent the distinct outputs of the decision tree. According to Halmeschlager (2004), an object is classified based on a route from the root to the leaf, and its characteristics satisfy all the nodes and their linkages along the route. The classes that emerge from the end of the tree are “leaves” because they represent the final classification at the end of the process.
Factors Susceptibility Wet Zone Class Suitability for urbanization
HAND – up to 2 m
High Hillslope Wet Zone Unsuitable
Concave relief
HAND – up to 2 m
High Plain Wet Zone Unsuitable
Floodplains
HAND – higher than 2 m Low Terrace Medium
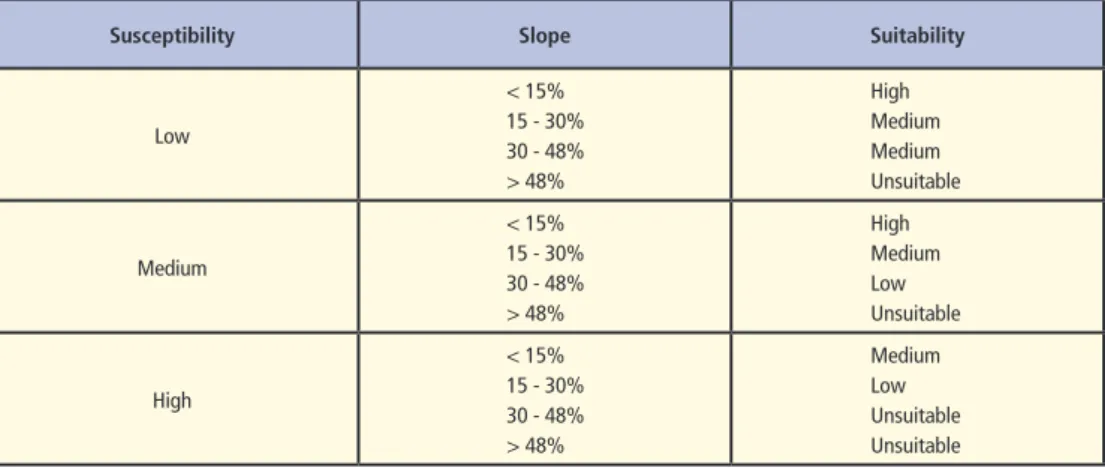
The geotechnical units associated with the landslides and correlated event processes used the results of the Shalstab model combined with the slope classes (Table 4). The combination of the results of the Shalstab model with the slope classes is conceptually justified because the suitability for urbanization considers not only landslides but also suitability for the implantation of urban road infrastructure. This combination resulted in the best validation based on fieldwork verification. Figure 5 shows the combination matrix and the output classes of the decision tree. For example, if one pixel (geotechnical unit) corresponds to an output of “no” for low susceptibility for landslides followed by an output of “no” for medium susceptibility,
then it is implicitly recognized as having high susceptibility, and, depending on the answers to the questions regarding the slope, it will be assigned to the appropriate class of urbanization suitability.
The appropriate number of classes of urbanization suitability was discussed extensively during workshops with municipal government teams. Many participants, when evaluating previous versions of geotechnical maps, criticized the large number of classes, which added too much information to the maps and hampered the identification of spatial patterns, compromising their ease of use. The framework of classes presented in this paper was selected by consensus as the best classification.
Susceptibility Slope Suitability
Low
< 15% 15 - 30% 30 - 48% > 48%
High Medium Medium Unsuitable
Medium
< 15% 15 - 30% 30 - 48% > 48%
High Medium Low Unsuitable
High
< 15% 15 - 30% 30 - 48% > 48%
Medium Low Unsuitable Unsuitable
Table 4 – Classification of the geotechnical units associated with geodynamic processes
Critical flood basins
A participatory mapping methodology was adopted to map critical flood areas and their respective drainage basins. Initially, the Municipal Civil Defense provided a registry of flood occurrences from 2006 to 2016. These punctual occurrences were georeferenced and visualized on a base map with the urbanized areas, hydrography and toponymy of neighborhoods, rivers and roads. On this printed map, civil defense technicians delineated the critical areas where major flood-related problems have occurred. These areas were characterized based on their flood recurrence and its severity (high, medium or low) in terms of their social and economic losses.
After this participatory mapping, the drainage basin of each critical flood area was delimited using the algorithm of watershed delineation for polygons (available in the HydroTools extension of ArcGis). To visualize the effects of land use on flood areas, a simple weight (1 for low, 2 for medium and 3 for high-severity areas) was attributed to each flood area and propagated upstream to its drainage area. Thus, a basin that contributes to two critical flood areas would receive an accumulated severity value equivalent to the sum of the weights of these two respective flood areas.
Urbanization trends
Land use mapping
The reference used for land use mapping was a previous land use map developed for Itapevi by Emplasa in 2003. Changes in land use
were analyzed through the photointerpretation of satellite images obtained from Rapid Eye during a rainy period (11 November 2013) and a drought period (3 August 2012) and an orthophoto of 2015 obtained from Digital Globe. In unclear cases, the Google Street View system and fieldwork visits were used.
Inductors of urbanization
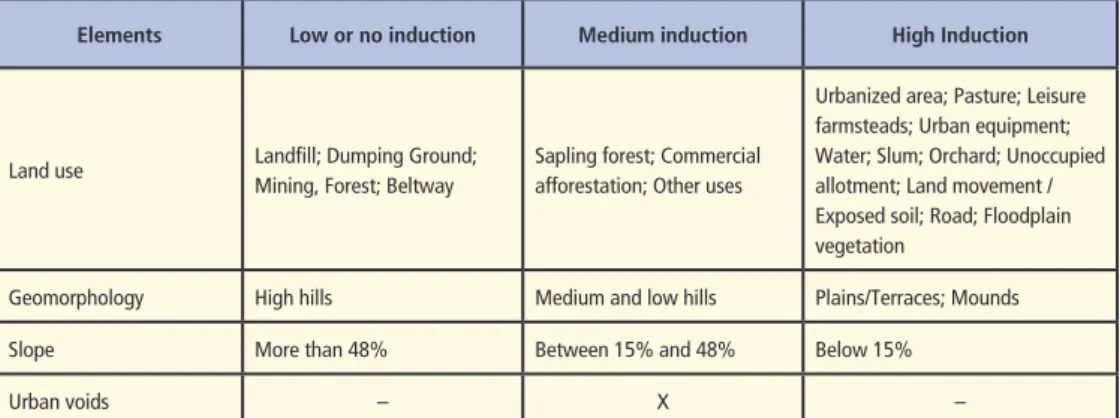
The method of urbanization trend mapping followed that proposed by Costa and Leite (2017). A survey of occupation inductors that can indicate possible urbanization trends was conducted. Table 5 presents the inductors and their respective levels of induction. The physical environmental factors that were evaluated were slope and geomorphology, and the social factor was land use. The barriers for occupation trends were rivers wider than 10 meters, railroads and large highways.
Criteria for colors in map legends
During the evaluation of the geotechnical maps by the municipal government staff, it was emphasized that these maps should be able to be read by people with colorblindness (e.g., Daltonism). This precaution would increase the accessibility of these maps, as it is estimated that 8% of men and 1 in every 200 women have some type of colorblindness (National Eye Institute, 2015). In the cartography of risk areas, it is common to use a color system in which “hot” hues (such as red) gradually change to colors with “colder” hues (e.g., yellow, then followed by green). However, people with colorblindness have difficulties distinguishing between the hues of red, yellow and green.
The colorblindness-friendly color schemes proposed by the ColorBrewer system (Harrower and Brewer, 2012) and Brewer (2015) provided starting points, but they have not always guaranteed satisfactory results.
Although colorblindness simulators, such as Coblis (Wickline, 2016), greatly assisted in the development of the maps, a final validation with colorblind people was still necessary.
For the maps displayed in this paper, the basic guideline was to replace the hot/cold color gradation scheme by a gradation scheme with a single hue (red, which is intuitively connected to risk) with saturation and tonality (brightness) gradations, such that the color would gradually change from dark red to pure white. In this approach, although the colorblind reader might not see the exact red hue, he/ she would still be able to distinguish between the darkness and brightness level of each class. The classes associated with hydrological phenomena used gradations (dark to light) of blue hues (intuitively linked to water), and the secondary typologies and elements used gray gradations (intuitively linked to neutral elements), as blue and gray can usually be seen without problems by colorblind people.
Elements Low or no induction Medium induction High Induction
Land use Landfill; Dumping Ground;
Mining, Forest; Beltway
Sapling forest; Commercial afforestation; Other uses
Urbanized area; Pasture; Leisure farmsteads; Urban equipment; Water; Slum; Orchard; Unoccupied allotment; Land movement / Exposed soil; Road; Floodplain vegetation
Geomorphology High hills Medium and low hills Plains/Terraces; Mounds
Slope More than 48% Between 15% and 48% Below 15%
Urban voids – X –
Results and discussion
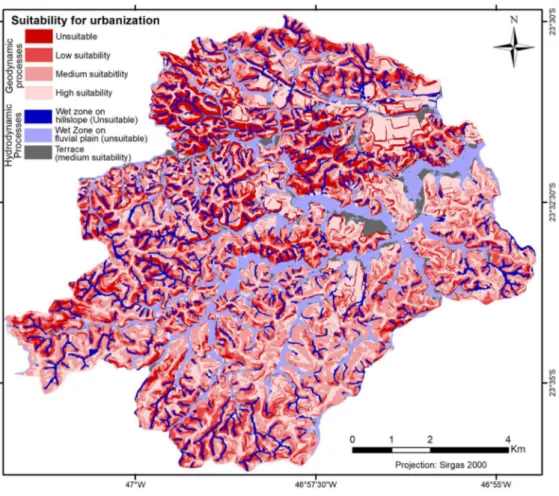
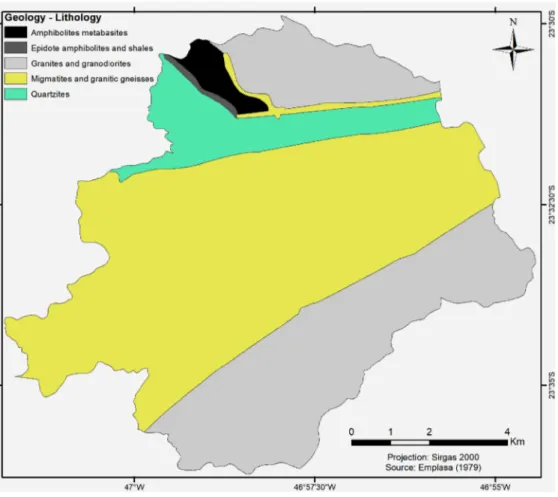
Suitability to urbanization
Figure 6 shows the map of suitability for urbanization accompanied by the geology/ lithology map (Figure 7). The northern region of the municipality, with the highest declivity, encompasses most of the unsuitable areas. The headwaters and river courses on the left bank of the São João Novo Stream represent areas of low suitability for urbanization, with high susceptibility to landslides and correlated events in the high hills underlain by quartzites and in the higher and lower hills comprising migmatites and granitic gneisses. In the downstream stretch, the fluvial plain of the São João Novo Stream is unsuitable for urbanization, as it exhibits high susceptibility to hydrodynamic processes.
In the northernmost region, in the areas near the Castelo Branco highway, there are high and low hills supported by granites and granodiorites, characterizing sectors with high suitability for urbanization because they have low susceptibility to landslides and correlated processes. To the left bank of the Barueri-Mirim River, there are areas of low suitability, with areas of high susceptibility on the high hills associated with migmatites and gneisses. In contrast, in its headwaters, there are areas with better suitability, as there are regions of low susceptibility in the medium hills with a rocky substrate composed of migmatites; notably, these areas are characterized by a high occupation density. At the confluence of the São João Novo and Barueri-Mirim rivers, there is an extensive fluvial plain with high susceptibility
to flooding, where frequent flood occurrences have been reported to affect extensive urban areas (Figure 2).
At the headwaters of the São João creek and the Sapiantã stream, areas with medium suitability and susceptibility dominate, interspersed between areas of low suitability related to high susceptibility to landslides and correlated processes, with high and low hills supported by migmatites and granitic gneisses. Many stretches of the Sapiantã stream have extensive unsuitable areas with high susceptibility to flood.
To the south and southeast of the municipality, highly suitable areas with low susceptibility are predominant, extending up to the central area, which has a high occupation density and a rocky substrate of granite and granodiorite.
Basins of critical flood areas
sufficient to manage all local problems, and it indicates that basin management instruments (such as basin committees and agencies) may be complementary alternatives to address these types of situations. It is also noteworthy that 35% of the drainage areas of the critical flood areas of Itapevi extend beyond its municipal boundaries.
The critical flood areas are concentrated in the conf luence region of the main watercourses (São João Novo Stream, Sapiantã River, Barueri-Mirim River) and coincide with the zones of high and medium occupation density, which also have characteristically low permeability, thus contributing even more to the occurrence of these processes. The
Civil Defense reported that frequent floods in the Barueri-Mirim River, in the central urban area, are the main concern of the municipality because of the significant social and economic losses associated with them. The flood with the greatest losses occurred in March 2014, although another significant flood occurred in 2016. To avoid new floods, civil works of channel entrenching have been conducted in the Barueri-Mirim River, within the urbanized area of the municipality. However, the progressive occupation and impermeabilization of the drainage basin upstream from these flood sites would cause the flood flow in the central urban area to increase even more.
It is important to emphasize that the map in Figure 8 only delineates the areas that have already experienced severe social and economic losses due to recurrent floods. If urbanization spreads over other Wet Zones of fluvial plains, new critical flood areas may emerge. Moreover, the spread of impermeable or degraded soils in upstream Wet Zones could increase the extension and recurrence of flooding in the areas that have already been delineated.
Urbanization trends
From the viewpoints of urban planners and municipal technical staff, it is desirable to infer in what directions and to which localities urbanization processes will extend. The impacts of urbanization, especially in the physical environment, can modify the local hydrological regime, as discussed in the previous sections of this paper. Therefore, understanding the directions of urban expansion may help the municipality not only in terms of risk management but also for other purposes, such as predicting housing pressure in certain areas and determining the need to deploy new urban infrastructure.
The map in Figure 9 presents the urbanization trends in Itapevi. Extensive plain areas (with high suitability for urbanization in Figure 6) and areas with a high tendency for urbanization are found in the Sapiantã River Basin, a tributary of the Barueri-Mirim River, but its occupation would cause an even greater impact on the currently existent critical flood areas downstream from it.
The fieldwork performed to the north of the São João Novo Stream revealed the expansion of low-income households; as this is a region with high declivity and entrenched valleys, houses in this region tend to mostly be concentrated at the river margins, thus increasing their exposure to flash floods of high kinetic energy. Furthermore, it is important to conserve the remnant forest on these hillslopes to prevent the peak flow from increasing in both these areas occupied by a low-income population and those downstream, as the São João Novo Stream contributes to the Barueri-Mirim River, where the main flood problems in the central urban area of the municipality occur.
Disaster risk management and river
basin management
delineate the suitability of land use as a function of its hydrological integrity.
Maps of suitability for urbanization have focused on delimiting areas that are exposed to diverse risks regarding flood events and geotechnical processes. However, one important aspect of land use planning exemplified in this paper is the effect of impermeable land spread on runoff, which can worsen critical areas that already have suffered social and economic losses due to recurrent floods and urban drainage problems. Thus, it
is important to consider land use guidelines determined based on the drainage topology of critical areas.
Based on the analysis of the main municipal legislative framework of territorial management, it is possible to define the criteria that directly influence drainage systems:
c land use: general aspects of municipal
masterplans and correlated laws that aim to guide land use and organize drainage, void areas, afforestation, permeability, land use parameters, and the use of indexes and
coefficients such as the occupancy rate, permeability rate, and demographic and building density;
c Civil works code: guidelines for deploying
drainage infrastructure, pluvial water use, and the permeability and occupancy rate of allotments.
The pertinent municipal legislation of Itapevi has not yet assessed all the indexes and guidelines that have direct or indirect impacts on drainage. The municipal legislation foresees guidelines regarding drainage and urban afforestation, but there is no specific regulation regarding its occupancy rate, permeability rate, permeability , density of land use zones,
maintenance of void areas, runoff flow and pluvial water use (DAEE, 2012). Furthermore, contemplating the relevant criteria is not sufficient to evaluate the impact of these laws in the study area. This evaluation depends on the impact of these laws on land use and the effectiveness of their implementation by a public power.
In this context, some structural and non-structural measures are proposed in Table 6, with the goal that the parameters still not covered by municipal legislation could be inserted into the legal framework, thus allowing for the safe management of possible drainage problems in areas subject to urbanization.
Typology
of the drainage area Scale / action level Non-structural measures Structural measures
c Urbanized drainage area
c Drainage area under
urban consolidation
c Non-urbanized drainage
area
Lots c Reduce occupancy rate;
c Increase permeability rate.
c Pluvial water use;
c Green roofs.
Blocks, areas or urban zones
c Control demographic and
building density by land use zones;
c Increase permeable areas within
the zones (parks, squares, terrains with vegetation or forest cover).
c Forbid new occupation until new
studies of the drainage area are completed.
c Deployment and maintenance of
drainage systems;
c Planting urban trees and
implementing green areas;
c Permeable pavements or those
with infiltration systems instead of just drainage;
c Rain gardens or bioretention
structures that receive runoff and accumulate its excess, forming puddles that gradually infiltrate the soil.
Studies
c Systematize trends and land use
scenarios in the drainage basin;
c Hydraulic and hydrologic
modeling in the drainage basin;
c Define an ideal threshold for
permeability in the basin.
c Include integrated analysis of
drainage and green infrastructure in urbanization projects.
Final reflections
A map of inductors and possible urbanization trends can help a municipal government review its masterplan; for example, it can assist in defining the directions of urban expansion. One of the objectives of this map is to complement the information provided by the other maps discussed in this paper. When occupation trends are analyzed together with a geotechnical map of suitability for urbanization and a map of critical flood areas, it is possible to identify zones that may increase disaster risk; these areas are relevant targets for projects and increased attentive surveillance. The integrated analysis of these mapping products in Itapevi showed possibilities for the integration of risk management with basin management. Conducting training and technical workshops with municipal managers was important for them to comprehend the meaning and use of this territorial management tool to avoid the emergence of new areas of risk and to develop and adopt measures to minimize the occurrence and impacts of new landslides and correlated events and hydrodynamic processes.
In future studies, the unsuitability for urbanization of Wet Zones should be further detailed at additional levels. For example, different levels of the Hand model could be calibrated with fieldwork to differentiate distinct degrees of flood susceptibility. Morphometric characteristics of the drainage area (such as basin area, shape and upstream slope), if generated for each pixel in a digital elevation model, could aid in this calibration. The calibrated morphometric indexes could also be used to better characterize the map of drainage basins of critical flood areas.
It is expected that geotechnical maps of suitability for urbanization should be used together with the other management tools indicated by Federal Law n. 12.608 of 2012, namely, the susceptibility map of landslides and correlated events and hydrodynamic processes, the map of risk areas, or the Municipal Disaster Risk Reduction Plan. The information presented in these tools should be incorporated into the development of new masterplans or in revisions of existing plans. These maps are also relevant for analyzing and making decisions about land parceling, performing urbanization projects in areas under consolidation, and planning measures and civil works to prevent and mitigate risks.
Acknowledgments
The authors thank the professors, researchers and students of the Risk Management Laboratory of the Federal University of ABC who worked in the development of the geotechnical maps of suitability for urbanization. The authors acknowledge that the innovations and reflections presented in this paper emerged through the teamwork of these dozens of collaborators during the period between 2015 and 2018. Additional thanks to the Ministry of Cities of Brazil for the financial support of these research projects.
[I] https://orcid.org/0000-0002-3063-2776
Universidade Federal do ABC, Centro de Engenharia, Modelagem e Ciências Sociais Aplicadas. Santo André, SP/Brasil.
[II] https://orcid.org/0000-0002-9724-5375
Universidade Federal do ABC, Centro de Engenharia, Modelagem e Ciências Sociais Aplicadas, Programa de Pós-Graduação em Planejamento e Gestão do Território. Santo André, SP/Brasil. [email protected]
[III] https://orcid.org/0000-0001-9599-3903
Universidade Federal do ABC, Centro de Engenharia, Modelagem e Ciências Sociais Aplicadas, Programas de Pós-Graduação em Ciência e Tecnologia Ambiental, e Planejamento e Gestão do Território. Santo André, SP/Brasil.
[IV] https://orcid.org/0000-0003-0814-4984
Universidade Federal do ABC, Centro de Engenharia, Modelagem e Ciências Sociais Aplicadas. Santo André, SP/Brasil.
Note
(1) Riparian zones are areas of permanent or temporary hydric saturation, and their main role is to protect the water resources of a micro-basin (Atanásio et al., 2012).
References
ATTANASIO, C. M.; GANDOLFI, S.; ZAKIA, M. J.; VENIZIANI JUNIOR, J. C. T. e LIMA, W. P. (2012). A importância das áreas ripárias para a sustentabilidade hidrológica do uso da terra em microbacias hidrográficas. Bragantia, v. 71, pp. 493-501.
BEVEN, K. J. and KIRKBY, M. J. (1979). A physically based, variable contributing area model of basin hydrology. Bulletin of Hydrological Sciences, v. 24, pp. 43-69.
COSTA, F. C. e LEITE, M. A. P. (2017). Mapa de tendência à ocupação como auxílio à Carta Geotécnica de Aptidão à Urbanização: experiência do município de Ribeirão Pires – SP. In: WORKSHOP BRASILEIRO PARA AVALIAÇÃO DE AMEAÇAS, VULNERABILIDADES, EXPOSIÇÃO E REDUÇÃO DE RISCO DE DESASTRES, I. Anais. São Bernardo do Campo, BRAHVE, Cemaden.
DAEE – DEPARTAMENTO DE ÁGUAS E ENERGIA ELÉTRICA (2012). Plano Diretor de Macrodrenagem do Alto Tietê (PDMAT 3). São Paulo.
DIETRICH, W. E. and MONTGOMERY, D. R. (1998). Shalstab: a digital terrain model for mapping shallow landslide potential. Berkeley, NCASI (National Council of the Paper Industry for Air and Stream Improvement). Technical Report.
DINIZ, N. C. and FREITAS, C. G. L. (coord.) (2013). “Cartografia geotécnica”. In: COUTINHO, R.Q. (coord. geral e org.). Parâmetros para a cartografia geotécnica e diretrizes para medidas de intervenção de áreas sujeitas a desastres naturais. Brasília, Ministério das Cidades/GEGEP/UFPE.
GALERA, R. A.; BRITO, C. O.; CAMPOS, F. S.; ANTUNES, J. S. and CANIL, K. (2017). Modelo digital de curvatura côncava para determinação de unidades geotécnicas de aptidão à urbanização. In: XVIII SIMPÓSIO BRASILEIRO DE SENSORIAMENTO REMOTO. Anais. Santos/SP.
GREGORY, S. V.; SWANSON, F. J.; McKEE, W. A. and CUMMINS, K. W. (1992). An ecosystem perspective of riparian zones. BioScience, v. 41, n. 8, pp. 540-551.
HARROWER, M. and BREWER, C. A. (2011). “ColorBrewer.org: an online tool for selecting colour schemes for maps”. In: DODGE, M.; KITCHIN, R. and PERKINS, C. (eds.). The map reader: theories of mapping practice and cartographic representation. New Jersey, John Wiley & Sons.
HELLWEGER, F. (1997). AGREE-DEM surface reconditioning system. University of Texas. Available at: http://www.ce.utexas.edu/prof/maidment/gishydro/ferdi/research/agree/agree.html. Accessed on; 27 jan 2018.
IGC – INSTITUTO GEOGRÁFICO E CARTOGRÁFICO (2017). Relatório de verificação dos produtos e geração do modelo digital de terreno (MDT) do projeto do Estado de São Paulo. Available at: http://geoportal.igc.sp.gov.br/download_temporario/zxcer/XZXXZXZZXl1a_l.pdf. Accessed on: 19 jan 2018.
INSTITUTO DE PESQUISAS TECNOLÓGICAS DO ESTADO DE SÃO PAULO – IPT (2013). Carta de Suscetibilidade a Movimentos Gravitacionais de Massa e Inundações - Relevo - Município de Itapevi - SP. São Paulo.
LIMA, W. P. and ZAKIA, M. J. B. (2017). Hidrologia de matas ciliares. Instituto de Pesquisas e Estudos Florestais. Available at: http://www.ipef.br/hidrologia/mataciliar.asp. Accessed on: 28 nov 2017 LIU, S.; CROSSMAN, N.; NOLAN, M. and GHIRMAY, H. (2013). Bringing ecosystem services into integrated
water resources management. Journal of Environmental Management, v. 129, pp. 93-102. MONTGOMERY, D. R. and DIETRICH, W. E. (1994). A physically-based model for topographic control on
shallow landsliding. Water Resources Research, v. 30, n. 1, pp. 1153-1171.
NATIONAL EYE INSTITUTE (2015). Facts about colorblindness. Available at: https://nei.nih.gov/health/ color_blindness/facts_about. Accessed on: 22 jan 2018.
NOGAMI, J. S. and VILLIBOR, D. F. (1995). Pavimentação de baixo custo com solos lateríticos. São Paulo, Vilibor.
NOGUEIRA, F. R. and CANIL, K. (coord.) (2015). Carta geotécnica de aptidão à urbanização: instrumento de planejamento para prevenção de desastres naturais nos municípios de Rio Grande da Serra e São Bernardo do Campo, Região do Grande ABC, Estado de São Paulo. Santo André, Universidade Federal do ABC. Relatório Parcial.
______ (coords.) (2016). Carta geotécnica de aptidão à urbanização: instrumento de planejamento para prevenção de desastres naturais nos municípios de Santo André e na Estância Turística de Ribeirão Pires, Região do Grande ABC, Estado de São Paulo. Santo André, Universidade Federal do ABC. Relatório Parcial.
______ (coords.) (2017a). Carta geotécnica de aptidão à urbanização: instrumento de planejamento para prevenção de desastres naturais nos municípios de Caieiras, Itapecerica da Serra, Itapevi e Santana de Parnaíba, Estado de São Paulo. Santo André, Universidade Federal do ABC. Relatório Parcial.
______ (coords.) (2017b). Carta geotécnica de aptidão à urbanização: instrumento de planejamento para prevenção de desastres naturais nos municípios de Caieiras, Itapecerica da Serra, Itapevi e Santana de Parnaíba, Estado de São Paulo. Santo André, Universidade Federal do ABC. Relatório Final.
O’LOUGHLIN, E. M. (1986). Prediction of surface saturation zones in natural catchments by topographic analysis. Water Resources Research, v. 22, n. 1, pp. 794-804.
PRANDINI, F. L.; FREITAS, C. G. L. and NAKASAWA, V. A. (1992). A cartografia geotécnica na prevenção e mitigação dos impactos ambientais. Anuário do Instituto de Geociências. Rio de Janeiro, v. 15, pp. 173-180.
REIMER, M. (2013). Planning cultures in transition: sustainability management and institutional change in spatial planning. Sustainability, v. 5, pp. 4653-4673. DOI: 10.3390/su5114653
RENNÓ, C. D.; NOBRE, A. D.; CUARTAS, L. A.; SOARES, J. V.; HODNETT, M. G.; TOMASELLA, J. and WATERLOO, M. J. (2008). HAND, a new terrain descriptor using SRTM-DEM: mapping terra-firme rainforest environments in Amazonia. Remote Sensing of Environment, v. 112, n. 9, pp. 3469-3481. SILVA, J. A. A.; NOBRE, A. D.; MANZATTO, C. V.; JOLY, C. A.; RODRIGUES, R. R.; SKORUPA, L. A; NOBRE,
C. A.; AHRENS, S.; MAY, P. H.; SÁ, T. D. A.; CUNHA, M. C. and RECH FILHO, E. L. (2012). O Código Florestal e a Ciência: contribuições para o diálogo. São Paulo, Sociedade Brasileira para o Progresso da Ciência SBPC.
SOBREIRA, F. G. and SOUZA, L. A. (2012). Cartografia geotécnica aplicada ao planejamento urbano. Revista Brasileira de Geologia de Engenharia e Ambiental, v. 2, n. 1, pp. 79-97.
TUNDISI, J. G. and TUNDISI, T. M. (2010). Impactos potenciais das alterações do Código Florestal nos recursos hídricos. Biota Neotrop, v. 10, n. 4, pp. 67-75.
VARALLO, L. S. S; SCHULT, S. I.; VASCONCELOS, V. V.; GALERA, R .A.; CANIL, K.; DANTAS, C. G.; MORAIS, R. S. and CAMPOS, F. S. (2017). Cartas de aptidão à urbanização na região metropolitana de São Paulo: experiência na definição de áreas úmidas. In: II CONGRESSO BRASILEIRO DE REDUÇÃO DE RISCOS E DESASTRES. Anais. Rio de Janeiro, Universidade do Estado do Rio de Janeiro.
VASCONCELOS, V. V. (2011). From zoning to territorial environmental management: environmental vulnerability mapping to the mining impacts in Minas Gerais Northern Region – Brazil. Boletim de Geografia – UEM, v. 29, n. 2, pp. 59-74.
WICKILINE, M. (2016). Color Blindness Simulator. Available at: http://www.color-blindness.com/ coblis-color-blindness-simulator/. Accessed on: 21 jan 2018.