SABINA CERRUTO RIBEIRO
ESTOQUE DE BIOMASSA E CARBONO EM CERRADO E EM PLANTIO COMERCIAL DE EUCALIPTO NO ESTADO DE MINAS GERAIS
Tese apresentada à Universidade Federal de Viçosa, como parte das exigências do Programa de Pós-Graduação em Ciência Florestal, para obtenção do título de Doctor Scientiae.
VIÇOSA
SABINA CERRUTO RIBEIRO
ESTOQUE DE BIOMASSA E CARBONO EM CERRADO E EM PLANTIO COMERCIAL DE EUCALIPTO NO ESTADO DE MINAS GERAIS
Tese apresentada à Universidade Federal de Viçosa, como parte das exigências do Programa de Pós-Graduação em Ciência Florestal, para obtenção do título de Doctor Scientiae.
APROVADA: 27 de junho de 2011.
Prof. Carlos Pedro Boechat Soares (Co-Orientador)
Prof. Agostinho Lopes de Souza (Co-Orientador)
Prof. Alba Valéria Rezende Prof. Andreza Viana Neri
ii À Deus por mais essa caminhada.
Ao meu pai Bruno e à minha mãe Carmen por todo o amor e atenção que sempre me dedicaram. À minha irmã Carol pelo companherismo e amizade sempre presentes. À minha irmã Cristiana e ao meu irmão Márcio pela amizade e constante incentivo.
Ao meu marido Fernando pelo amor incondicional, amparo e aconchego em todos os momentos.
Ao Departamento de Engenharia Florestal da Universidade Federal de Viçosa pelo apoio, treinamento e estrutura proporcionados.
Ao Professor Laércio Antônio Gonçalves Jacovine por todas as oportunidades oferecidas e pela amizade, dedicação, atenção e incentivo nos últimos seis anos da minha vida.
Ao Professor Carlos Pedro Boechat Soares pela orientação, ensinamentos, incentivo e amizade a mim dispensados.
Ao Professor Agostinho Lopes de Souza pelos valiosos ensinamentos, palavras de incentivo, amizade e segurança.
Ao Prof. Christoph Kleinn e o Dr. Lutz Fehrmann pela orientação e amizade durante a minha estadia na Alemanha.
Ao Prof. Klaus von Gadow pelos ensinamentos, amizade e experiências compartilhadas.
À Prof. Alba Valéria Rezende e à Prof. Andreza Viana Neri pelas valiosas sugestões dadas com relação à tese.
À Prof. Angélica de Cássia Oliveira Carneiro por ter disponibilizado o Laboratório de Painéis e Energia da Madeira para as análises necessárias.
À Plantar S.A. Reflorestamentos por ter cedido a área para a execução do trabalho e pelo apoio logístico. Aos funcionários de campo da Plantar pelo auxílio na coleta de dados.
Ao Márcio Assis e Geraldo Machado pelo grande auxílio e amizade durante a coleta de dados no campo.
Ao Raul Santos pela inestimável ajuda com as análises de laboratório e no campo. Ao Ricardo Gaspar pela ajuda nas coletas no campo, análise dos dados e discussão de pormenores do trabalho.
iii
Ao Celso Coelho, Carlos Torres e Daniel Brianezi pela ajuda no trabalho de campo.
Aos amigos que conheci em Viçosa, Sustanis Kunz, Cíntia Delgado, Nazaré Macedo, Edson Araujo, Creunice Fais, Gisele Santos, Danielle Fernandes, Mariana Vilar, Eliane Mesquita, Adriane Moreira, Emília Pio e há tantos outros, pelos momentos alegres vividos.
Aos colegas de departmento da Universidade de Göttingen, em especial a Aura Cardenas, Chaw Chaw Sein, Reza Reyahi e Axel Buschmann, pelo companherismo, risadas e momentos de descontração.
Às amigas de toda a vida Flávia, Lilian e Tahmineh pela eterna amizade. Aos funcionários do DEF por todo o auxílio, em especial à Ritinha, Alfredo e Alexandre.
À CAPES pela concessão da bolsa de doutorado. Ao DAAD/CAPES/CNPq pela concessão do curso de alemão e bolsa de doutorado sanduíche.
À FAPEMIG/SECTES pelo suporte financeiro dado para o desenvolvimento do projeto.
iv SUMÁRIO
RESUMO ... vi
ABSTRACT ... viii
INTRODUÇÃO GERAL ... 1
REFERÊNCIAS BIBLIOGRÁFICAS ... 5
CAPÍTULO 1 ABOVE- AND BELOWGROUND BIOMASS IN A BRAZILIAN CERRADO RESUMO ... 7
ABSTRACT ... 8
1. INTRODUCTION ... 9
2. MATERIAL AND METHODS ... 11
2.1. Study site ... 11
2.2. Forest inventory ... 11
2.3. Selection of sample trees ... 12
2.4. Biomass of the sample trees ... 13
2.5. Biomass of shrubs and litter ... 14
2.6. Biomass of roots ... 15
2.7. Biomass modeling ... 15
2.8. Carbon stock ... 17
3. RESULTS ... 17
3.1. Species richness and tree variables ... 17
3.2. Above- and belowground biomass ... 19
3.3. Biomass models ... 22
3.4. Carbon stock ... 24
4. DISCUSSION ... 26
5. CONCLUSIONS ... 29
ACKNOWLEDGEMENTS ... 30
v CAPÍTULO 2
ABOVE- AND BELOWGROUND BIOMASS AND CARBON ESTIMATES FOR CLONAL EUCALYPTUS TREES IN SOUTHEASTERN BRAZIL
RESUMO ... 38
ABSTRACT ... 39
1. INTRODUCTION ... 40
2. MATERIAL AND METHODS ... 41
2.1. Study Area ... 41
2.2. Data Collection... 42
2.3. Biomass and carbon content of the 23 sample trees ... 45
2.4. Data analysis ... 45
2.5. Carbon stock estimates in the stand level ... 46
3. RESULTS ... 47
3.1. Biomass and carbon content of the 23 sample trees ... 47
3.2. Allometric equations ... 49
3.3. Belowground biomass and carbon content of the nine sample trees selected for the root assessment ... 51
3.4. Above- and belowground carbon stock in the stand level ... 51
4. DISCUSSION ... 52
5. CONCLUSION ... 54
ACKNOWLEDGEMENTS ... 55
REFERENCES ... 55
vi RESUMO
RIBEIRO, Sabina Cerruto, D.Sc., Universidade Federal de Viçosa, junho de 2011. Estoque de biomassa e carbono em cerrado e em plantio comercial de Eucalipto no Estado de Minas Gerais. Orientador: Laércio Antônio Gonçalves Jacovine. Co-Orientadores: Carlos Pedro Boechat Soares e Agostinho Lopes de Souza.
vii
é maior do que o observado em outros estudos, enquanto que a estimativa de biomassa abaixo do solo está dentro da faixa de valores reportada por outros estudos. A melhor equação para estimar a biomassa acima do solo de árvores individuais foi aquela com as variáveis independentes DAP e densidade básica da madeira ( 2 = 0,896; Sy.x = 0,371). No nível de povoamento, a equação testada apresentou um bom
ajuste ( 2 = 0,926; Sy.x = 0,224). O teor de carbono médio para o tronco+galhos,
viii ABSTRACT
ix
0.224). The mean carbon content of bole + branches, leaves, roots, shrubs and litter is 48%. The total estimated carbon stock for the cerrado s.s. remnant is 54.36 tC ha-1. For the Eucalyptus plantation, we found an average carbon content for the stem, branches, leaves and roots of 44.6%, 43.0%, 46.1% and 37.8%, respectively. The carbon content of stem, branches, leaves and roots was smaller than the generic value commonly used (50%). This highlights the importance of determining the carbon content in laboratory instead of using a default value. Total stand carbon stock in the Eucalyptus plantation was estimated to be 73.38 tC ha-1, being within the carbon stock range for Eucalyptus plantations. The best-fit allometric equations to estimate the total amount of carbon and total biomass had DBH2H as independent variable.
1
INTRODUÇÃO GERAL
O aquecimento do sistema climático da Terra é inequívoco e tem como causa o aumento da concentração de gases de efeito estufa (GEE) na atmosfera terrestre. Até o ano de 2005 foi registrado um aumento de 0,76ºC na temperatura do planeta (IPCC, 2007a). As conseqüências deste aquecimento já podem ser notadas em muitos sistemas físicos e biológicos (IPCC, 2007b).
Em função deste aquecimento e das suas conseqüências, desde 1992 foram criados diversos tratados para lidar com a questão. O primeiro deles foi a Convenção-Quadro das Nações Unidas sobre Mudança do Clima (CQNUMC), que foi assinada em 1992 e entrou em vigor em 1994. A CQNUMC tem como objetivo a estabilização da concentração dos GEE na atmosfera em um nível que impeça a influência de ações humanas perigosas no clima terrestre (MCT, 2001a).
Em 1997 foi criado o Protocolo de Quioto que é um acordo internacional que estabelece metas obrigatórias de redução de emissões de GEE para 37 países e a comunidade européia. Estes países deverão reduzir as suas emissões, em média, a 5,0% abaixo dos níveis observados em 1990, no período de 2008 a 2012 (MCT, 2001b). As metas de redução de emissões de GEE foram estabelecidas apenas para os países desenvolvidos (países Anexo I). Até o final de 2012, quando será finalizado o primeiro período de compromisso, os países em desenvolvimento (países não-Anexo I) não terão metas obrigatórias de redução de emissões a serem cumpridas.
O Protocolo de Quioto estabeleceu três mecanismos adicionais de implementação (comércio de emissões, implementação conjunta e mecanismo de desenvolvimento limpo) como meio de auxiliar os países Anexo I a cumprirem as suas metas de redução de emissões de GEE (Frondizi, 2009). Dentre esses mecanismos, apenas o Mecanismo de Desenvolvimento Limpo (MDL) permite a participação de países não-Anexo I, como o Brasil.
2
Diversos são os escopos setoriais elegíveis para o desenvolvimento de atividades de projeto no âmbito do MDL. Dentre estes escopos setoriais, o florestamento/reflorestamento é a categoria que abrange especificamente as atividades florestais. Estas também podem ser desenvolvidas fora do Protocolo de Quioto no âmbito do mercado voluntário e do mecanismo de Redução de Emissões por Desmatamento e Degradação e incremento dos estoques de carbono (REDD+).
No mercado voluntário não existem metas obrigatórias de redução de emissões, mas sim o abatimento de metas estabelecidas voluntariamente por empresas ou governos locais (Kollmuss et al., 2008). Já o REDD+ é um instrumento de incentivo econômico para a redução das taxas de desmatamento (Eliasch, 2008). Este mecanismo ainda não se encontra formalmente regulamentado junto a CQNUMC, mas espera-se que nos próximos anos estas definições sejam estabelecidas.
As florestas, além de possuírem um expressivo papel nos processos ambientais globais, são uma importante fonte de produtos e serviços para a humanidade (Baskent e Keleş, 2009). O sequestro e a estocagem de carbono na biomassa destacam-se como um relevante serviço ambiental prestado pelas florestas. A elaboração de projetos florestais e REDD+ passa pela quantificação da biomassa florestal como meio de se estimar o estoque de carbono em uma área. Uma vez tendo sido obtidos em campo os dados de biomassa e o teor de carbono em laboratório, é possível estimar o estoque de carbono de um local.
Segundo Bombelli et al. (2009), existem quatro formas principais de quantificar a biomassa florestal: i) uso de método destrutivo in situ; ii) estimativas por métodos não-destrutivos in situ; iii) inferência a partir de sensoriamento remoto e iv) uso de modelos.
i) Uso de método destrutivo in situ: este método envolve o corte de árvores, arbustos e gramíneas. O material recolhido é seco e pesado a fim de se determinar a massa seca ou a biomassa. Este método pode ser aplicado para árvores individuais, no qual a biomassa de cada indivíduo é mensurada, ou por meio de parcelas. Neste último, a biomassa total de uma área específica ou parcela amostral é mensurada. Em geral, o método destrutivo in situ é comumente usado em pesquisas para o desenvolvimento e ajuste de equações alométricas que permitam a estimação da biomassa em grandes áreas.
3
acurado, desde que a equação usada tenha sido desenvolvida com base em um número de árvores adequado que garanta a representatividade do ecossistema avaliado.
iii) Inferência a partir de sensoriamento remoto: o uso de dados provenientes de sensoriamento remoto permite ampliar as estimativas de biomassa para grandes áreas, nas quais a execução de um inventário florestal poderia estar limitada por questões espaciais. Além disso, este método também pode ser usado para complementar estimativas obtidas a partir de inventários florestais, principalmente quando há falhas temporais ou espaciais nos dados. Diversas técnicas podem ser usadas para a estimativa de biomassa, conforme o nível de precisão requerida e os dados disponíveis.
iv) Uso de modelos: os modelos são usados para extrapolar as estimativas de biomassa ao longo do tempo e/ou espaço a partir de um banco de dados limitado (in situ ou provenientes do uso de sensoriamento remoto). Geralmente são usados modelos empíricos baseados em medições periódicas de árvores, feitas em parcelas permanentes, que incluem estimativas de biomassa embutidas ou podem requerer o uso de relações alométricas para converter o volume em biomassa. Quando os modelos empíricos não estiverem disponíveis podem ser usados modelos de processo baseados em variáveis ambientais.
Uma vez obtidas as estimativas de biomassa, é possível estimar o estoque de carbono por meio da multiplicação do valor da biomassa pelo teor de carbono. Os estudos que visem a quantificação da biomassa e a determinação do estoque de carbono em diferentes formações florestais devem ser estimulados. Os resultados encontrados podem ser usados por desenvolvedores de projetos florestais e REDD+ para embasar as estimativas de estoque de carbono de seus projetos.
No Brasil existe um grande número de empresas florestais. Nestas empresas é comum a existência de áreas de plantio e de florestas nativas, que visam atender às exigências previstas na legislação ambiental do país (ex. áreas de preservação permanente e reserva legal). Em algumas empresas, as áreas protegidas são estabelecidas de forma voluntária, como é o caso da reserva particular do patrimônio natural. Segundo a ABRAF (2011), em 2010 as suas empresas associadas possuiam para cada 1,0 ha de plantio florestal, 0,81 ha de floresta nativa.
4
da biomassa e estoque de carbono de um plantio comercial de eucalipto e de um fragmento de cerrado sensu stricto em Minas Gerais.
A tese foi estruturada em dois capítulos. Cada capítulo encontra-se na forma de artigo, conforme apresentado a seguir:
Capítulo 1: “Above- and belowground biomass in a Brazilian Cerrado” (artigo publicado na For. Ecol. Manage. 262 (2011), 491-499). Neste estudo foram geradas estimativas de biomassa e estoque de carbono acima e abaixo do solo para um fragmento de cerrado sensu stricto a partir do método destrutivo e foram ajustados modelos alométricos para estimar a biomassa.
5
2. REFERÊNCIAS BIBLIOGRÁFICAS
ABRAF, 2011. Anuário estatístico da ABRAF 2011, ano base 2010. Associação Brasileira de Produtores de Florestas Plantadas, Brasília.
Baskent, E.Z., Keleş, S., 2009. Developing alternative forest management planning strategies incorporating timber, water and carbon values: an examination of their interactions. Environ. Model. Assess. 14, 467-480.
Bombelli, A., Avitable, V., Balzter, H. et al., 2009. Biomass: assessment of the status of the development of standards for the terrestrial essential climate variables, GTOS-67/GTOS-ECV-T12, Ed. R. Sessa. FAO, Roma.
Eliasch, J., 2008. Eliasch Review: Climate Change: Financing Global Forests, Office of the Prime Minister. Stationery Office Limited, Londres.
Frondizi, I.M.R.L., 2009. O mecanismo de desenvolvimento limpo: guia de orientação 2009. Imperial Novo Milênio, Rio de Janeiro.
IPCC, 2007a. Summary for Policymakers. In: Climate Change 2007: The Physical Science Basis. Contribution of Working Group I to the Fourth Assessment Report of the Intergovernmental Panel on Climate Change [Solomon, S., D. Qin, M. Manning, Z. Chen, M. Marquis, K.B. Averyt, M.Tignor and H.L. Miller (eds.)]. Cambridge University Press, Cambridge, United Kingdom and New York, NY, USA.
IPCC, 2007b. Summary for Policymakers. In: Climate Change 2007: Impacts, Adaptation and Vulnerability. Contribution of Working Group II to the Fourth Assessment Report of the Intergovernmental Panel on Climate Change, M.L. Parry, O.F. Canziani, J.P. Palutikof, P.J. van der Linden and C.E. Hanson, Eds., Cambridge University Press, Cambridge, UK, 7-22.
Kollmuss, A., Zink, H., Polycarp, C., 2008. Making sense of the voluntary carbon market: a comparison of carbon offset standards. WWF Germany. 105 p. Disponível em:
<http://wwf.panda.org/about_our_earth/all_publications/?126700/A-Comparison-of-Carbon-Offset-Standards-Making-Sense-of-the-Voluntary-Carbon-Market>. Acesso em: 18 junho 2011.
MCT, 2001a. Convenção sobre Mudança do Clima. PNUMA, Brasília, Brasil.
6
CAPÍTULO 1
ABOVE- AND BELOWGROUND BIOMASS IN A
7 Resumo
O Cerrado é um bioma que ocupa cerca de 25% do território brasileiro e é caracterizado por um gradiente de formações campestres, savânicas e florestais com alta riqueza de espécies. Esse bioma vem sendo severamente afetado pela degradação e desmatamento nas últimas 4-5 décadas. Apesar da importância ecológica do Cerrado, existem poucos estudos que focaram na quantificação da biomassa neste bioma. Considerando o exposto, este estudo objetivou a geração de estimativas de biomassa acima e abaixo do solo, de estoque de carbono e o desenvolvimento de equações alométricas em um cerrado sensu stricto (cerrado s.s.) no sudeste do Brasil. Para isso, 120 árvores pertencentes a 18 espécies foram selecionadas para a quantificação da biomassa de folhas, galhos e tronco pelo método destrutivo. Cinco modelos foram testados para o desenvolvimento de equações alométricas para estimar a biomassa arbórea acima do solo (folhas + galhos + tronco). As variáveis independentes usadas nos modelos foram o DAP (D), a altura (H), D2H e a densidade básica da madeira (WD). Um modelo usando a área basal (BA) como parâmetro do povoamento também foi testado como alternativa para a predição da biomassa acima do solo em nível de povoamento. A biomassa abaixo do solo foi estimada pela amostragem de 10 sub-parcelas. A biomassa arbórea média acima do solo (tronco, galhos e folhas) foi estimada em 62,97 t ha-1 ( = 14,6%) e a biomassa abaixo do solo correspondeu a 37,50 t ha-1 ( = 23%). A equação de melhor ajuste para a estimação da biomassa acima do solo em nível de árvore individual apresentou o DAP e a densidade básica da madeira como variáveis explicativas ( 2 = 0,896; Sy.x = 0,371). Essa equação é
aplicável para a variação diamétrica deste estudo (5,0 – 27,6 cm) e em ambientes com condições similares ao cerrado s.s. amostrado. Em nível de povoamento, o modelo testado apresentou um melhor ajuste do que os modelos em nível de árvore individual ( 2 = 0,926; Sy.x = 0,224). As estimativas de biomassa acima do solo são maiores do que as encontradas
em outros estudos desenvolvidos na mesma fisionomia. Entretanto, as estimativas de biomassa abaixo do solo estão dentro dos limites apresentados por outros estudos em áreas de cerrado s.s. No entanto, ambas as estimativas possuem erros-padrão relativamente altos. A razão raiz-parte aérea das árvores-amostra foi similar aos valores apresentados na literatura para ecossistemas savânicos, porém são menores do que os estimados em outros estudos em áreas de cerrado s.s.
8 Abstract
Cerrado is a biome that occupies about 25% of the Brazilian territory and is characterized by a gradient of grassland to savanna and woodland formations and by high species richness. It has been severely affected by degradation and deforestation and has been heavily fragmented over the past 4-5 decades. Despite the recognized overall ecological importance of the Cerrado, there are only few studies focusing on the quantification of biomass in this biome. We conducted such a case study in the Southeast of Brazil in a cerrado sensu stricto (cerrado s.s.) with the goal to produce estimates of above- and belowground biomass, carbon stock and to develop allometric equations. A number of 120 trees from 18 species were destructively sampled and partitioned into the components leaves, branches and bole. Five models with DBH (D), height (H), D2H and wood density (WD) as independent variables were tested for the development of allometric models for individual tree aboveground biomass (leaves + branches + bole). One model based on basal area (BA) as a stand parameter was also tested as an alternative approach for predicting aboveground biomass in the stand level. Belowground biomass was estimated by subsampling on 10 sample plots. Mean aboveground tree biomass (bole, branches and leaves) was estimated to be 62.97 t ha-1 (SE = 14.6%) and belowground biomass accounted for 37.50 t ha-1 (SE = 23%). The best-fit equation for the estimation of individual tree aboveground biomass include DBH and wood density as explanatory variables ( 2 = 0.896; SEE = 0.371) and is applicable for the diameter range of this study (5.0 – 27.6 cm) and in environments with similar conditions of the cerrado s.s. sampled. In the stand level, the model tested presented a higher goodness of fit than the single tree models ( 2 = 0.926; SEE = 0.224). Our estimates of aboveground biomass are higher than reported by other studies developed in the same physiognomy, but the estimates of belowground biomass are within the range of values reported in other studies from sites in cerrado s.s. Both biomass estimates, however, exhibit relatively large standard errors. The root-to-shoot ratio of the sample trees is in the magnitude of reported values for savanna ecosystems, but smaller than estimated from other studies in the cerrado s.s.
9 1. Introduction
Savannas are spread worldwide, especially in tropical regions, and cover about one-fifth of the global land surface (Sankaran et al., 2005). Tropical savannas cover half the area of Africa and Australia, 45% of South America and 10% of India and Southeast Asia (Scholes and Archer, 1997). The savanna formation in Brazil constitutes the Cerrado which is, after Amazonia, the second largest biome of Brazil (Klink and Machado, 2005).
Cerrado occupies about a quarter of the Brazilian territory (IBGE, 2004) and is characterized by a gradient of grassland, savanna and woodland formations. The Cerrado is not a homogeneous vegetation type: according to Coutinho (1978) and Ribeiro and Walter (1998), its physiognomies range from campo forms (grassland formation), and the typical cerrado sensu stricto (savanna formation with trees and shrubs up to 3-6 m high and with a grass understory) to the cerradão (woodland formation with trees up to a height of 8-15 m). More detailed descriptions of Cerrado physiognomies can be found in Goodland (1971), Eiten (1972) and Oliveira-Filho and Ratter (2002).
Despite the fact that Cerrado has a high species richness (including many endemic species) and is considered a biodiversity hotspot, only about 2.2% of its area has a legal protection status (Marris, 2005); that points to the little attention that this biome receives as compared to tropical rain forest (Giambelluca et al., 2009). The Cerrado has been severely fragmented and degraded due to deforestation over the past 4-5 decades, where the land was subsequently used for cash crops and cattle ranching (Klink and Moreira, 2002). A recent remote sensing study comes to the conclusion that about 47.9% of Cerrado‟s original cover had been cleared by 2008 (Brasil, 2009). After the Atlantic Forest, Cerrado is the Brazilian biome that most suffered anthropogenic impacts and it has been classified among the most threatened biomes of the world (Myers et al., 2000; Mittermeier et al., 2005).
10
Most biomass studies in Cerrado areas looked only into the aboveground component, while other carbon pools such as litter and belowground biomass were rarely studied and only a very small number of studies to date published estimates on above- and belowground biomass for cerrado sensu stricto (e.g. Abdala et al., 1998; Castro and Kauffman, 1998; Lilienfein et al., 2001). Also, only a small number of studies estimated aboveground biomass in other Cerrado physiognomies (Kauffman et al., 1994; Araujo et al., 2001; Ottmar et al., 2001; Santos et al., 2002; Vale et al., 2002; Barbosa and Fearnside, 2005; Delitti et al., 2006; Rezende et al., 2006).
The biomass stock is an immediate measure for the quantity of carbon that will be emitted to the atmosphere when the corresponding area is converted to another land use through burning and decay (Houghton et al., 2009). Therefore, as Cerrado is strongly affected by fire (natural and human induced) and has high rates of deforestation, it is of utmost importance to quantify the different biomass pools in this biome. Reliable estimates of biomass are necessary for the prediction of the emissions from land use change and of biomass stock in ecosystems (Alves et al., 2010). Moreover, the information on biomass amount can be used in forestry projects under the Kyoto Protocol and in the implementation of REDD (Reducing Emissions from Deforestation and Forest Degradation) initiatives (Djomo et al., 2010).
Allometric models are among the standard tools for biomass prediction (Fehrmann and Kleinn, 2006), in particular when individual tree biomass is to be estimated, because biomass cannot directly be measured nor observed in the field. An allometric model is an empirical relationship between biomass and easily measured variables, such as tree diameter at breast height that can be established by means of a regression analysis (Overman et al., 1994; Parresol, 1999; Ketterings et al., 2001). Such models are valid and should be applied only to the species or species group for which they were derived and many of such models suffer from a relatively modest number of measurements on which they are based. Hardly any mixed species models for the Cerrado can be found in the literature (Abdala et al., 1998; Rezende et al., 2006).
11
biomass measurements. We also provide carbon stock estimates for the cerrado s.s. remnant.
2. Material and methods
2.1. Study site
Field data were collected in October 2009 in a protected Cerrado remnant (33 ha) in Curvelo, located in the central part of the state of Minas Gerais, Brazil. The fragment is embedded in a Eucalyptus matrix inside an area of a privately owned company that operates in pig-iron production and Eucalyptus plantation. The average annual rainfall in Curvelo is around 1.200 mm, falling mostly during January and February, and the mean annual temperature is 23°C. Soils in the region have a high content of clay, low fertility and little organic matter. The soil type in the Cerrado remnant area is the red latosol. The elevation of study site is approximately 600 m. Cerrado in Curvelo is affected by human interventions since long. These interventions were over the past 4-5 decades mainly due the conversion to pasture to cash-crop agriculture and to eucalyptus monocultures (ALMG, 2004; Klink and Machado, 2005). These land-use changes lead to a heavy fragmentation of the landscape where the remnants were left at different stages of degradation.
The Cerrado remnant where this study took place can be classified according to Ribeiro and Walter (1998), as “cerrado sensu stricto típico” (cerrado s.s. in the following). This phytophisionomy is characterized by high species richness of shrubs and trees with mean height of about 3-6 m and tree cover of 20-50%. In the whole study site there was no clear evidence of any recent anthropogenic disturbance.
2.2. Forest inventory
12
Figure 1. Plot design in the “cerrado s.s.” remnant in Curvelo (MG), Brazil.
Multi-stemmed trees are common in Cerrado vegetation. In order to make the biomass comparable for all trees – single-stem and multi-stem – a pooled diameter (Eq. 1) was calculated for trees with multiple stems.
(1)
The average height of a multiple-stem tree was calculated as a simple arithmetic mean of the heights of all stems.
2.3. Selection of sample trees
In Cerrado, as in many other tropical forest types, tree species diversity is high and the availability of prior studies that focus on individual species‟ biomass or tree architecture is limited. Considering that a certain minimum number of sample trees need to be biomass
Firebreak
200 m 75 m
N
5
4
2
1
9
8
7
6
10
3
292.66 m
264.67 m
1206.24 m
13
measured to derive a useful model, it becomes clear that feasible biomass estimation will need to start with aiming at models for larger sets of species rather than for individual species. In our case, we faced the additional issue of bureaucratic barriers. As Cerrado is one of the two recognized biodiversity hotspots in Brazil (Myers et al., 2000; Mittermeier et al., 2005), it is difficult to obtain permission for destructive sampling spread over a larger area, even for research purposes. Due to practical restrictions we needed to limit the total number of trees to be selected for destructive sampling to 120 individuals.
Selection of sample trees was prepared on the basis of data from the inventory as described above (Figure 1) where DBH, height and species was observed for all trees with DBH > 5 cm on 10 systematically arranged sample plots of 500 m² each. From these data, we were able to observe 47 species, from which were identified a set of 18 species that contribute with more than 75% to basal area. We used basal area as guiding variable here because basal area is known to be highly correlated to many tree variables and it can be determined with only two sources of error, (1) the measurement of diameter or girth and (2) the model assumption of a perfectly circular cross cut. The set of 18 species contains the most typical tree species for the biome Cerrado in general (Ratter et al., 2003) and for the Cerrado area in state of Minas Gerais (Brandão and Gavilanes, 1992), where this study was carried out.
The number of sample trees per species to be cut was determined proportional to the species contribution to total basal area. Trees for each species were selected proportional to basal area, according to diameter classes. Sample trees were then identified from the list of inventory sample trees in such a way that a uniform spatial distribution over the whole study site was ensured.
2.4. Biomass of the sample trees
14
All leaves of single trees were collected manually and fresh weight was recorded. A composite sample (~135 g) of leaves was manually collected for each individual and weighed to determine fresh weight to dry weight relation. The wood disks and samples of leaves were taken to the laboratory. Two wood samples were taken from each wood disk on opposite sides. Each wood sample was volume measured by water displacement and weighed after oven drying at 103 ± 2 ºC until weight stabilized. The basic wood density for one wood disk was calculated as an average of the two measurements per disk (Table 1). The leaf samples were dried at ~70 ºC until the weight stabilized.
The per-plot biomass was then expanded to estimate the biomass stock per-hectare in a two-step procedure: (1) biomass per plot was upscaled from the biomass mi of the
sub-set of biomass-sampled trees by using a upscaling factor (UFi) that is a ratio between the
total number of trees of a plot to the number of trees harvested in this plot; and (2) biomass per hectare was calculated by standard plot expansion; here, for inventory sample plots of 0.05 ha, the expansion factor is constantly EF = 10,000/500 = 20 for all sample plots. The estimated biomass per hectare Bi, as expanded from the inventory plot i, results then from
the equation 2:
(2)
where Bi refers to the biomass stock per hectare of the ith plot (kg ha-1) and UFi and mi refer
to the upscaling factor and to the sub-sampled biomass (kg) of the ith plot, respectively.
2.5. Biomass of shrubs and litter
Shrub was defined to be all woody species with DBH < 5 cm. In the center of each inventory plot, shrubs were sampled in a sub-plot of 2.0 m x 2.5 m; they were cut and the total fresh weight was determined. A random sample (wood and leaves) of about 200 g was collected from each sub-plot to determine the fresh- to dry weight relation.
15
Both the samples of shrubs and litter were dried at ~70 ºC in an oven until the stabilization of weight. The estimate of litter biomass per plot was then calculated as mean of the two measurements per plot.
2.6. Biomass of roots
Root biomass assessment had a different approach than the aboveground biomass. Instead of sampling the roots based on single trees, the roots biomass was determined per area. Thus, a sub-plot of 2.0 m x 2.5 m was established in the center of each inventory plot. The sub-plot was excavated to a depth of 1.0 m. All the soil inside the sub-plot passed through a sieve with mesh size of 1.0 cm. As most of the roots were too long, they could not pass through the sieve. Thus, even the roots that had a diameter smaller than 1.0 cm were collected. Live and dead roots were hand-sorted together from the material remaining in the sieve. Taproot and coarse roots were cut close to the ground and removed. All collected roots were weighed in the field. A random sample of about 300 g was taken from the total material, weighed in the field and then dried at ~70 ºC in an oven until stabilization of weight in order to determine the fresh- to dry weight relation.
2.7. Biomass modeling
For statistical analysis of single tree biomass we only considered the total aboveground part per tree that is the biomass values for stem, branches and leaves. Input variables for the biomass model were DBH (D), height (H) and wood density (WD). For some model formulations D and H entered the analyses also as the interaction term D2H. Five standard models (Loetsch et al., 1973; Chave et al., 2005) were tested for prediction of aboveground biomass:
(m1)
(m2)
(m3)
(m4)
16
where B = aboveground biomass in kg; D = diameter at breast height in cm; H = total height of the tree in m; WD = wood density in g cm-3; β0, β1 and β2 = regression
parameters; ε = random error.
As already mentioned before, the high species diversity of cerrado s.s. is an argument to search for simple and general approaches to model aboveground biomass. One possibility in this context is not to use single tree models to estimate biomass per tree on each sample plot, but to use stand parameters as independent variables. We tested a model with the basal area (BA) as an independent variable. The data used for model adjustment are total biomass and the respective total basal area of all sampled trees per plot:
(m6)
As the single tree biomass show a typical heteroscedasticity when plotted against the independent variables, we applied a log-transformation to ensure a homogenization of variances as precaution for linear regression analysis. For back transformation of model predictions to the metric scale a correction factor CF has to be applied in order to comply with the different distributions of log-transformed and metric values (Sprugel, 1983; Fehrmann and Kleinn, 2006):
(3) The correction factor is a number greater than one and is calculated based on the standard error of estimate (SEE). The more precise the estimates predicted by the model, the smaller the SEE and thus the correction factor.
The models were fitted to data using ordinary least squares-regression analysis. All data analyses were performed with the STATISTICA software package version 8.0 (StatSoft Inc, 2007). The significance of the models was evaluated with the F-test and the t statistic was used to test the significance of the model coefficients.
17 2.8. Carbon stock
The carbon content of each compartment (bole + branches, leaves, roots, shrubs and litter) was determined in laboratory using a continuos-flow isotope ratio mass spectrometer (ANCA-GLS). The carbon stock (Eq. 4) of the different compartments was estimated using the biomass per plot (Bi) and the carbon content (TCi).
(4)
3. Results
3.1. Species richness and tree variables
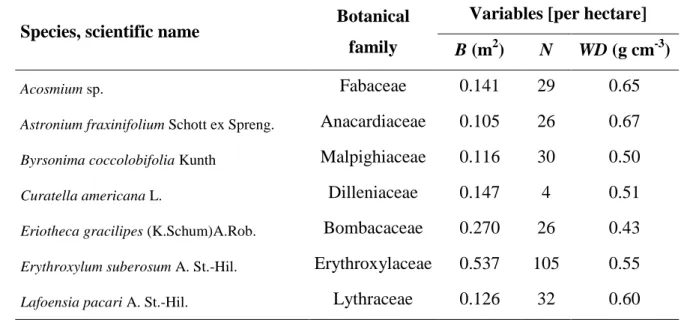
In the forest inventory of the 10 sample plots we found 47 tree species with DBH > 5 cm and tree density was estimated to be 2086 trees ha-1. These 47 species belong to 40 genera and 29 families. The six most common species were Qualea parviflora, Qualea grandiflora, Erythroxylum suberosum, Caryocar brasiliense, Eriotheca gracilipes and Lafoensia pacari. Among the 18 species (Table 1) that were selected for destructive biomass measurements, there were five of the six most common species. The exception was Caryocar brasiliense, which is protected by federal regulations since 1987 and must not be cut (IBDF, 1987).
Table 1. Basal area B, number of trees N, and average wood density WD from the cerrado s.s. forest inventory (only the species that were included for destructive measurements).
Species, scientific name Botanical family
Variables [per hectare]
B (m2) N WD (g cm-3)
18 Table 1. (continue)
Species, scientific name Botanical family
Variables [per hectare]
B (m2) N WD (g cm-3)
Piptocarpha rotundifolia (Less.) Baker Asteraceae 0.075 19 0.46 Plathymenia reticulata Benth. Fabaceae 0.062 14 0.58 Pouteria torta (Mart.) Radlk. Sapotaceae 0.098 11 0.59 Pterodon emarginatus Vogel Fabaceae 0.111 9 0.68 Qualea grandiflora Mart. Vochysiaceae 0.927 129 0.56 Qualea parviflora Mart. Vochysiaceae 2.265 260 0.51 Sclerolobium sp. Fabaceae 0.167 18 0.60 Solanum sp. Solanaceae 0.270 21 0.45 Strychnos pseudoquina A. St.-Hil. Loganiaceae 0.005 1 0.70 Stryphnodendron adstringens (Mart.) Coville Fabaceae 0.126 13 0.54 Terminalia argentea Mart. Combretaceae 0.108 17 0.67
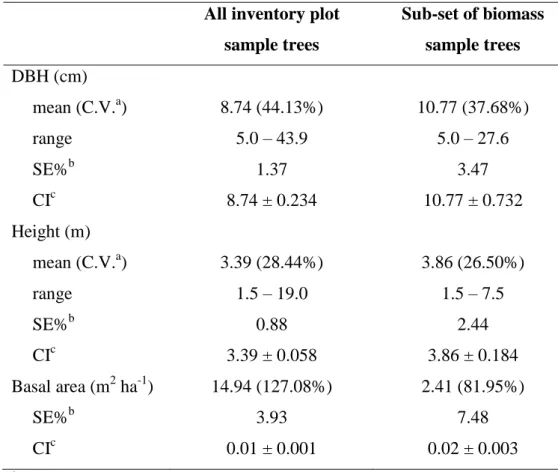
The DBH, height and basal area of the all inventory sample trees are given in Table 2 and these are contrasted there to the mensurational characteristics of the sub-set of trees that was destructively sampled for biomass. Three inventory sample trees of Caryocar brasiliense had DBH > 30.0 cm, which explains the greater range in DBH of all inventory trees when compared to the biomass sample trees. Removing these three individuals leads to a maximum diameter of 28.0 cm that is a value similar to the maximum diameter of sample trees.
19
Table 2. Mensurational characteristics of all inventory plot sample trees and of the sub-set selected for destructive biomass measurements.
All inventory plot sample trees
Sub-set of biomass sample trees DBH (cm)
mean (C.V.a) 8.74 (44.13%) 10.77 (37.68%)
range 5.0 – 43.9 5.0 – 27.6
SE%b 1.37 3.47
CIc 8.74 ± 0.234 10.77 ± 0.732
Height (m)
mean (C.V.a) 3.39 (28.44%) 3.86 (26.50%)
range 1.5 – 19.0 1.5 – 7.5
SE%b 0.88 2.44
CIc 3.39 ± 0.058 3.86 ± 0.184
Basal area (m2 ha-1) 14.94 (127.08%) 2.41 (81.95%)
SE%b 3.93 7.48
CIc 0.01 ± 0.001 0.02 ± 0.003
aC.V.: coefficient of variation. bSE%: relative standard error. cCI: confidence interval (95% CI).
The basal area of the inventory plot sample trees corresponds to 16.1% of total basal area of the woodland remnant. The sub-set of biomass sample trees encompass the range of mensurational characteristics of the whole set of trees.
3.2. Above- and belowground biomass
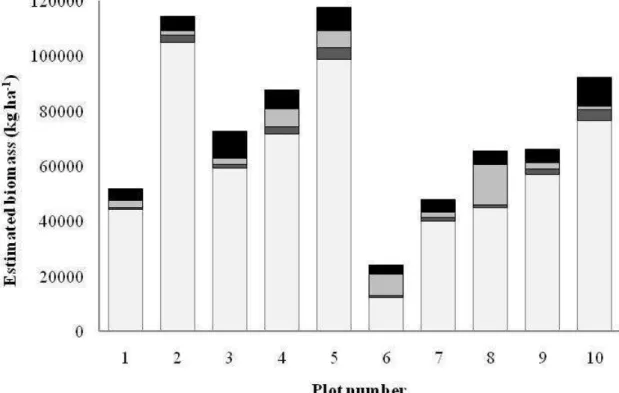
The aboveground tree biomass (bole, branches and leaves) as expanded from the ten plots to per-hectare values ranged from 12.90 t ha-1 to 107.36 t ha-1, with a mean of 62.97 t ha-1
and a relative standard error of 14.6% (Figure 2). The biomass of bole and branches (60.96 t ha-1, 14.6%1) had a smaller variation than the biomass of leaves (2.00 t ha-1, 20.7%).
20
The biomass of leaves is comparable in all plots. Some variation is presumably related to the presence of brevideciduous/deciduous species, such as Qualea grandiflora, Q. parviflora and Erythroxylum suberosum (Lenza and Klink, 2006).
Figure 2. Aboveground biomass of the ten sample plots in a cerrado s.s. in Curvelo (MG), Brazil.
22
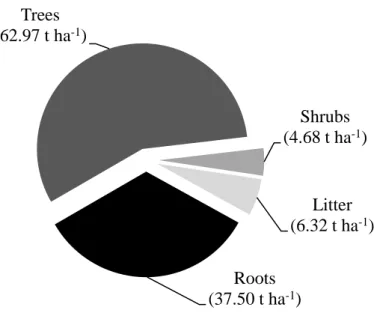
Trees (leaves and wood), shrubs and litter accounted for an estimated 85.1%, 6.3% and 8.5% of the AGB, respectively. Only the tree biomass has considerably higher values as compared to other studies, while the biomass of shrubs and litter are within the range of magnitude reported in previous studies. Estimates of belowground biomass (BGB, down to 1 m) from the ten sub-plots ranged from 15.07 t ha-1 to 102.12 t ha-1 with an estimated mean of 37.50 t ha-1 (SE% = 23.0%). Combining all biomass components considered in this study (AGB and BGB), the total biomass for the study area was thus estimated to 111.47 t ha-1 and its composition is depicted in Figure 3.
Figure 3. Composition of total biomass from the biomass components considered in this study.
From the per-hectare figures of AGB and BGB, a root-shoot ratio can be derived. In our study the ratio of BGB to AGB of individual trees resulted in a ratio close to 0.6.
3.3. Biomass models
After eliminating four extreme outliers that are probably result of inconsistent field measurements from the data, all models were tested regarding their general fit by visual interpretation. Afterwards the mentioned goodness of fit criteria were computed for all models and are given in Table 4. The total variance of the data explained by the regression of the single tree models, quantified by the adjusted coefficient of determination 2 was around 90% and the standard error of estimation (SEE) ranged between 0.365 and 0.394. The m6 that was based on a stand parameter had a 2 and SEE of 0.926 and 0.224,
respectively.
Trees (62.97 t ha-1)
Shrubs (4.68 t ha-1)
Litter (6.32 t ha-1)
23
Table 4. Regression coefficients (with p-value of the t-distribution in parentheses), adjusted coefficient of determination ( 2), standard error
of estimation (SEE) and correction factor (CF) for the 6 compared regression models.
Model
Coefficient
2
SEE CFa
b0 (Intercept) b1 (lnD) b2 (lnD)2 b3 (lnH) b4 (lnD)3 b5
(D2H)
b6
(DH2)
b7 (lnWD) b8 (lnBA) m1 -3.3369 (<0.0001) 2.7635
(<0.0001) -
0.4059
(0.0316) - - -
1.2439
(<0.0001) - 0.899 0.365 1.069
m2
-3.1679
(<0.0001) - - - -
1.1438
(<0.0001) -
1.3079
(0.0001) - 0.886 0.389 1.079
m3 6.6844 (0.2022) -9.9319 (0.1501) 5.3745
(0.0697) -
-0.7273
(0.0798) - -
1.1201
(0.0003) - 0.897 0.368 1.070
m4
-3.3520 (<0.0001)
2.9853
(<0.0001) - - - - -
1.1855
(0.0001) - 0.896 0.371 1.071
m5
-3.9336 (<0.0001)
2.9171
(<0.0001) - - - 0.883 0.394 1.081
m6
8.3724
(<0.0001) - - - -
1.1912
(<0.0001) 0.926 0.224 1.025
24
The best-fit single tree models for estimating aboveground biomass (B) along 2 and SEE were m1, m3 and m4. These models presented similar 2 values (0.899, 0.897 and
0.896, respectively) and SEE (Table 4). The model m3 had a similar 2 and SEE as the
other models, but only one of the regression coefficients was significant so this equation was refused.
Following the principle of parsimony (McLeod, 1993; Burnham and Anderson, 2002), model m4 was selected as the best single tree model for estimating the aboveground
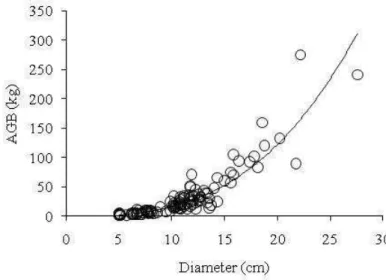
biomass as it uses only two explanatory variables (DBH and WD) and still generates results not much less precise than more complex models. The single effect of diameter on estimated AGB is plotted in Figure 4.
Model m6 had the higher 2 and SEE values (0.926 and 0.224), representing an
option for aboveground biomass prediction when only stand parameters, like basal area, are available. As model m6 was adjusted based on per plot values (n=10) and not based on
single tree variables (n=116) like in case of the other models, this fact should be carefully considered while comparing the performance.
Figure 4. Relation between single tree aboveground biomass (AGB) and tree diameter (n=116).
3.4. Carbon stock
25
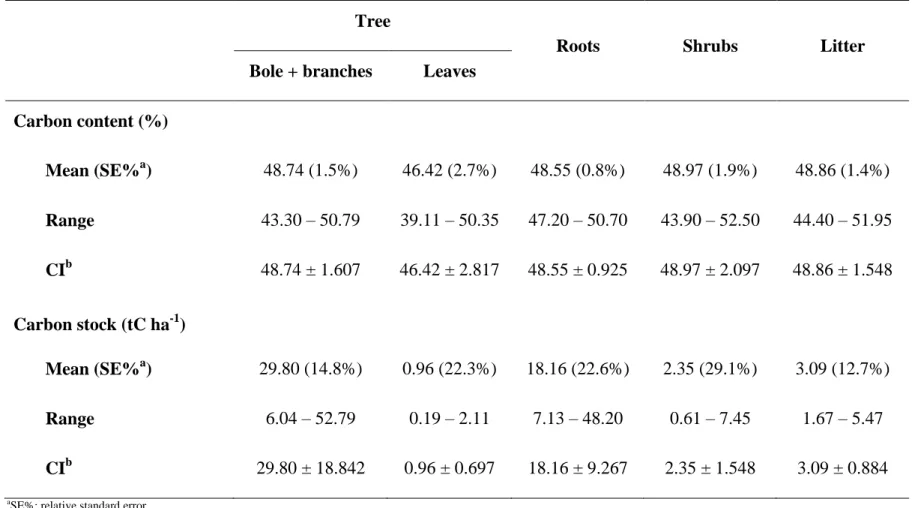
Table 5. Carbon content (%) and carbon stock (tC ha-1) of the compartments analysed in the cerrado s.s. remnant in Curvelo (MG), Brazil.
Tree
Roots Shrubs Litter
Bole + branches Leaves Carbon content (%)
Mean (SE%a) 48.74 (1.5%) 46.42 (2.7%) 48.55 (0.8%) 48.97 (1.9%) 48.86 (1.4%) Range 43.30 – 50.79 39.11 – 50.35 47.20 – 50.70 43.90 – 52.50 44.40 – 51.95 CIb 48.74 ± 1.607 46.42 ± 2.817 48.55 ± 0.925 48.97 ± 2.097 48.86 ± 1.548
Carbon stock (tC ha-1)
Mean (SE%a) 29.80 (14.8%) 0.96 (22.3%) 18.16 (22.6%) 2.35 (29.1%) 3.09 (12.7%) Range 6.04 – 52.79 0.19 – 2.11 7.13 – 48.20 0.61 – 7.45 1.67 – 5.47
CIb 29.80 ± 18.842 0.96 ± 0.697 18.16 ± 9.267 2.35 ± 1.548 3.09 ± 0.884
26
Considering all the compartments, the mean carbon content is 48%. The total estimated carbon stock for the cerrado s.s. remnant is 54.36 tC ha-1.
4. Discussion
The overall goal of this study was to estimate biomass density of cerrado s.s. and to relate the estimates with those of existing studies for the same biome. One of the core findings of this case study is that the AGB stock of the actual study site (73.96 t ha-1) is relatively large in comparison to other studies published for cerrado s.s. elsewhere in Brazil (Table 3). The main difference was thereby found in the tree and tree + shrub biomass pool that are significantly larger than in other studies performed using direct measurements in the Distrito Federal (Abdala et al., 1998; Castro and Kauffman, 1998; Vale et al., 2002; Rezende et al., 2006), in Mato Grosso (Araujo et al., 2001; Santos et al., 2002), in Minas Gerais (Lilienfein et al., 2001) and in Roraima (Barbosa and Fearnside, 2005). These estimates are on average about only one fifth of the values estimated in this study (trees = 62.97 t ha-1, trees + shrubs = 67.65 t ha-1).
Indirect estimations of biomass for trees and shrubs in the cerrado s.s. were perfomed by Ottmar et al. (2001) based on stereo photos and with an allometric equation proposed by Abdala et al. (1998). Also in this study the authors found a biomass of trees and shrubs that was significantly larger than in most of the other mentioned results, ranging from 12.53 t ha-1 to 42.96 t ha-1, with an average of 25.30 t ha-1. Contrary to the estimated tree biomass, our results for the shrub and litter pool are in the range of values reported by other studies (4.68 t ha-1 and 6.32 t ha-1, respectively).
Caution, however, must be taken in the direct comparison of our estimates with those reported in other studies, as different measurement criteria and methodologies had been used. Especially when comparing the estimated regression coefficients of the biomass models we have applied, it should be noted that these refer to DBH (and for multiple stems to the pooled diameter) as independent variable, while other studies used a base diameter. Further, the basal area (14.9 m2 ha-1) and tree density (2,086 tree ha-1) for the actual study site are slightly higher as compared to others (see Table 3). The studied cerrado s.s. remnant is a protected area with restricted access. This situation possibly enabled a higher biomass accumulation, compared to areas that are not state-declared protected areas.
27
selection of sample trees. In our study 18 species that are among the most common and widespread woody species for the Cerrado region (Ratter et al., 2003) and contributed with 75% to the basal area, were destructively sampled. However 25% of the individuals found in the inventory plots were not sampled because of their relatively small contribution to basal area. In case that those unobserved trees have a significant different biomass, the exclusion of them might be a source of an estimation bias.
Regarding the belowground biomass the estimates obtained here (37.50 t ha-1) are about half of the estimated AGB. There are only few published studies which assessed the belowground biomass in cerrado s.s. Abdala et al. (1998) collected samples of roots in a cerrado s.s. in Distrito Federal using soil monoliths (until a depth of 6.2 m) and tanks (depth of 1 m) and found an average belowground biomass of 41.10 t ha-1. Castro and Kauffman (1998) assessed the above- and belowground biomass in three different physiognomies of Cerrado in Distrito Federal. The roots biomass was sampled using soil monoliths until a depth of 1 m and for the 1 m to 2 m layer samples were extracted using an augur. The authors observed for the two different variants of cerrado s.s. (open and close canopy) a root biomass of 46.60 t ha-1 and 52.90 t ha-1, respectively. Based on a different methodology, Lilienfein et al. (2001) estimated above- and belowground biomass in a cerrado s.s. in Uberlândia, Minas Gerais, and found a root biomass (until 2 m depth) of 30.36 t ha-1. The belowground biomass estimated in our study is comparable to these three studies, despite the differences in the methodological approaches.
Most of the studies that assess the belowground biomass focus on the upper layers, due to the inherent difficult of measuring root system, not only in Cerrado, but in any other forest ecosystem (Sanford and Cuevas, 1996; Vogt et al., 1998). As some Cerrado woody species can develop a very deep root system (Rawitscher, 1948; Sarmiento, 1983), which is associated with the deep ground water levels (Jackson et al., 1999; Meinzer et al., 1999; Oliveira et al., 2005), more detailed information about the belowground biomass pool is, therefore, required if the carbon stocks of these systems shall be estimated completely. Zobel and Zobel (2002) addressed the challenges of such studies, emphasizing that they must be tackled despite the practical difficulties if progress in precision of biomass estimation shall be achieved.
28
Considering studies in other savannas around the world, the root-shoot ratio ranges between 0.6 and 2.5, with a median of 0.642 (Grace et al., 2006; Mokany et al., 2006). Our study is within the root-shoot ratio range for savannas ecosystems, despite of being smaller than other studies in the cerrado s.s. The belowground biomass was slighter smaller than in the other cerrado s.s. studies probably due to soil physical stresses (mechanical impedance, water content) and nutrient availability (Bengough et al., 2006). The high aboveground biomass comparing to other studies is the major reason for the small value of the root-shoot ratio.
To our knowledge only few studies developed single tree allometric equations for aboveground biomass estimation for cerrado s.s. (Abdala et al., 1998; Barbosa and Fearnside, 2005; Rezende et al., 2006; Scolforo et al., 2008). These studies focused on areas in the central part of Brazil and in the open savannas of Roraima. Our study and the one developed by Scolforo et al. (2008), seems to be the only ones that recently developed single tree allometric equations for biomass estimation in a cerrado s.s. in the southeast of the country. Based on our data model, m4 was identified as the best one to predict the
29
Model m1 has the best goodness of fit statistics for our dataset. Nevertheless due to
the controversy associated to the inclusion of tree height in allometric models for estimating biomass, the model m4 was preferred. The measurement of the height is often
less accurate than DBH, time-consuming and costly to assess. Furthermore, as tree height measurements are not always performed in field inventories, especially in historical ones, its inclusion in allometric biomass models may limit their application (Chave et al., 2005; Montagu et al., 2005; Wang, 2006; Fehrmann and Kleinn, 2006). Beside of the issues related to height measurement, the selection of model m4 was also motivated by its
simplicity. The DBH and WD can be measured easily and accurately and are very relevant variables for biomass estimation. Thereby, m4 equation is the most parsimonious and
adequate statistical model among the ones tested.
Model m6 represents a more general approach than single tree models, and is based
on the relation between total basal area of all sampled trees per plot and the resulting total biomass that was estimated. Such approaches might be in particular useful for forest types in which the application of allometric models on single tree level is difficult and estimates of stand characteristics, like basal area per hectare are easier to obtain.
Few studies focused on the quantification of carbon stock in Cerrado areas. Carbon content values for different compartments in Cerrado are also scantily available. Most of the research have concentrated only in the soil pool (e.g. Lardy et al., 2002; Carvalho et al., 2010), while little information is available for other compartments. More comprehensive approaches are needed for a better understanding of the processes of carbon sequestration and storage in the Cerrado biome.
5. Conclusions
In this work the above- and belowground biomass in a cerrado s.s. in the southeast of Brazil were estimated using destructive measurements. The aboveground biomass was higher than other studies developed in the same physiognomy, whereas the belowground biomass pool was among the range of these studies. Nonetheless, the lack of a standardized sampling protocol hampers meaningful comparisons among studies.
30
However we expect that with the advance of climate change negotiations, especially in issues related to REDD, more importance will be given to Cerrado. Therefore, studies focusing on the biomass and carbon storage quantification in different Cerrado physiognomies are of great importance.
Acknowledgements
We gratefully acknowledge financial support for this study from FAPEMIG, DAAD/CAPES (Ph.D. scholarship) and CNPq (productivity grants). Thanks also to Plantar S.A. Reflorestamentos for allowing us to work inside their property and to provide us the logistical support and staff during the field work. We also thank Raul Duarte Santos for providing invaluable assistance in the laboratory work and in the field. We are also very grateful to Márcio Assis and Geraldo Machado for the indispensable support during the field work. We appreciate the valuable comments of two anonymous reviewers.
References
Abdala, G.C., Caldas, L.S., Haridasan, M., Eiten, G., 1998. Above and belowground organic matter and root:shoot ratio in a cerrado in Central Brazil. Braz. J. Ecol. 2, 11-23.
ALMG – Assembléia Legislativa do Estado de Minas Gerais, 2004. O eucalipto no Brasil e em Minas. Cartilha O Eucalipto, 9-15. Retrieved April, 28, 2010 from http://www.almg.gov.br/Publicacoes/Eucalipto/brasil_minas.pdf.
Alves, L.F., Vieira, S.A., Scaranello, M.A., Camargo, P.B., Santos, F.A.M., Joly, C.A., Martinelli, L.A., 2010. Forest structure and live aboveground biomass variation along an elevational gradient of tropical Atlantic moist forest (Brazil). For. Ecol. Manage. 260, 679-691.
31
Baker, T.R., Phillips, O.L., Malhi, Y., Almeida, S., Arroyo, L., Di Fiore, A., Erwin, T., Killeen, T.J., Laurance, S.G., Laurance, W.F., Lewis, S.L., Lloyd, J., Monteagudo, A., Neill, D.A., Patiño, S., Pitman, N.C.A., Silva, J.N.M., Martínez, R.V., 2004. Variation in wood density determines spatial patterns in Amazonian forest biomass. Glob. Change Biol. 10, 545-562.
Barbosa, R.I., Fearnside, P.M., 2004. Wood density of trees in open savannas of the Brazilian Amazon. For. Ecol. Manage. 199, 115-123.
Barbosa, R.I., Fearnside, P.M., 2005. Above-ground biomass and the fate of carbon after burning in the savannas of Roraima, Brazilian Amazonia. For. Ecol. Manage. 216, 295-316.
Bengough, A.G., Bransby, M.F., Hans, J., McKenna, S.J., Roberts, T.J., Valentine, T.A., 2006. Root responses to soil physical conditions; growth dynamics from field to cell. J. Exp. Bot. 57, 437-447.
Brandão, M., Gavilanes, M.L., 1992. Espécies arbóreas padronizadoras do cerrado mineiro e sua distribuição no estado. Inf. Agropec. 16, 5-11.
Brasil. Ministério do Meio Ambiente, 2009. Relatório técnico de monitoramento do desmatamento no bioma Cerrado, 2002 a 2008: dados revisados. MMA, Brasília.
Retrieved November, 8, 2010
http://www.mma.gov.br/estruturas/sbf_chm_rbbio/_arquivos/relatorio_tecnico_monit oramento_desmate_bioma_cerrado_csr_ibama_2002_2008_rev_72.pdf.
Burnham K.P., Anderson D.R., 2002. Model selection and multimodel inference: a practical information-theoretic approach, second ed. Springer, New York.
Carvalho, J.L.N., Raucci, G.S., Cerri, C.E., Bernoux, M., Feigl, B.J., Wruck, F.J., Cerri, C.C., 2010. Impact of pasture, agriculture and crop-livestock systems on soil C stocks in Brazil. Soil Till. Res. 110, 175-186.
32
Chave, J., Andalo, C., Brown, S., Cairns, M.A., Chambers, J.Q., Eamus, D., Fölster, H., Fromard, F., Higuchi, N., Kira, T., Lescure, J.-P., Nelson, B.W., Ogawa, H., Puig, H., Riéra, B., Yamakura, T., 2005. Tree allometry and improved estimation of carbon stocks and balance in tropical forests. Oecol. 145, 87-99.
Coutinho, L.M., 1978. O conceito de cerrado. Rev. Bras. Bot. 1, 17-23.
Delitti, W.B.C., Meguro, M., Pausas, J.G., 2006. Biomass and mineral mass estimates in a “cerrado” ecosystem. Rev. Brasil. Bot. 29, 531-540.
Djomo, A.N., Ibrahima, A., Saborowski, J., Gravenhorst, G., 2010. Allometric equations for biomass estimation in Cameroon and pan moist tropical equations including biomass data from Africa. For. Ecol. Manage. 260, 1873-1885.
Draper, N.R., Smith, H., 1998. Applied regression analysis, third ed. John Wiley & Sons, New York.
Eiten, G., 1972. The Cerrado vegetation of Brazil. Bot. Rev. 38, 201-341.
Fearnside, P.M., 1997. Wood density for estimating forest biomass in Brazilian Amazonia. For. Ecol. Manage. 90, 59-87.
Fehrmann, L., Kleinn, C., 2006. General considerations about the use of allometric equations for biomass estimation on the example of Norway spruce in central Europe. For. Ecol. Manage. 236, 412-421.
Giambelluca, T.W., Scholz, F.G., Bucci, S.J., Meinzer, F.C., Goldstein, G., Hoffmann, W.A., Franco, A.C., Buchert, M.P., 2009. Evapotranspiration and energy balance of Brazilian savannas with contrasting tree density. Agric. For. Meteorol. 149, 1365-1376.
Goodland, R., 1971. A physiognomic analysis of the „Cerrado‟ vegetation of Central Brazil. J. Ecol. 59, 411-419.
Grace, J., San José, J., Meir, P., Miranda, H.S., Montes, R.A., 2006. Productivity and carbon fluxes of tropical savannas. J. Biogeogr. 33, 387-400.
33
IBDF – Instituto Brasileiro de Desenvolvimento Florestal. Portaria Nº 54, de 05 de março de 1987. Retrieved June, 17, 2011 from http://www.jusbrasil.com.br/diarios/ 3442420/dou-secao-1-13-03-1987-pg-35/pdfView.
IBGE – Instituto Brasileiro de Geografia e Estatística, 2004. Mapa de biomas do Brasil. Escala 1:5.000.000. Retrieved November, 5, 2010 from http://mapas.ibge.gov.br/ biomas2/viewer.htm.
Jackson, P.C., Meinzer, F.C., Bustamante, M., Goldstein, G., Franco, A., Rundel, P.W., Caldas, L., Igler, E., Causin, F., 1999. Partitioning of soil water among tree species in a Brazilian Cerrado ecosystem. Tree Physiol. 19, 717-724.
Kauffman, J.B., Cummings, D.L., Ward, D.E., 1994. Relationships of fire, biomass and nutrient dynamics along a vegetation gradient in the Brazilian Cerrado. J. Ecol. 82, 519-531.
Ketterings, Q.M., Coe, R., Noordwijk, M. van, Ambagau, Y., Palm, C.A., 2001. Reducing uncertainty in the use of allometric biomass equations for predicting above-ground tree biomass in mixed secondary forests. For. Ecol. Manage. 146, 199-209.
Klink, C.A., Moreira, A.G., 2002. Past and current human occupation, and land use, in: Oliveira, P.S., Marquis, R.J. (Eds.), The Cerrados of Brazil. Columbia University Press, New York, pp. 69-88.
Klink, C.A., Machado, R.B., 2005. Conservation of the Brazilian Cerrado. Conserv. Biol. 19, 707-713.
Lardy, L.C., Brossard, M., Assad, M.L.L., Laurent, J.Y., 2002. Carbon and phosphorus stocks of clayey ferrasols in Cerrado native and agroecosystems, Brazil. Agric. Ecosyst. Environ. 92, 147-158.
Lenza, E., Klink, C.A., 2006. Comportamento fenológico de espécies lenhosas em um cerrado sentido restrito de Brasília, DF. Rev. Bras. Bot. 29, 627-638.
Lilienfein, J., Wilcke, W., Zimmermann, R., Gerstberger, P., Araújo, G.M., Zech, W., 2001. Nutrient storage in soil and biomass of native Brazilian Cerrado. J. Plant Nutr. Soil Sci. 164, 487-495.
34
Marris, E., 2005. Conservation in Brazil: the forgotten ecosystem. Nature 437, 944-945. McLeod, A.I., 1993. Parsimony, model adequacy and periodic correlation in time series
forecasting. Internat. Statist. Rev. 61, 387-393.
Meinzer, F.C., Goldstein, G., Franco, A.C., Bustamante, M., Igler, E., Jackson, P., Caldas, L., Rundel, P.W., 1999. Atmospheric and hydraulic limitations on transpiration in Brazilian cerrado woody species. Funct. Ecol. 13, 273-282.
Mittermeier, R.A., Gil, P.R., Hoffman, M., Pilgrim, J., Brooks, T., Mittermeier, C.G., Lamoreux, J., Fonseca, G.A.B., 2005. Hotspots revisited: Earth's biologically richest and most endangered terrestrial ecoregions. Conservation international, Arlington, Virginia.
Mokany, K.; Raison, R.J., Prokushkin, A.S., 2006. Critical analysis of root:shoot ratios in terrestrial biomes. Glob. Change Biol. 12, 84-96.
Montagu, K.D., Düttmer, K., Barton, C.V.M., Cowie, A.L., 2005. Developing general allometric relationships for regional estimates of carbon sequestration – an example using Eucalyptus pilularis from seven contrasting sites. For. Ecol. Manage. 204, 113-127.
Myers, N., Mittermeier, R.A., Mittermeier, C.G., Fonseca, G.A.B., Kent, J., 2000. Biodiversity hotspots for conservation priorities. Nature 403, 853–858
Návar, J., 2009. Allometric equations for tree species and carbon stocks for forests of northwestern Mexico. For. Ecol. Manage. 257, 427-434.
Nogueira, E.M., Fearnside, P.M., Nelson, B.W., França, M.B., 2007. Wood density in forests of Brazil‟s „arc of deforestation‟: implications for biomass and flux of carbon from land-use change in Amazonia. For. Ecol. Manage. 248, 119-135.
Oliveira-Filho, A., Ratter, J.A., 2002. Vegetation physiognomies and woody flora of the Cerrado biome, in: Oliveira, P.S., Marquis, R.J. (Eds.), The Cerrados of Brazil. Columbia University Press, New York, pp. 91-120.
35
Ottmar, R.D., Vihnanek, R.E., Miranda, H.S., Sato, M.N., Andrade, S.M.A., 2001. Séries de estereo-fotografias para quantificar a biomassa da vegetação do Cerrado do Brasil Central - vol. I. USDA/USAID/UnB. Gen. Tech. Rep. PNW-GTR-519. U.S. Department of Agriculture, Forest Service, Pacific Northwest Research Station, Portland.
Overman, J.P.M., Witte, H.J.L., Saldarriaga, J.G., 1994. Evaluation of regression models for above-ground biomass determination in Amazon rainforest. J. Trop. Ecol. 10, 207-218.
Parresol, B.R., 1999. Assessing tree and stand biomass: a review with examples and critical comparisons. For. Sci. 45, 573-593.
Ratter, J.A., Bridgewater, S., Ribeiro, J.F., 2003. Analysis of the floristic composition of the Brazilian Cerrado vegetation III: comparison of the woody vegetation of 376 areas. Edinburgh J. Bot. 60, 57-109.
Rawitscher, F., 1948. The water economy of the vegetation of the „campos cerrados‟ in Southern Brazil. J. Ecol. 36, 237-268.
Rezende, A.V., Vale, A.T., Sanquetta, C.R., Figueiredo Filho, A., Felfili, J.M., 2006. Comparação de modelos matemáticos para estimativa do volume, biomassa e estoque de carbono da vegetação lenhosa de um cerrado sensu stricto em Brasília, DF. Sci. For. 71, 65-76.
Ribeiro, J.F., Walter, B.M., 1998. Fitofisionomias do bioma Cerrado, in: Sano, S.M., Almeida, S.P. (Eds.), Cerrado: ambiente e flora. Embrapa-CPAC, Planaltina, pp. 89-166.
Sanford Jr., R., Cuevas, E., 1996. Root growth and rhizosphere interactions in tropical forests, in: Mulkey, S.S., Chazdon, R.L., Smith, A.P. (Eds.), Tropical forest plant ecophysiology. Chapman & Hall, New York, pp. 268-300.
36
Santos, J.R., Lacruz, M.S.P., Araujo, L.S., Keil, M., 2002. Savanna and tropical rainforest biomass estimation and spatialization using JERS-1 data. Int. J. Rem. Sens. 23, 1217-1229.
Sarmiento, G., 1983. The savannas of tropical America, in: Bourliere, F. (Ed.), Ecosystems of the world – Tropical savannas. Elsevier, Amsterdam, pp. 79-108.
Scholes, R.J., Archer, S.R., 1997. Tree-grass interactions in savannas. Ann. Rev. Ecol. Syst. 28, 517-544.
Scolforo, J.R., Oliveira, A.D., Acerbi Júnior, F.W., 2008. Inventário florestal de Minas Gerais: equações de volume, peso de matéria seca e carbono para diferentes fitofisionomias da flora nativa. UFLA, Lavras.
Segura, M., Kanninen, M., 2005. Allometric models for tree volume and total aboveground biomass in a tropical humid forest in Costa Rica. Biotropica 37, 2-8.
Sprugel, D.G., 1983. Correcting for bias in log-transformed allometric equations. Ecology 64, 209-210.
StatSoft Inc., 2007. STATISTICA (data analysis software system), version 8.0.
Ter-Mikaelian, M.T., Korzukhin, M.D., 1997. Biomass equation for sixty-five North American tree species. For. Ecol. Manage. 97, 1-24.
Vale, A.T., Fiedler, N.C., Silva, G.F., 2002. Avaliação energética da biomassa do Cerrado em função do diâmetro das árvores. Cienc. Florest. 12, 115-126.
Vogt, K.A., Vogt, D.J., Bloomfield, J., 1998. Analysis of some direct and indirect methods for estimating root biomass and production of forests at an ecosystem level. Plant and Soil 200, 71-89.
Wang, C., 2006. Biomass allometric equations for 10 co-occurring tree species in Chinese temperate forests. For. Ecol. Manage. 222, 9-16.
Zianis, D., Mencuccini, M., 2004. On simplifying allometric analyses of forest biomass. For. Ecol. Manage. 187, 311-332.
37
CAPÍTULO 2
ABOVE- AND BELOWGROUND BIOMASS AND
CARBON ESTIMATES FOR CLONAL
EUCALYPTUS TREES IN SOUTHEASTERN
38 Resumo