WANDERSON BUCKER MORAES
DINÂMICA ESPAÇO-TEMPORAL DA MURCHA DE CERATOCYSTIS EM Mangifera indica E ASSOCIAÇÃO DA DOENÇA A POTENCIAIS VETORES
Dissertação apresentada à Universidade Federal de Viçosa, como parte das exigências do Programa de Pós-Graduação em Fitopatologia, para obtenção do título de Magister Scientiae.
VIÇOSA
Ficha catalográfica preparada pela Seção de Catalogação e Classificação da Biblioteca Central da UFV
T
Moraes, Wanderson Bucker, 1989-M827d
2014
Dinânica espaço-temporal da murcha de Ceratocystis em
Mangifera indica e associação da doença a potenciais vetores /
Wanderson Bucker Moraes. – Viçosa, MG, 2014. viii, 89f. : il. (algumas color.) ; 29 cm. Orientador: Luiz Antonio Maffia.
Dissertação (mestrado) - Universidade Federal de Viçosa. Inclui bibliografia.
1. Ceratocystis fimbriata. 2. MurchadeCeratocystis -Epidemiologia. 3. Mangueira - Doenças e pragas.
I. Universidade Federal de Viçosa. Departamento de
Fitopatologia. Programa de Pós-graduação em Fitopatologia. II. Título.
WANDERSON BUCKER MORAES
DINÂMICA ESPAÇO-TEMPORAL DA MURCHA DE CERATOCYSTIS EM Mangifera indica E ASSOCIAÇÃO DA DOENÇA A POTENCIAIS VETORES
Dissertação apresentada à Universidade Federal de Viçosa, como parte das exigências do Programa de Pós-Graduação em Fitopatologia, para obtenção do título de Magister Scientiae.
APROVADA: 27 de fevereiro de 2014.
_________________________________ ___________________________________ Acelino Couto Alfenas André Gomes Coelho de Souza
_________________________________ _________________________________ Fabyano Fonseca e Silva Gérson Rodrigues dos Santos
_________________________________ Luiz Antonio Maffia
DEDICATÓRIA
Aos meus Pais Antonio José Moraes e Nelina Bucker Moraes Aos meus Irmãos Willian Bucker Moraes e Wallisson Bucker Moraes
“Nunca ore suplicando cargas mais leves, e sim ombros mais fortes”
AGRADECIMENTOS
A Deus, por todas as oportunidades e ter nos abençoado nas viagens para avaliação do experimento, livrando-nos dos perigos.
Aos meus pais Antonio José Moraes e Nelina Bucker Moraes, e aos meus irmãos Willian Bucker Moraes e Wallisson Bucker Moraes; por toda dedicação, apoio, compreensão e esforço. Tenho orgulho de fazer parte dessa família.
À minha namorada Cecília Chagas de Freitas por todo apoio, compreensão, paciência, carinho e amor, e por sempre estar ao meu lado durante esse período.
Aos meus familiares que sempre estiveram torcendo por mim.
Ao Prof. Dr. Luiz Antonio Maffia por acreditar no meu potencial e toda confiança depositada em mim desde o início, o que foi fundamental para que atingisse meu objetivo. Obrigado pelas oportunidades, apoio, e contribuições para meu crescimento pessoal e profissional.
Ao Prof. Dr. Waldir Cintra de Jesus Junior pela amizade e oportunidade dada para meu ingresso na carreira científica, sempre me incentivando e apoiando.
Ao Prof. Dr. Fabyano Fonseca e Silva e Prof. Dr. Gérson Rodrigues dos Santos, pela participação da banca e apoio no desenvolvimento dos trabalhos.
Ao Prof. Dr. Acelino Couto Alfenas e ao Dr. André Gomes Coelho de Souza pela participação na banca e sugestões para melhoria do trabalho.
À Universidade Federal de Viçosa (UFV) e ao Programa de Pós-Graduação em Fitopatologia, por proporcionar-me a oportunidade de ingresso ao curso de mestrado, e pelo apoio institucional para realização desse trabalho.
À Coordenação de Aperfeiçoamento de Pessoal de Nível Superior (CAPES), pela concessão da bolsa de estudo.
À empresa VALE pelo apoio financeiro ao projeto.
Aos companheiros Vinícius Garnica, Frederico Miranda, André Souza, Vinicius Stock e Yuri Hilton pelo auxílio na execução do experimento.
Aos produtores Celso, Manoel, e à Tatianne por permitir a condução dos experimentos em seus pomares.
Aos amigos Glaucio Araujo e Leonardo Peixoto pela amizade, companheirismo e convívio durante esse período.
Aos colegas do Laboratório de Epidemiologia e Controle Biológico da UFV, e do curso de pós-graduação em Fitopatologia, pela convivência durante esse período.
BIOGRAFIA
Wanderson Bucker Moraes, filho de Antonio José Moraes e Nelina Bucker Moraes, nasceu em 26 de agosto de 1989, na cidade de Alegre-Estado do Espírito Santo. Passou sua infância no distrito de Itaici, município de Muniz Freire–ES, onde concluiu o ensino fundamental na Escola Sebastião Costa, saindo em 2004 para continuar os estudos.
Em 2006, concluiu o ensino médio e o curso Técnico em Agropecuária na Escola Agrotécnica Federal de Alegre–ES. Durante esse período foi estagiário do Laboratório de Fitopatologia do Centro de Ciências Agrárias da Universidade Federal do Espírito Santo (CCA-UFES), onde iniciou sua carreira científica e pode confirmar sua vocação para Agrônomo.
Em 2007, ingressou no curso de Agronomia da Universidade Federal do Espírito Santo, formando-se em 2011. Durante todo esse período, foi bolsista de iniciação científica do Laboratório de Fitopatologia do CCA-UFES sob orientação do Prof. Dr. Waldir Cintra de Jesus Junior, tralhando com epidemiologia e manejo integrado de doenças de plantas.
SUMÁRIO
RESUMO ... vii
ABSTRACT ... viii
INTRODUÇÃO GERAL ... 9
REFERÊNCIAS ... 11
CAPÍTULO 1: Progress of Ceratocystis wilt of mango: description through a Bayesian approach and comparative analysis ... 16
ABSTRACT ... 16
1. INTRODUCTION ... 17
2. MATERIAL AND METHODS ... 19
2.1. Characterization of the experimental areas ... 19
2.2. Temporal dynamics of Ceratocystis wilt... 19
2.3. Growth models fitted to the wilt progress ... 20
2.4. Bayesian analysis in the growth models ... 20
2.5. Models comparison ... 22
2.6. Comparative epidemiology of Ceratocystis wilt ... 22
2.7. Climatic variables... 23
3. RESULTS ... 23
4. DISCUSSION ... 37
5. REFERENCES ... 40
CAPÍTULO 2: Dinâmica espaço-temporal da murcha de Ceratocystis e associação da doença a potenciais insetos vetores ... 47
RESUMO ... 47
1. INTRODUÇÃO ... 48
2. MATERIAL E MÉTODOS ... 49
2.1. Caracterização das áreas experimentais ... 49
2.2. Quantificação do progresso da murcha de Ceratocystis e insetos... 50
2.3. Dinâmica espacial da murcha de Ceratocystis ... 50
2.4. Associação espaço-temporal da murcha de Ceratocystis a coleobrocas e cupins .... 55
3. RESULTADOS ... 56
4. DISCUSSÃO ... 77
5. REFERÊNCIAS ... 81
RESUMO
MORAES, Wanderson Bucker, M.Sc., Universidade Federal de Viçosa, fevereiro de 2014. Dinâmica espaço-temporal da murcha de Ceratocystis em Mangifera indica e associação da doença a potenciais vetores. Orientador: Luiz Antonio Maffia.
ABSTRACT
MORAES, Wanderson Bucker, M.Sc., Universidade Federal de Viçosa, February, 2014. Spatio-temporal dynamics of Ceratocystis wilt in Mangifera indica and disease association with potential vectors. Adviser: Luiz Antonio Maffia.
INTRODUÇÃO GERAL
A manga (Mangifera indica L.) é uma das frutas tropicais e subtropicais mais importantes do mundo. O Brasil é o sétimo produtor mundial com produção de 1,24 milhões de toneladas de manga (Faostat, 2011), que ocupa a décima posição em termos de importância econômica dentre as frutíferas cultivadas no país (IBGE, 2011). Esta importância pode ser atribuída às diferentes formas de consumo in natura, suco, culinária e condições edafoclimáticas favoráveis ao cultivo. Os principais Estados produtores são Bahia, São Paulo, Pernambuco e Minas Gerais, responsáveis por 42, 18, 17 e 9% da produção brasileira, respectivamente (IBGE, 2011).
A ocorrência de doenças é um dos principais fatores que limitam a produção de manga. Dentre as doenças, a murcha de Ceratocystis, causada por Ceratocystis fimbriata Ceratocystis fimbriata Ellis & Halst., é uma das mais destrutivas (Ribeiro, 1980; Ploetz, 2003). Essa doença é caracterizada por levar à produção de gomose na casca das árvores infectadas, descoloração vascular dos tecidos lenhosos e morte das plantas (Viegas, 1960; Al Adawi et al., 2006).
Os danos ocasionados pela murcha de Ceratocystis representam ameaça séria à produção mundial de manga. No Brasil, a doença provoca a morte de mangueiras em diversos Estados (Ribeiro, 1997a). O primeiro relato da murcha no país ocorreu em 1938, em Pernambuco (Carvalho, 1938). Alguns anos depois, a doença dizimou
pomares de ‘Haden’ e ‘Bourbon’ no Estado de São Paulo (Viegas, 1960; Piza Jr. & Ribeiro, 1996). Atualmente, a murcha de Ceratocystis também ocorre nos Estados da Bahia, Rio de Janeiro, Minas Gerais, Paraíba, Goiás e Distrito Federal (Ribeiro, 1997a). O primeiro relato da doença fora do Brasil ocorreu em Omã e Paquistão na década de 1990. Em Oman, a murcha devastou a produção de manga (Al Adawi et al., 2006), e mais de 60 mil árvores forram mortas ou removidas desde o primeiro relato da doença, ocasionando uma redução de 47% da produção de manga nesse país de 1997 a 2007 (Al Sadi et al., 2010; Faostat, 2011). No Paquistão, a incidência da murcha já atingiu cerca 5,6% das plantas cultivada e sua importância tem-se agravado (Kazmi et al., 2005; Malik et al., 2005). É importante ressaltar que este país é quarto maior produtor mundial de manga (Faostat, 2011). Assim, a disseminação da doença no Paquistão poderá afetar a oferta mundial de manga.
raízes é causada pela infecção do fungo no sistema radicular. Inicialmente, a doença passa despercebida e, quando atinge um estádio mais avançado, ocorre a morte repentina de mangueiras. Por outro lado, a murcha da copa inicia-se por ramos finos e progride lentamente em direção ao tronco (Galli et al., 2011). A morte das plantas demora mais a ocorrer. Em função das diferenças, demanda-se descrever os aspectos temporais e espaciais associadas a cada tipo de síndrome. Esta descrição, que pode ser importante para a adoção de medidas de manejo da murcha, ainda não foi feita.
A identificação da fonte de inóculo será fundamental para manejo de epidemias associadas a cada tipo de síndrome. Conhecendo-se a dinâmica temporal de doenças, pode-se determinar a fonte de inóculo de patógenos de solo, a importância da densidade de inóculo e a forma de dispersão no solo (Sujkowski et al., 2000; Gongora-Canul et al., 2012; Ferreira et al., 2013). Com a modelagem da dinâmica temporal, também descreveram-se infecções secundárias por contato de raízes e a relevância destas infecções no progresso de epidemias (Bailey & Gilligan, 1999; Rekah et al., 1999; Suffert, 2007). Adicionalmente, determinou-se a importância do inóculo secundário disperso pelo ar no progresso de doenças causadas por patógenos de solo (Lung-Escarmant & Guyon, 2004).
As fontes de inóculo de epidemias associadas à murcha da raiz e à murcha da copa provavelmente diferem, pois acredita-se que coleobrocas sejam os principais vetores do patógeno via parte área (Viegas, 1960; Al Adawi et al., 2006). Por meio da análise da dinâmica temporal de epidemias associadas a vetores, identificou-se a importância de insetos e de plantas doentes como fontes de inóculo de doenças (Jeger et al., 2004; Batista et al., 2008; Byamukama et al., 2011; Bassanezi et al., 2013). Quando vetores são importantes no desenvolvimento da epidemia, ambos, controle do vetor e remoção de plantas doentes, reduziram o progresso da doença (Bassanezi et al., 2013). A remoção de mangueiras doentes também reduziu o progresso da murcha (Saeed et al., 2012), porém o tipo de epidemia e os mecanismos de disseminação da doença ainda não foram elucidados. Assim, demandam-se estudos sobre a dinâmica temporal da doença, visando caracterizar epidemias associadas à murcha da raiz e da copa, inclusive para identificar a importância de fontes de inóculo no progresso.
inexistem informações sobre o potencial de disseminação da doença pelo inseto dentro e entre pomares, bem como a análise de outras formas de disseminação (Masood & Saeed, 2012). Além de coleobrocas, lesões no sistema radicular, causadas por cupim e máquinas agrícolas, podem aumentar a predisposição de mangueiras à doença (Malik et al., 2004). Alguns nematóides também estão associados à murcha e podem estar envolvidos no processo de transmissão (Anwar et al., 2012). O contato de raízes de plantas doentes com plantas sadias e a enxertia de raízes podem transmitir doenças causadas por Ceratocystis spp. (Blaedow & Juzwik, 2010; Wu et al., 2011). Estes mecanismos também podem estar envolvidos na transmissão da doença, principalmente em sistemas de cultivo adensado (Masood & Saeed, 2012).
A descrição do padrão espacial auxilia a visualizar os processos associados à disseminação das doenças e a desenvolver hipóteses sobre os mecanismos físicos e biológicos que influenciam o progresso de epidemias (Pethybridge et al., 2005; Gent et al., 2008; Skelsey et al., 2010). Por meio do conhecimento dos padrões espaciais de doenças, pode-se entender a interação vetor-patógeno, responsável por ocasionar epidemias (Henne et al., 2012). Por outro lado, com a quantificação dos padrões espaciais pode-se obter informações sobre prováveis fontes primárias de inóculo e determinar a importância epidemiológica dos parâmetros espaciais (Byamukama et al., 2011).
Uma melhor compreensão das fontes de inóculo e dos mecanismos de disseminação da murcha de Ceratocystis auxiliará na adoção de medidas de manejo mais eficazes. Assim, em vista da importância da doença e da carência de informações sobre sua epidemiologia, objetivou-se: i) estudar a dinâmica temporal da murcha de Ceratocystis, adotando-se a análise bayesiana em modelos de crescimento; ii) analisar a dinâmica espacial da doença; e iii) verificar a associação espaço-temporal da murcha com coleobrocas e cupins em duas regiões produtoras. Dividiu-se este trabalho em dois capítulos, descritos a seguir.
REFERÊNCIAS
AL ADAWI, A.O.; DEADMAN, M.L.; AL RAWAHI, A.K.; AL MAQBALI, Y.M.; AL JAHWARI, A.A.; AL SAADI, B.A.; AL AMRI, I.S.; WINGFIELD, M.J. Aetiology and causal agents of mango sudden decline disease in the Sultanate of Oman. European Journal of Plant Pathology, v.116, n.4, p.247-254, 2006.
AL SADI, A.M.; AL OUWEISI, F.A.; AL SHARIANI, N.K.; AL ADAWI, A.O.; KAPLAN, E.J.; DEADMAN, M.L. Histological changes in mango seedlings following infection with Ceratocystis manginecans, the cause of mango decline. Journal of Phytopathology, v.158, n.11-12, p.738-743, 2010.
ANWAR, S.A.; MCKENRY, M.V.; AHMAD, H.A. Nematode and fungal communities associated with mango decline of southern Punjab. Pakistan Journal of Zoology, v.44, n.4, p.915-922, 2012.
BAILEY, D.J.; GILLIGAN, C.A. Dynamics of primary and secondary infection in take-all epidemics. Phytopathology, v.89, n.1, p.84-91, 1999.
BASSANEZI, R.B.; MONTESINO, L.H.; GIMENES-FERNANDES, N.; YAMAMOTO, P.T.; GOTTWALD, T.; AMORIM, L.; BERGAMIN FILHO, A. Efficacy of area-wide inoculum reduction and vector control on temporal progress of huanglongbing in young sweet orange plantings. Plant Disease, v.97, n.6, p.789-796, 2013.
BATISTA, L.; VELÁZQUEZ, K.; ESTÉVEZ, I.; PEÑA, I.; LÓPEZ, D.; REYES, M.L.; RODRÍGUEZ, D.; LARANJEIRA, F.F. Spatiotemporal dynamics of Citrus tristeza virus in Cuba. Plant pathology, v.57, n.3, p.427-437, 2008.
BLAEDOW, R.A.; JUZWIK, J. Spatial and temporal distribution of Ceratocystis fagacearum in roots and root grafts of oak wilt affected red oaks. Journal of Arboriculture, v.36, n.1, p.28-34, 2010.
BYAMUKAMA, E.; ROBERTSON, A.E.; NUTTER, F.W. Quantifying the within-field temporal and spatial dynamics of bean pod mottle virus in soybean. Plant Disease, v.95, n.2, p.126-136, 2011.
FAOSTAT. Database Results. Disponível em: <http://faostat.fao.org/site/567/default.aspx#ancor>. Acesso em: 15 mar. 2013.
FERREIRA, M.A.; HARRINGTON, T.C.; GONGORA-CANUL, C.C.; MAFIA, R.G.; ZAUZA, E.A.V.; ALFENAS, A.C. Spatial–temporal patterns of Ceratocystis wilt in Eucalyptus plantations in Brazil. Forest Pathology, v.43, n.2, p.153-164, 2013.
GALLI, J.A.; MARTINS, A.L.M.; ITO, M.F.; BRAGHINI, M.T.; NARITA, N.; ROSSETTO, C.J. Seca-da-mangueira xxii. sobrevivência de variedades poliembriônicas. Revista Brasileira de Fruticultura, v.33, n.4, p.1119-1126, 2011. GENT, D.H.; TURECHEK, W.W.; MAHAFFEE, W.F. Spatial and temporal stability of the estimated parameters of the binary power law. Phytopathology, v.98, n.10, p.1107-1117, 2008.
GONGORA-CANUL, C.; NUTTER, F.W., JR; LEANDRO, L.F.S. Temporal dynamics of root and foliar severity of soybean sudden death syndrome at different inoculum densities. European Journal of Plant Pathology, v.132, n.1, p.71-79, 2012.
HENNE, D.C.; WORKNEH, F.; RUSH, C.M. Spatial patterns and spread of potato zebra chip disease in the Texas Panhandle. Plant Disease, v.96, n.7, p.948-956, 2012. IBGE. Produção agrícola municipal: culturas temporárias e permanentes. Rio de Janeiro: IBGE, v.38, 2011. 97 p.
JEGER, M.J.; HOLT, J.; VAN DEN BOSCH, F.; MADDEN, L.V. Epidemiology of insect transmitted plant viruses: modelling disease dynamics and control interventions. Physiological Entomology, v.29, n.3, p.291-304, 2004.
KAZMI, M.R.; FATEH, F.S.; MAJEED, K.; KASHKHELY, A.M.; HUSSAIN, I.; AHMAD, I.; JABEEN, A. Incidence and etiology of mango sudden death phenomenon in Pakistan. Pakistan Journal of Phytopathology, v.17, n.2, p.154-158, 2005.
MALIK, M.T.; ALTAF, A.D.; SULTAN, M.K. Some manageable predisposing factors of collar/stem rot of mango. Pakistan Journal of Phytopathology, v.16, n.1, p.37-42, 2004.
MALIK, M.T.; KHAN, S.M.; DASTI, A.A.; KAZMI, M.R. First record of Ceratocystis fimbriata, causal organism of mango sudden death in Pakistan. Pakistan Journal of Phytopathology, v.17, p.187-191, 2005.
MASOOD, A.; SAEED, S. Bark beetle, Hypocryphalus mangiferae Stebbing (Coleoptera: Curculionidae: Scolytinae) is a vector of mango sudden death disease in Pakistan. Pakistan Journal of Botany, v.44, n.2, p.813-820, 2012.
PETHYBRIDGE, S.J.; ESKER, P.; HAY, F.; WILSON, C.; NUTTER, F.W. Spatiotemporal description of epidemics caused by Phoma ligulicola in Tasmanian pyrethrum fields. Phytopathology, v.95, n.6, p.648-658, 2005.
PINTO, A.C.Q. Melhoramento genético da manga (Mangifera Indica L.) no Brasil. In: ROZANE, D.E.; DAREZZO, R.J.; AGUIAR, R.L.; AGUILERA, G.H.A.; ZAMBOLIM, L. (Eds.). Manga: produção integrada, industrialização e comercialização. Viçosa: Editora UFV, 2004. p.17-78.
PIZA JR., C.T.; RIBEIRO, I.J.A. Principais doenças da mangueira. In: SÃO JOSÉ, A.R.; SOUZA, I.V.B.; MARTINS FILHO, J.; MORAES, O.M. (Eds.). Manga: tecnologia de produção e mercado. Vitória da Conquista: DFZ/UESB, 1996. p.167-201.
PLOETZ, R.C. Diseases of mango. In: PLOETZ, R.C. (Ed.). Diseases of tropical fruit crops. Wallingford: CAB International, 2003. p.327-363.
REKAH, Y.; SHTIENBERG, D.; KATAN, J. Spatial distribution and temporal development of fusarium crown and root rot of tomato and pathogen dissemination in field soil. Phytopathology, v.89, n.9, p.831-839, 1999.
RIBEIRO, I.J.A. Doenças da mangueira (Mangifera indica L.). In: KIMATI, H.; AMORIM, A.; BERGAMIN FILHO, A.; CAMARGO, L.E.A.; REZENDE, J.A.M. (Eds.). Manual de Fitopatologia. São Paulo: Agronômica Ceres, v.2, 1997.
ROSSETTO, C.J.; RIBEIRO, I.J.A. Seca da mangueira xii. recomendações de controle. Revista de Agricultura, v.65, n.2, p.173-180, 2002.
SAEED, S.; MASOOD, A.; KHAN, S.M. Diseased plants as a source of dissemination of mango sudden death disease in healthy mango plants. Pakistan Journal of Phytopathology, v.24, n.1, p.21-25, 2012.
SKELSEY, P.; ROSSING, W.A.H.; KESSEL, G.J.T.; VAN DER WERF, W. Invasion of Phytophthora infestans at the landscape level: how do spatial scale and weather modulate the consequences of spatial heterogeneity in host resistance? Phytopathology, v.100, n.11, p.1146-1161, 2010.
SUFFERT, F. Modélisation de cinétiques de la maladie de la tache de la carotte provoquée par un complexe d'agents pathogènes du genre Pythium dominé par le Pythium violae. Canadian Journal of Plant Pathology, v.29, n.1, p.41-55, 2007.
SUJKOWSKI, L.S.; PARRA, G.R.; GUMPERTZ, M.L.; RISTAINO, J.B. Temporal dynamics of Phytophthora blight on bell pepper in relation to the mechanisms of dispersal of primary inoculum of Phytophthora capsici in soil. Phytopathology, v.90, n.2, p.148-156, 2000.
VIEGAS, A.P. Seca da mangueira. Bragantia, v.19, n.11, p.163–182, 1960.
CAPÍTULO 1
Progress of Ceratocystis wilt of mango: description through a Bayesian approach and comparative analysis
ABSTRACT
Ceratocystis wilt, caused by Ceratocystis fimbriata, is a destructive mango disease, and its epidemiology is poorly understood. The objective of the study was to describe the temporal dynamics of the disease with an emphasis on the use of Bayesian analysis in growth models, as well as to compare epidemics from two producing regions. Epidemics of Ceratocystis wilt were followed over 15 months in five experimental units, two in Itaocara–Rio de Janeiro State (A1RJ and A2RJ) and three in Frutal–Minas Gerais State (A1MG, A2MG, and A3MG). The logistic, Gompertz, and monomolecular models were fitted through Bayesian analysis to data gotten at monthly evaluations of incidence, severity, and death due to the disease. The best goodness of fit was with the Gompertz model, from which samples of the marginal posterior distribution of the parameters were used to compare the epidemics. Higher values of the initial and maximum incidence, severity, and plant death were found in the marginal posterior distribution of the Itaocara epidemics. The marginal posterior distribution of the A2RJ epidemic had a higher incidence rate, whereas the distributions of the A1RJ, A1MG, A2MG, and A3MG epidemics did not differ. Lower values of severity and mortality rate were observed in the marginal posterior distribution of the Itaocara epidemics, and there were no differences between the distributions of the Frutal epidemics. The pattern of occurrence of the disease in each plant also differed between the regions. When the disease was first detected, the severity values in each plant in Itaocara varied from 0.1 to 60%, whereas the severity value in Frutal was always 100%. In Itaocara, it took longer for the diseased plants to die than in Frutal. It was concluded that the temporal dynamics of Ceratocystis wilt in Itaocara and Frutal differed most likely because of differences regarding the initial inoculum and pathogen dispersal. This study is the first to quantify the temporal dynamics of Ceratocystis wilt, and provides new quantitative information that should be useful in the management specific to each pattern of occurrence of the disease.
1. INTRODUCTION
Mango (Mangifera indica L.) is an important tropical and subtropical fruit worldwide. Among the diseases that reduce the production of mango is the destructive Ceratocystis wilt, which is caused by Ceratocystis fimbriata Ellis & Halst. (Ribeiro, 1980; Ploetz, 2003). Currently, Ceratocystis wilt is seriously threatening worldwide mango production because it causes the plants death without regard to age in many Brazilian States (Ribeiro, 1997b) and in other countries where the disease has been introduced, such as Oman and Pakistan (Malik et al., 2005; Al Adawi et al., 2006).
There are two types of syndromes associated with the disease differentiated by the described symptoms (Rossetto & Ribeiro, 2002; Pinto, 2004): root rot and crown rot. Root rot is caused by the infection of the root system. Initially, the disease goes unnoticed, and as it progress to a more advanced stage, the mango plants suddenly die. Crown rot usually begins in the thin branches and progresses slowly toward the trunk (Galli et al., 2011), and death takes longer to occur. Due to these differences, there is a need to describe the aspects of both syndromes. This description can be important in adopting disease management strategies and has not yet been pursued. For instance, identifying the inoculum source will be fundamental to the management associated with each type of syndrome.
wilt need to be studied to characterize the epidemics associated with root rot and crown root, including identifying the importance of inoculum sources in the disease progress.
Growth models are highly used to describe the temporal dynamics of diseases, and model parameter estimates are carried out by the method of least squares, whose disadvantages include the normality assumption for the error, the inability to directly compare growth curves, the unrealistic parameter estimates, particularly when there are few longitudinal observations (Blasco et al., 2003; De La Cruz, 2008), and is based in asymptotic results and that it is often difficult to ensure whether such approximations are valid (De La Cruz-Mesía & Marshall, 2006). Additionally, incidence of plant disease is a binary variable, which assumes binomial distribution principally when there are few observations (sample size) in each time and small values of incidence (Madden & Hughes, 1995), and this method suffering of the lack of robustness against skewness from distributional normality (Madden & Hughes, 1995; De La Cruz, 2008).
The Bayesian analysis is a very robust statistical method applied to situations in which the traditional least square method has failed (Box & Tiao, 1974; Moyé, 2007). This analysis does not impose restrictive assumptions of normality on sampling distributions of parameters (Yuan & Mackinnon, 2009), and other distributions besides the normal can be assumed for the error (De La Cruz & Branco, 2009). The use of Bayesian analysis also reduces the number of the biased parameter estimates, even with few longitudinal dates, because the model is less dependent on the number of data pairs (Blasco et al., 2003; Yuan & Mackinnon, 2009). Moreover, growth curves can be directly compared because inferences about each parameter are made over their posterior distributions without using the asymptotic theory (Blasco et al., 2003; Patwardhan et al., 2012). The credibility intervals of the parameters obtained by Bayesian analysis are more accurate than the confidence intervals of the least square method, because all of the uncertainties of the parameters are considered (Gelman et al., 1997). Information passed also allows for the inclusion of prior distributions, increasing the efficiency of the parameter estimates. Although the Bayesian analysis can assist in describing the temporal dynamics of plant diseases, it is still not widely used to describe the progress of epidemics.
specific control strategies. The description of wilt epidemics with the parameters estimated through the method of least squares is limited mostly when the epidemics are studied polietically. Otherwise, the Bayesian analysis is potentially usefully to study the temporal disease dynamics. Thus, we aimed to study the progress of Ceratocystis wilt through comparative epidemiology with an emphasis on the use of Bayesian analysis in growth models. This study is the first attempt to characterize wilt epidemics associated with both types of syndromes.
2. MATERIAL AND METHODS
2.1. Characterization of the experimental areas
The data were gathered from commercial orchards located in Itaocara-RJ (hilly topography, 76 m asl, 42°4'54"W, 21°40'33"S, ungrafted 'Espada' trees without any cultural practice) and Frutal-MG (flat topography, 536 m asl, 48°55'10"W, 20°1'11"S, 'Palmer' grafted on 'Rosinha' trees subjected to the recommended crop practices, except for irrigation). According to the international classification of Köppen, the climate of both sites is "Aw" (tropical with a dry season during the winter).
Five experimental units were installed: two in Itaocara (A1RJ and A2RJ) and three in Frutal (A1MG, A2MG, and A3MG). Each unit consisted of a distinct plant age, cropping system, and number of plants: A1RJ, 25-years-old, 13x10 m spacing, and 287 plants; A2RJ, 25-years-old, 13x10 m spacing, and 244 plants; A1MG, 10-years-old, 8x6 m spacing, and 607 plants; A2MG, 3-years-old, 8x4 m spacing, and 702 plants; and A3MG, 1-year-old, 8x4 m spacing, and 572 plants.
2.2. Temporal dynamics of Ceratocystis wilt
2.3. Growth models fitted to the wilt progress
The logistic (1), Gompertz (2), and monomolecular (3) models (Campbell & Madden, 1990) were reparametrized (Gilligan, 1990) to describe the progress of incidence, severity, and plant death, as follows:
i i
i y a y rx
y 0( 0)/(1exp( ( ))) (1)
i i
i y a y r x
y 0( 0)exp(exp( ( ))) (2)
i i
i a y rx
y [ (1 0exp( )] (3)
where yi is the wilt intensity in the time xi;y0 is the initial intensity; a is the maximum intensity; r is the progress rate; is the inflection point of r; and i is the
random error.
2.4. Bayesian analysis in the growth models
The model parameters were estimated through the Bayesian analysis (Box & Tiao, 1974) as follows:
) ( ) | ( ) |
( y L y p
p (4)
where p(|y) is the joint posterior distribution for the parameters (); L(y|) is the likelihood function of the sample data; and p()is the prior distribution of .
The normal distribution was used to describe the sample data by the models 1, 2, and 3 respectively as follows:
( )/(1 exp( ( ))),
, [ , , , ]( ~ ,
| 2 N y0 a y0 r x 2 y0 ar
yi e i e (5)
( )exp( exp( ( ))),
, [ , , , ]( ~ ,
| 2 N y0 a y0 r x 2 y0 a r
yi e i e (6)
, [ , , ] 2 )], exp( 0 1 ( ([ ~ 2 ,| e N a y rxi e y0 a r
i
y (7)
Thus, the likelihood function assumed normal distribution of the data for the models 1, 2, and 3 was respectively given as follows:
The binomial distribution also was used to describe the progress of incidence and plant death by the models 1, 2, and 3 respectively as follows:
where yi is the number of symptomatic and dead of plants, p is the probability of symptomatic and death of plants, and n is the total number of plants in each plot.
Thus, the likelihood function assumed binomial distribution of the data for the models 1, 2, and 3 was respectively given as follows:
i n yi
i N
i
y
i y a y r x
x r y a y n y L
( )/(1 exp( ( ))) {1 ( )/(1 exp( ( )))} ), |
( 0 0
1
0
0
(14)
i n yi
i N
i
y
i y a y r x
x r y a y n y L
( )exp( exp( ( ))) {1 ( )exp( exp( ( )))} ), |
( 0 0
1
0
0
(15)
i n yi
i N
i
y
i a y rx
rx y a n y L
(1 exp( ) {1 (1 exp( )} ) , | ( 0 1 0 (16)In view of the lack of information for modeling the progress of Ceratocystis wilt, the uniform distribution was used as an uninformative prior for the model parameters
)
( . The variance of the models that assumed normal distribution of the data was calculated using tau ( 12
e
), and the inverse gamma distribution was used as the prior of this parameter. Thus, the prior distributions and for each model are given as follows: ) , ( ~ 1 ; ) , ( ~
2
Uniform LlowLupper GI
e
(17)
where Llow and Lupper are the lower and upper limits, respectively, of the uniform distribution (hyperparameters); 2
e
is the variance of each model, and and are the hyperparameters of the inverse gamma distribution.
The marginal posterior distributions of the parameters of models were estimated by the Markov Chain Monte Carlo (MCMC) integration methods, implemented in the OpenBUGS software (v. 1.4.3, Biostatistics Unit, Cambridge, UK). One chain with 200,000 iterations was simulated, of which the first half was eliminated during the burn-in period to avoid the burn-influence of the burn-initial values. The samples were collected from every 10 observations (thin) in 100,000 iterations remaining to ensure that the serial correlations were null or very small. Thus, the inferences of the marginal posterior distributions of the parameters were based on the 10,000 final samples. The criteria of
( )/(1 exp( ( ))) , , [ , , , ]
( Binomial ~
, ,
|p n p y0 a y0 r x n y0 ar
yi i (11)
( )exp( exp( ( ))), ), [ , , , ]
( Binomial ~
, ,
|p n p y0 a y0 r x n y0 ar
yi i (12)
] , , [ ), )], exp( 1 ( [ ( Binomial ~ , ,
|p n p a y0 rx n y0ar
Geweke (1992) and of Raftery e Lewis (1992) were employed for the convergence diagnosis of the chains through the boa package of the R software (v. 2.15.2, R Development Core Team, Vienna, AT).
2.5. Models comparison
The Deviance Information Criterion (DIC) was used to select the best model. The samples of the posterior distribution of the model parameters obtained by MCMC simulation were used to calculate the DIC (Spiegelhalter et al., 2002) as follows:
pD D M D D
DIC2 ( ) (18)
given that
y
D M
M E M d M y M p M y p
D2log ( , ) ( (19)
) , ( log 2 )
( M P y M M
D (20)
where Mis the mean vector of all of the model parameters at the end of MCMC sampling process; M is the sample values of all of the model parameters in a given iteration of MCMC; and pD DD(M) is the effective number of parameters.
Thus, the DIC combines the measurements of fit ( D ) and complexity (pD) of the models. A model with the lowest value of DIC is considered the most plausible (Spiegelhalter et al., 2002). In addition, to select the best model, we also considered the plots of the standardized residues and of the predicted values in the function of the observed values; and evaluated the existence of temporal dependence, seasonality, and residue trend using tests of autocorrelation, Friedman, and Wald-Wolfowitz, respectively (Wald & Wolfowitz, 1940; Hollander & Wolfe, 1979; Li & Mak, 1994).
2.6. Comparative epidemiology of Ceratocystis wilt
The importance of the initial intensity (y0) and the progress rate (r) to epidemics
was determined. The progress curves of the five epidemics were also compared using the samples differences in the marginal distributions of the parameters. The hypothesis of parameter equality was tested using the interval of high probability density (HPD) at 5% of the sample of the marginal posterior distributions of the differences.
severity and plant death were related to the disease incidence through linear regression. The equality of the values of severity and plant death to incidence was verified by simultaneous test of the 00 and 11; using the statistic F modified from Graybill (1976), that have H0:'0 1. The Lin’s concordance correlation coefficient also was
used to assess the relational of the best-fit linear regression line to the line of concordance (45°) (Lin, 1989), defined as:
b
c rC
) ( 2 2 1 2 2 2 1 12 (21)
where Cb is a bias correction factor that measures how far the best-fitting line of the linear regression deviates from 45°, and r is the Pearson correlation coefficient that measures how far each observation deviated from the best-fit line.
2.7. Climatic variables
The hourly temperature (ºC) and relative air humidity (RH, %) were monitored using Hobo temperature and RH sensors (Onset Computer Corp., Pocasset, MA) set in the center of each area at a 1.5 m height. The daily rainfall data were collected from a meteorological station of the National Meteorological Institute (INMET) at approximately 4 km from each area.
3. RESULTS
The chains of the samples of the marginal posterior distributions of all model parameters converged according to the two methods tested. Thus, the samples generated by the complete conditional distributions represent the marginal posterior distribution of each parameter.
severity with likelihood normal (Table 2 and Figure 1) using the differences in the marginal posterior distributions of the parameters.
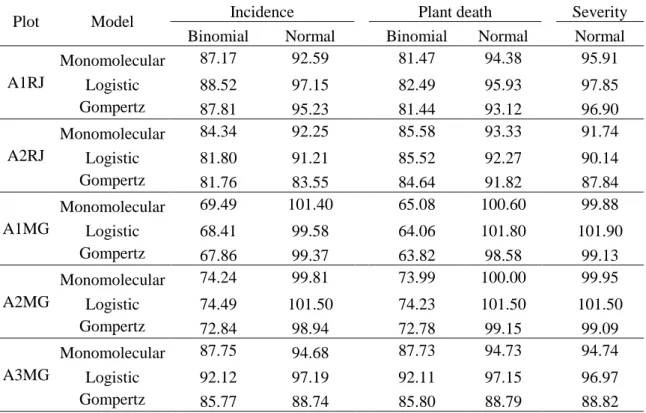
Table 1. Deviance Information Criterion (DIC) of the models fitted to the data of incidence and plant death assumed normal and binomial distribution, and severity assumed normal distribution, in Itaocara-RJ (A1RJ and A2RJ) and Frutal-MG (A1MG, A2MG, and A3MG).
Plot Model Incidence Plant death Severity
Binomial Normal Binomial Normal Normal
A1RJ
Monomolecular 87.17 92.59 81.47 94.38 95.91
Logistic 88.52 97.15 82.49 95.93 97.85
Gompertz 87.81 95.23 81.44 93.12 96.90
A2RJ
Monomolecular 84.34 92.25 85.58 93.33 91.74
Logistic 81.80 91.21 85.52 92.27 90.14
Gompertz 81.76 83.55 84.64 91.82 87.84
A1MG
Monomolecular 69.49 101.40 65.08 100.60 99.88
Logistic 68.41 99.58 64.06 101.80 101.90
Gompertz 67.86 99.37 63.82 98.58 99.13
A2MG
Monomolecular 74.24 99.81 73.99 100.00 99.95
Logistic 74.49 101.50 74.23 101.50 101.50
Gompertz 72.84 98.94 72.78 99.15 99.09
A3MG
Monomolecular 87.75 94.68 87.73 94.73 94.74
Logistic 92.12 97.19 92.11 97.15 96.97
Gompertz 85.77 88.74 85.80 88.79 88.82
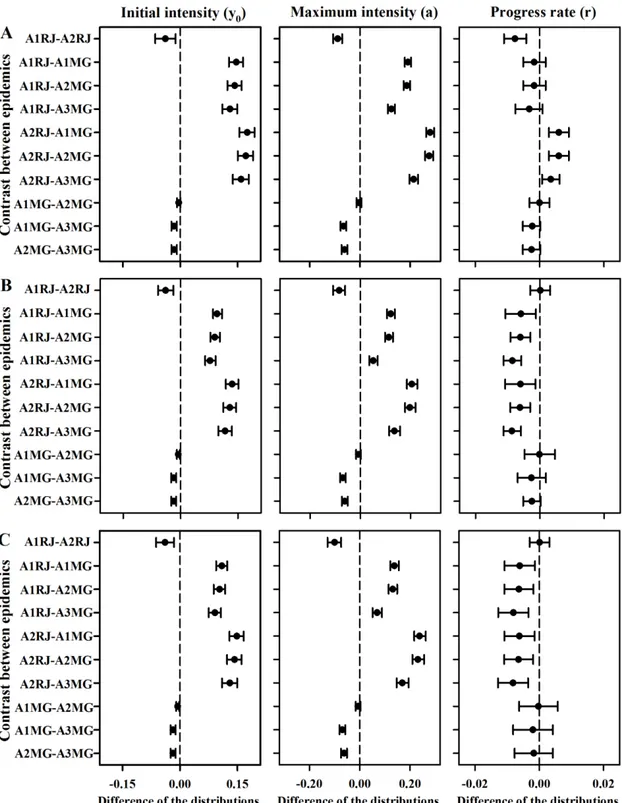
Greater initial and maximum values of incidence, severity, and plant death were found in the marginal posterior distributions of the Itaocara epidemics compared with those of the Frutal epidemics (Figure 2). In Itaocara, greater initial and maximum values of incidence, severity, and plant death were found in the marginal posterior distributions of the A2RJ epidemics. In Frutal, greater initial and maximum values of incidence, severity, and plant death were found in the marginal posterior distributions of the A3MG epidemics; the distributions of the A1MG and A2MG epidemics did not differ.
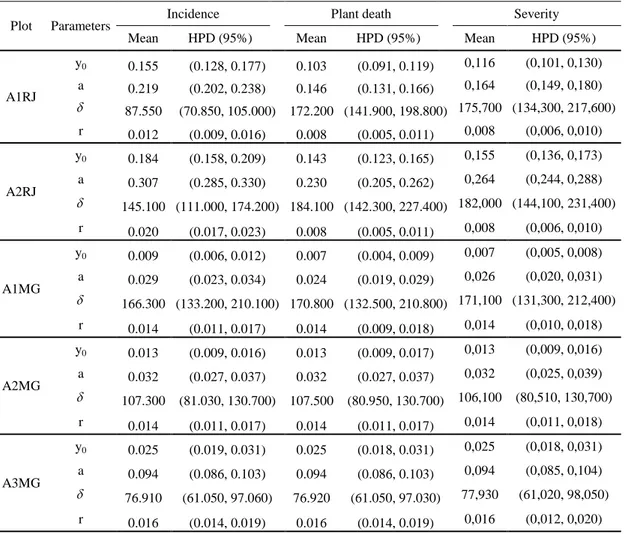
Table 2. Posterior mean and intervals of the highest probability density (HPD) of the Gompertz model parameters for incidence and plant death (likelihood binomial), and severity (likelihood normal) of the Ceratocystis wilt in Itaocara-RJ (A1RJ and A2RJ) and Frutal-MG (A1MG, A2MG, and A3MG).
Plot Parameters Incidence Plant death Severity
Mean HPD (95%) Mean HPD (95%) Mean HPD (95%)
A1RJ
y0 0.155 (0.128, 0.177) 0.103 (0.091, 0.119) 0,116 (0,101, 0,130)
a 0.219 (0.202, 0.238) 0.146 (0.131, 0.166) 0,164 (0,149, 0,180)
87.550 (70.850, 105.000) 172.200 (141.900, 198.800) 175,700 (134,300, 217,600)
r 0.012 (0.009, 0.016) 0.008 (0.005, 0.011) 0,008 (0,006, 0,010)
A2RJ
y0 0.184 (0.158, 0.209) 0.143 (0.123, 0.165) 0,155 (0,136, 0,173)
a 0.307 (0.285, 0.330) 0.230 (0.205, 0.262) 0,264 (0,244, 0,288)
145.100 (111.000, 174.200) 184.100 (142.300, 227.400) 182,000 (144,100, 231,400)
r 0.020 (0.017, 0.023) 0.008 (0.005, 0.011) 0,008 (0,006, 0,010)
A1MG
y0 0.009 (0.006, 0.012) 0.007 (0.004, 0.009) 0,007 (0,005, 0,008)
a 0.029 (0.023, 0.034) 0.024 (0.019, 0.029) 0,026 (0,020, 0,031)
166.300 (133.200, 210.100) 170.800 (132.500, 210.800) 171,100 (131,300, 212,400)
r 0.014 (0.011, 0.017) 0.014 (0.009, 0.018) 0,014 (0,010, 0,018)
A2MG
y0 0.013 (0.009, 0.016) 0.013 (0.009, 0.017) 0,013 (0,009, 0,016)
a 0.032 (0.027, 0.037) 0.032 (0.027, 0.037) 0,032 (0,025, 0,039)
107.300 (81.030, 130.700) 107.500 (80.950, 130.700) 106,100 (80,510, 130,700)
r 0.014 (0.011, 0.017) 0.014 (0.011, 0.017) 0,014 (0,011, 0,018)
A3MG
y0 0.025 (0.019, 0.031) 0.025 (0.018, 0.031) 0,025 (0,018, 0,031)
a 0.094 (0.086, 0.103) 0.094 (0.086, 0.103) 0,094 (0,085, 0,104)
76.910 (61.050, 97.060) 76.920 (61.050, 97.030) 77,930 (61,020, 98,050)
r 0.016 (0.014, 0.019) 0.016 (0.014, 0.019) 0,016 (0,012, 0,020)
¹Parameters: y0= initial intensity, a= maximum intensity, = time for the disease to
Figure 2. Posterior distributions for the parameters difference of the progress curves of incidence (A), plant death (B) and severity (C) of the mango from the fitting of Gompertz model. When the 95% HPD interval for the difference includes zero (broken line), the parameters are not different.
the A3MG epidemics were 376, 130, and 130% greater than those of the A1MG and A2MG epidemics, respectively.
Figure 3. Area under the progress curve (AUDPC) of incidence, plant death, and severity of Ceratocystis wilt in Itaocara-RJ (A1RJ and A2RJ) and Frutal-MG (A1MG, A2MG, and A3MG).
The wilt epidemics exhibited different patterns depending on the region. In Itaocara, the severity values varied in a continuum from 0.1 to 100% (Figure 4A and 4B), whereas in Frutal, the severity in a diseased plant was always 100% in the A2MG and A3MG epidemics (Figure 4D). In the A1MG epidemic, there were two severity frequency classes (0.1 to 20% and 100%); only the frequency of plants with a 100% severity increased (Figure 4C).
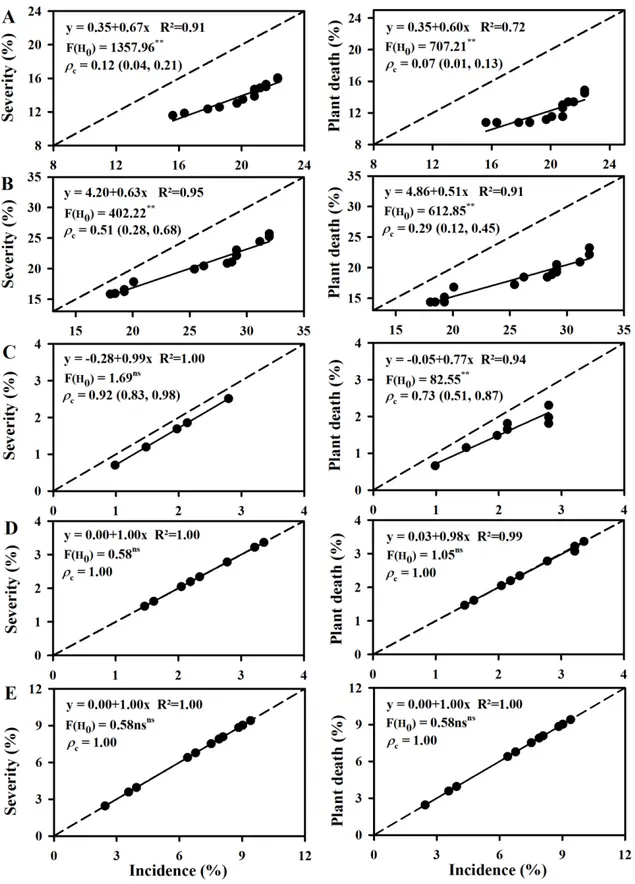
The disease severity values differed of the incidence in the Itaocara epidemics,
based on test F and Lin’s concordance correlation analysis (Figure 5). The slope of the
Figure 5. Linear regression of the severity on incidence (A and B) and of death on incidence (C and D) over time in Itaocara-RJ and Frutal-MG. Dashed line represents severity and plant death equals incidence. F (H0) with * and ** indicate the intercept ≠ 0
and slope≠1 at the level 5 and 1%, respectively,and ns denotes no significance. c is
the Lin’s concordance correlation coefficient with de confidence interval 95% between
These results are due to the different patterns of symptoms. In Itaocara, the disease severity of each plant during the first detection ranged from 0.1 to 30% in A1RJ and from 0.1 to 60% in A2RJ (Figure 6A and 6B); 86% of the diseased plants in A2RJ had between 0.1 to 30% severity. However, in Frutal, the initial wilt severity of each plant was always 100% (Figure 6C to E). Thus, during the first detection in Itaocara, only part of the crown of the plants was symptomatic (Figure 7A and B), whereas in Frutal, all branches of a diseased plant were symptomatic (Figure 7C to F). In addition, the diseased plants of Itaocara initially had a darkening of the wood tissues in branches that progressed towards the trunk (Figure 8A to F); in Frutal, the wood darkening was concentrated in the roots and toward the base of the trees (Figure 8G to P).
The time required for the diseased plants to die also differed between the regions. The plant death values differed of the disease incidence in the A1RJ, A2RJ, and A1MG
epidemics, based on test F and Lin’s concordance correlation analysis (Figure 5A to C).
The slope of the line of plant death regressed on disease incidence was <1.0 in A1RJ (0.60), A2RJ (0.57), and A1MG (0.77). Thus, over time, the speed of the increase in plant death was less than that of the detection of diseased plants in Itaocara (Figure 5 A and B). Although the increase in death in A1MG was also lower than the wilt detection,
the slope of this epidemic was greater than that of the Itaocara epidemics (p ≤ 0.05).
These results are attributed to the different time spans between wilt detection and plant death among the plots (Figure 7). In Itaocara, the time between detection and plant death lasted for more than 320 days in 84 and 70% of diseased plants in the A1RJ and A2RJ plots, respectively (Figure 7A and 7B); in Frutal, the time between detection and death was shorter: for A1MG, 25% of the diseased plants were dead as soon as wilt was noticed, and 75% died between 55 to 106 days after the disease detection (Figure 7C); in A2MG, 93% of the diseased plants died as soon as the wilt was noticed, and 7% died 30 days after wilt detection (Figure 7D); and in A3MG, 100% of the plants were dead as soon as the wilt was noticed (Figure 7E).
Figure 10. Absolute frequency of the hourly air temperature in Itaocara-RJ and Frutal-MG.
4. DISCUSSION
Although wilt is becoming important in mango production, there is no knowledge regarding the disease epidemics. This study provides the first comprehensive, quantitative analysis concerning the temporal dynamics of Ceratocystis wilt epidemics on mango, and characterizes the associated disease syndromes. The pattern of symptoms of the onset of Ceratocystis wilt and the time to death of the diseased trees differed between the two regions studied. In Itaocara, the symptoms were noticed on a few branches of a diseased plant, and the symptoms appeared on the remaining healthy branches as the disease progressed on the plant. Otherwise, in Frutal, the symptoms appeared in all branches of a tree during the first assessment. The different patterns of symptom onset in a region are related with the time to death of trees; and in Itaocara, the diseased plants took longer to die than in Frutal.
2013).
The darkening of the wood tissue of the diseased plants in Itaocara was first noticed on the branches, whereas in Frutal, the darkening was concentrated in the roots toward the base of the trees. Thus, in Itaocara, the pathogen first colonized the branches, causing vascular system obstruction and external disease symptoms only in the branches located above the inoculation point. In Frutal, the pathogen colonized the roots and the base of a tree where the xylem vessels were blocked, immediately inducing the external symptoms on all branches of a tree. This reasoning explains the different patterns of symptom onset in each region.
In Itaocara, the darkening of the wood tissue of the diseased branches progressed downwards the trunk; a diseased plant died only after the pathogen moved and colonized the tissues below the infection point. Otherwise, in Frutal, all branches of a diseased plant died suddenly because the pathogen first infected the roots and then moved toward the stem. We also assume that the distance the pathogen moved until reaching the trunk was greater in Itaocara than that in Frutal. Furthermore, the movement of the pathogen inside the plant followed the water flow in Frutal and was in the opposite direction in Itaocara. The movement of fungi that colonize the xylem is faster in the upward direction (Hart & Landis, 1971; Baayen & De Maat, 1987; Solla & Gil, 2002b; Mandeel, 2006). In mango seedlings, Al Sadi et al. (2010) observed that the pathogen moves both upward and downward the stem and that the severity of wood discoloration above the inoculation point was greater. Hart e Landis (1971) found that when Ophiostoma ulmi (sin. Ceratocystis ulmi) was inoculated the base of an elm tree, it moved quickly to the main branches; when it was inoculated in the upper branches, the colonization extension rate was smaller. For the authors, the smaller the distance the fungus must move downward to reach the main sap stream, the more swift and severe is the development of symptoms. Therefore, it is plausible to find that that the mango trees died faster in Frutal.
There were also differences in the time to death in Frutal regarding plant age. Plants from the A2MG and A3MG plots died as soon as the disease was detected. However, some plants of the A1MG plot were detected wilting, and died a few months
after the disease detection. The plants of A1MG, A2MG, and A3MG plots were 10-, 3-,
and 1-years-old, respectively. Therefore, plant age is expected to be related to the time
smaller in 2-year-old elm trees than in 4-, 5-, 6-, and 7-year-old trees, which was
attributed to the smaller diameter and the diffuse distribution in the xylem vessels of younger plants (Solla et al., 2005). It seems that the response of mango plants is similar to that of eucalyptus.
The temperature remained between 20 and 30 °C in both regions. The maximum
growth of C. manginecans from mango occurred between 20 and 30 °C (Rehman et al.,
2011). Similarly, the greater growth and sporulation of C. paradoxa occurred between
20 and 30 °C (Dede & Okungbowa, 2007; Yadahalli et al., 2007). Thus, the temperature during the evaluation time in both regions is assumed to favor Ceratocystis wilt, and the differences in the disease progress were related to the initial inoculum, mode of infection of the pathogen, and most likely water stress. Most new infections were observed during times of lower rainfall. The intensity of symptoms on elm trees infected with O. novo-ulmi differed with the water regime: when the inoculated plants
were subjected to water stress, severe disease symptoms were observed (Solla & Gil, 2002a). The authors emphasize that the combined effect of drought stress and colonization of O. novo-ulmi aggravates the expression of disease symptoms. Water
stress also increased the intensity of infection of C. paradoxa and Ceratocystis radiciola
in palm trees (Suleman et al., 2001), that seems to have happened in our observations. For epidemics spread by vectors, diseased plants as inoculum sources usually influence the progress rate (Madden et al., 2007). In Itaocara, the largest number of initial diseased plants most likely influenced the progress rate of the epidemics, given that beetles are the major pathogen vectors (Viegas, 1960; Al Adawi et al., 2006; Al Adawi et al., 2013). Thus, the greatest inoculum availability to disease transmission by beetles in A2RJ can be related to the higher rate of incidence. The removal of the diseased mango trees decreased the progress of Ceratocystis wilt (Saeed et al., 2012), but the authors did not discuss the epidemic type and evaluated the mechanism of disease spread.
The lowest severity rate and mortality, observed in Itaocara, were due to the disease occurrence only in some branches initially and to the slow progress of the infection in a diseased plant. However, in Frutal, the disease affected all of the branches initially and quickly caused the death of the infected plants. Therefore, a greater severity rate and a greater level of mortality were observed in the Frutal epidemics.
For epidemics caused by soil-borne plant pathogens, factors associated with the
had no effect on the progress rate but affected the maximum intensity. The largest initial intensity values occurred in A3MG, a plot where Ceratocystis wilt was previously severe and where the root systems of all previously grown plants, either diseased or healthy, were not removed, and the new seedlings were planted in the same rows. Therefore, the initial inoculum was expected to be high in A3MG. The inoculum density affects the temporal dynamics of soil-borne pathogens, and Ceratocystis wilt
was severe in eucalyptus planted in forest sites with a likely soil-borne inoculum prior
to planting, and disease symptoms were not evident before 20 months (Ferreira et al., 2013). Although the survival of C. fimbriata in mango roots is not known, it is expected that the pathogen remained in the A3MG plot between plantings.
This study provides the first quantitative information concerning the temporal dynamics of Ceratocystis wilt epidemics and of the types of syndromes associated with of the disease. We have shown that the dynamics of Ceratocystis wilt in Itaocara and Frutal were different, most likely due the occurrence of aerial infection and root infection, respectively. Such information contributes to the development of management strategies for each type of syndrome. The aerial infection can be managed by removing the diseased branches because the pathogen moves slowly to the trunk. To manage root infections, we recommend the use of resistance rootstock and the removal of the diseased and dead plants to prevent secondary infections. With continued research, an effective, integrated disease management program could be developed to more effectively reduce the losses of both types of syndromes. We also demonstrate that the Bayesian analysis is potentially useful tool for describe and compare epidemics. We believe that the field of plant pathology could benefit with further explorations of the use of Bayesian analysis.
5. REFERENCES
AL ADAWI, A.O.; DEADMAN, M.L.; AL RAWAHI, A.K.; AL MAQBALI, Y.M.; AL JAHWARI, A.A.; AL SAADI, B.A.; AL AMRI, I.S.; WINGFIELD, M.J. Aetiology and causal agents of mango sudden decline disease in the Sultanate of Oman. European Journal of Plant Pathology, v.116, n.4, p.247-254, 2006.
AL SADI, A.M.; AL OUWEISI, F.A.; AL SHARIANI, N.K.; AL ADAWI, A.O.; KAPLAN, E.J.; DEADMAN, M.L. Histological changes in mango seedlings following infection with Ceratocystis manginecans, the cause of mango decline. Journal of Phytopathology, v.158, n.11-12, p.738-743, 2010.
ARAUJO, L.; SILVA BISPO, W.M.; CACIQUE, I.S.; CRUZ, M.F.A.; RODRIGUES, F.A. Histopathological aspects of mango resistance to the infection process of Ceratocystis fimbriata. Plant pathology, p.1-14, 2014.
BAAYEN, R.P.; DE MAAT, A.L. Passive transport of microconidia of Fusarium oxysporum f. sp. dianthi in carnation after root inoculation. Netherlands Journal of Plant Pathology, v.93, n.1, p.3-13, 1987.
BAILEY, D.J.; GILLIGAN, C.A. Dynamics of primary and secondary infection in take-all epidemics. Phytopathology, v.89, n.1, p.84-91, 1999.
BASSANEZI, R.B.; MONTESINO, L.H.; GIMENES-FERNANDES, N.; YAMAMOTO, P.T.; GOTTWALD, T.; AMORIM, L.; BERGAMIN FILHO, A. Efficacy of area-wide inoculum reduction and vector control on temporal progress of huanglongbing in young sweet orange plantings. Plant Disease, v.97, n.6, p.789-796, 2013.
BATISTA, L.; VELÁZQUEZ, K.; ESTÉVEZ, I.; PEÑA, I.; LÓPEZ, D.; REYES, M.L.; RODRÍGUEZ, D.; LARANJEIRA, F.F. Spatiotemporal dynamics of Citrus tristeza virus in Cuba. Plant pathology, v.57, n.3, p.427-437, 2008.
BLASCO, A.; PILES, M.; VARONA, L. A bayesian analysis of the effect of selection for growth rate on growth curves in rabbits. Genetics Selection Evolution, v.35, n.1, p.21-42, 2003.
BYAMUKAMA, E.; ROBERTSON, A.E.; NUTTER, F.W. Quantifying the within-field temporal and spatial dynamics of bean pod mottle virus in soybean. Plant Disease, v.95, n.2, p.126-136, 2011.
CAMPBELL, C.L.; MADDEN, L.V. Introduction to plant disease epidemiology. New York: Wiley, 1990. 532 p.
CLÉRIVET, A.; DÉON, V.; ALAMI, I.; LOPEZ, F.; GEIGER, J.-P.; NICOLE, M. Tyloses and gels associated with cellulose accumulation in vessels are responses of plane tree seedlings (Platanus×acerifolia) to the vascular fungus Ceratocystis fimbriata f. sp platani. Trees, v.15, n.1, p.25-31, 2000.
DE LA CRUZ-MESÍA, R.; MARSHALL, G. Non‐linear random effects models with continuous time autoregressive errors: a Bayesian approach. Statistics in medicine, v.25, n.9, p.1471-1484, 2006.
DE LA CRUZ, R. Bayesian non-linear regression models with skew-elliptical errors: applications to the classification of longitudinal profiles. Computational Statistics & Data Analysis, v.53, n.2, p.436-449, 2008.
DE LA CRUZ, R.; BRANCO, M.D. Bayesian analysis for nonlinear regression model under skewed errors, with application in growth curves. Biometrical Journal, v.51, n.4, p.588-609, 2009.
DEDE, A.P.O.; OKUNGBOWA, F.I. In vitro growth of Ceratocystis paradoxa in oil palm (Elaeis guineensis) fruit extract media. Micología Aplicada International, v.19, n.2, p.51-55, 2007.
FERREIRA, F.A.; MAFFIA, L.A.; FERREIRA, E.A. Detecção rápida de Ceratocystis fimbriata em lenho infetado de eucalipto, mangueira e outros hospedeiros lenhosos. Fitopatologia Brasileira, v.30, p.543-545, 2005.
FERREIRA, M.A.; HARRINGTON, T.C.; GONGORA-CANUL, C.C.; MAFIA, R.G.; ZAUZA, E.A.V.; ALFENAS, A.C. Spatial–temporal patterns of Ceratocystis wilt in Eucalyptus plantations in Brazil. Forest Pathology, v.43, n.2, p.153-164, 2013.
GELMAN, A.; CARLIN, J.B.; STERN, H.S.; RUBIN, D.B. Bayesian data analysis. London: Chapman Hall, 1997. 526 p.
GEWEKE, J. Evaluating the accurary of sampling-based approaches to the calculation of posterior moments. In: BERNARDO, J.M.; BERGER, J.O.; DAWID, A.P.; SMITH, A.F.M. (Eds.). Bayesian Statistics. New York: Oxford University Press, 1992. p.625-631.
GILLIGAN, C.A. Comparison of disease progress curves. New Phytologist, v.115, n.2, p.223-242, 1990.
GONGORA-CANUL, C.; NUTTER, F.W., JR; LEANDRO, L.F.S. Temporal dynamics of root and foliar severity of soybean sudden death syndrome at different inoculum densities. European Journal of Plant Pathology, v.132, n.1, p.71-79, 2012.
GRAYBILL, F.A. Theory and Application of the Linear Model. Belmont: Duxbury Press, 1976. 720 p.
HART, J.H.; LANDIS, W.R. Rate and extent of colonization of naturally and artificially inoculated American elms by Ceratocystis ulmi. Phytopathology, v.61, p.1456-1458, 1971.
HOLLANDER, M.; WOLFE, D. Nonparametric Statistical Methods. New York: Wiley, 1979.
JEGER, M.J.; HOLT, J.; VAN DEN BOSCH, F.; MADDEN, L.V. Epidemiology of insect transmitted plant viruses: modelling disease dynamics and control interventions. Physiological Entomology, v.29, n.3, p.291-304, 2004.
KIRISITS, T.; OFFENTHALER, I. Xylem sap flow of Norway spruce after inoculation with the blue stain fungus Ceratocystis polonica. Plant pathology, v.51, n.3, p.359-364, 2002.
LI, W.K.; MAK, T.K. On the squared residual autocorrelations in nonlinear time series with conditional heteroskedasticity. Journal of Time Series Analysis, v.15, n.6, p.627-636, 1994.
LUNG-ESCARMANT, B.; GUYON, D. Temporal and spatial dynamics of primary and secondary infection by Armillaria ostoyae in a Pinus pinaster plantation. Phytopathology, v.94, n.2, p.125-131, 2004.
MADDEN, L.V.; HUGHES, G. Plant disease incidence: distributions, heterogeneity, and temporal analysis. Annual Review of Phytopathology, v.33, n.1, p.529-564, 1995. MADDEN, L.V.; HUGHES, G.; VAN DEN BOSCH, F. The study of plant disease epidemics. St. Paul, MN: American Phytopathological Society, 2007. 421 p.
MALIK, M.T.; KHAN, S.M.; DASTI, A.A.; KAZMI, M.R. First record of Ceratocystis fimbriata, causal organism of mango sudden death in Pakistan. Pakistan Journal of Phytopathology, v.17, p.187-191, 2005.
MANDEEL, Q.A. Influence of plant root exudates, germ tube orientation and passive conidia transport on biological control of fusarium wilt by strains of nonpathogenic Fusarium oxysporum. Mycopathologia, v.161, n.3, p.173-182, 2006.
MOYÉ, L.A. Elementary Bayesian Biostatistics. London: CRC Press, 2007. 400 p. PARK, J.H.; JUZWIK, J.; CAVENDER-BARES, J. Multiple Ceratocystis smalleyi infections associated with reduced stem water transport in bitternut hickory. Phytopathology, v.103, n.6, p.565-574, 2013.
PATWARDHAN, S.C.; NARASIMHAN, S.; JAGADEESAN, P.; GOPALUNI, B.; L SHAH, S. Nonlinear bayesian state estimation: a review of recent developments. Control Engineering Practice, v.20, n.10, p.933-953, 2012.
PINTO, A.C.Q. Melhoramento genético da manga (Mangifera indica L.) no Brasil. In: ROZANE, D.E.; DAREZZO, R.J.; AGUIAR, R.L.; AGUILERA, G.H.A.; ZAMBOLIM, L. (Eds.). Manga: produção integrada, industrialização e comercialização. Viçosa: Editora UFV, 2004. p.17-78.
PLOETZ, R.C. Diseases of mango. In: PLOETZ, R.C. (Ed.). Diseases of tropical fruit crops. Wallingford: CAB International, 2003. p.327-363.
REHMAN, A.; ABBAS, T.; KHAN, N.A.; MEHBOOB, S. Investigations on mango sudden death syndrome affected plant parts in district Muzaffargarh. Pakistan Journal of Phytopathology, v.23, n.2, p.125-130, 2011.
REKAH, Y.; SHTIENBERG, D.; KATAN, J. Spatial distribution and temporal development of fusarium crown and root rot of tomato and pathogen dissemination in field soil. Phytopathology, v.89, n.9, p.831-839, 1999.
RIBEIRO, I.J.A. Seca da mangueira - agentes causais e estudo da moléstia. In: Simpósio brasileiro sobre a cultura da mangueira, 1980, Jaboticabal. Anais. Jaboticabal: Sociedade Brasileira de Fruticultura, 1980. p.24–28.
RIBEIRO, I.J.A. Doenças da mangueira (Mangifera indica L.). In: KIMATI, H.; AMORIM, A.; BERGAMIN FILHO, A.; CAMARGO, L.E.A.; REZENDE, J.A.M. (Eds.). Manual de Fitopatologia. São Paulo: Agronômica Ceres, v.2, 1997. p.511-524. ROSSETTO, C.J.; RIBEIRO, I.J.A. Seca da mangueira xii. recomendações de controle. Revista de Agricultura, v.65, n.2, p.173-180, 2002.
SAEED, S.; MASOOD, A.; KHAN, S.M. Diseased plants as a source of dissemination of mango sudden death disease in healthy mango plants. Pakistan Journal of Phytopathology, v.24, n.1, p.21-25, 2012.
SHANER, G.; FINNEY, R.E. The effect of nitrogen fertilization on the expression of slow-mildewing resistance in Knox wheat. Phytopathology, v.67, n.8, p.1051-1056, 1977.
SOLLA, A.; GIL, L. Influence of water stress on Dutch elm disease symptoms in Ulmus minor. Canadian journal of botany, v.80, n.8, p.810-817, 2002a.
SOLLA, A.; GIL, L. Xylem vessel diameter as a factor in resistance of Ulmus minor to Ophiostoma novo-ulmi. Forest Pathology, v.32, n.2, p.123-134, 2002b.
SPIEGELHALTER, D.J.; BEST, N.G.; CARLIN, B.P.; VAN DER LINDE, A. Bayesian measures of model complexity and fit. Journal of the Royal Statistical Society: Series B (Statistical Methodology), v.64, n.4, p.583-639, 2002.
SUFFERT, F. Modélisation de cinétiques de la maladie de la tache de la carotte provoquée par un complexe d'agents pathogènes du genre Pythium dominé par le Pythium violae. Canadian Journal of Plant Pathology, v.29, n.1, p.41-55, 2007.
SUJKOWSKI, L.S.; PARRA, G.R.; GUMPERTZ, M.L.; RISTAINO, J.B. Temporal dynamics of Phytophthora blight on bell pepper in relation to the mechanisms of dispersal of primary inoculum of Phytophthora capsici in soil. Phytopathology, v.90, n.2, p.148-156, 2000.
SULEMAN, P.; AL-MUSALLAM, A.; MENEZES, C.A. The effect of solute potential and water stress on black scorch caused by Chalara paradoxa and Chalara radicicola on date palms. Plant disease, v.85, n.1, p.80-83, 2001.
VIEGAS, A.P. Seca da mangueira. Bragantia, v.19, n.11, p.163–182, 1960.
WALD, A.; WOLFOWITZ, J. On a test whether two samples are from the same population. The Annals of Mathematical Statistics, v.11, n.2, p.147-162, 1940.
YADAHALLI, K.B.; ADIVER, S.S.; KULKARNI, S. Effect of pH, temperature and relative humidity on growth and development of Ceratocystis paradoxa–a causal organism of pineapple disease of sugarcane. Karnataka Journal of Agricultural Sciences, v.20, n.1, p.159-161, 2007.
YUAN, Y.; MACKINNON, D.P. Bayesian mediation analysis. Psychological Methods, v.14, n.4, p.301-322, 2009.