LEONARDO SARNO SOARES OLIVEIRA
CERATOCYSTIS WILT ON Mangifera indica, Colocasia esculenta AND Tilia americana.
Tese apresentada à Universidade Federal de Viçosa, como parte das exigências do Programa de Pós-Graduação em Fitopatologia, para obtenção do título de Doctor Scientiae.
VIÇOSA
LEONARDO SARNO SOARES OLIVEIRA
CERATOCYSTIS WILT ON Mangifera indica, Colocasia esculenta AND Tilia americana.
Tese apresentada à Universidade Federal de Viçosa, como parte das exigências do Programa de Pós-Graduação em Fitopatologia, para obtenção do título de Doctor Scientiae.
APROVADA: 16 de abril de 2014
_________________________________ ____________________________________ Prof. Dalmo Lopes Siqueira Dr. Lúcio Mauro da Silva Guimarães (Coorientador)
_________________________________ ____________________________________ Profa. Maria Alves Ferreira Prof. Sérgio Hermínio Brommonschenkel
______________________________ Acelino Couto Alfenas
ii
`` A simplicidade é o último grau de sofisticação ``.
Leonardo da Vinci
Aos meus pais,
Antonio de Oliveira Soares e
Maria do Rosário Sarno de Oliveira (in memorian)
iii
AGRADECIMENTOS
À minha família, Antonio, Helena, Tereza, Zaia (in memorian) e o pequeno João Antonio pelo amor e apoio durante toda a execução deste trabalho.
À Universidade Federal de Viçosa, em especial ao Departamento de Fitopatologia e Programa de Pós-Graduação em Fitopatologia pela oportunidade de realização do curso.
Aos Professores da UFV pelos ensinamentos ao longo de toda minha vida universitária na graduação e na pós-graduação.
Ao Conselho Nacional de Desenvolvimento Científico e Tecnológico (CNPq) pelo financiamento da bolsa. Meus agradecimentos também se estendem a Fapemig (Fundação de Amparo à Pesquisa de Minas Gerais) pelo suporte em parte deste trabalho.
À Vale pelo financiamento da bolsa sanduíche e dos recursos utilizados no projeto.
Ao professor Acelino Couto Alfenas pela orientação e amizade ao longo dos nove anos de convívio.
``I am also very greatful to Dr. Thomas Harrington for his friendship and patience, and for helping me in the interpretation of the molecular data.``
``I wish to thanks Iowa State University for the opportunity to conduct part of my research, and Doug McNew for helping with morphological studies.``
À Prof. Maria Ferreira, ao Dr. Lúcio Guimarães, ao Prof. Sérgio Brommonschenkel e ao Prof. Dalmo Siqueira pelos valiosos comentários na Tese.
À Márcia Brandão pela amizade, auxílio e paciência durante todo o tempo que trabalhei no laboratório de Patologia Florestal.
Ao Dr. Abdulah, Dr. Issa, João Murakami, Tatiane, Maria Lucia, Dr. Marlon, Prof. Glaus, Prof. Luciana, Minari, Ricci, Meire Yamada, Dr. Enilton, Dr. Rafael Alves, Dr. Lucio Flavo, Dr. Enilton, Kavati, Prof. Luis Marangon, Arlindo, Frederico, Jean, George, Herbert, Prof. Silvaldo, Diógenes, e Marcelo Pinheiro, que nos ajudaram na coleta dos isolados.
Aos colegas do Laboratório de Patologia Florestal e do Departamento de Fitopatologia da UFV pelo auxilio nas atividades desenvolvidas neste trabalho e pela amizade.
Aos meu amigos do peito, que sempre me apoiaram e me deram suporte psicológico para enfrentar as dificuldades, que fizeram dos meus dias de Viçosa mais felizes.
À Thaína pelo amor e paciência ao longo do curso de doutorado.
iv BIOGRAFIA
LEONARDO SARNO SOARES OLIVEIRA, filho de Antonio de Oliveira Soares e Maria do Rosário Sarno de Oliveira nasceu em Alpinópolis, Minas Gerais em 13 de maio de 1986.
Ingressou na Universidade Federal de Viçosa no curso de Engenharia Florestal no ano de 2004. Foi bolsista de iniciação científica entre os anos de 2005 a 2008 no Laboratório de Patologia Florestal com a orientação do Professor Acelino Couto Alfenas. Realizou intercâmbio cultural na Austrália por um período de cinco meses no ano de 2008. Graduou-se em 30 de janeiro de 2009, obtendo o título de Engenheiro Florestal.
Logo em seguida, iniciou o mestrado no Programa de Pós-Graduação em Fitopatologia pela Universidade Federal de Viçosa na área de Patologia Florestal sob orientação do Professor Acelino Couto Alfenas, concluindo-o em 22 de julho de 2010.
Em agosto de 2010 iniciou o curso de Doutorado em Fitopatologia na Universidade Federal de Viçosa, com o mesmo orientador, realizando doutorado sanduíche na “Iowa State University”, EUA, por um período de 11 meses, submetendo-se à defesa de tese em 16 de abril de 2014.
v
SUMÁRIO
RESUMO ... vii
ABSTRACT ... viii
GENERAL INTRODUCTION ... 1
LITERATURE CITED ... 3
CHAPTER 1 - Genetic variation and intersterility among isolates of Ceratocystis fimbriata from Mangifera indica in Brazil, Oman, and Pakistan... 5
INTRODUCTION ... 6
MATERIALS AND METHODS ... 8
Collection of Isolates ... 8
Southeastern Brazil populations ... 10
Norheastern Brazil populations ... 10
Eastern Rio de Janeiro (Brazil) populations ... 11
Oman and Pakistan populations ... 12
Phylogeny ... 12
Mating experiments ... 14
Morphology ... 15
Microsatellite markers ... 16
Microsatellite analyses ... 16
RESULTS ... 17
Phylogeny ... 17
Mating experiments ... 20
Morphology ... 23
Genetic variation of haplotypes based on microsatellite alleles ... 25
Genetic relatedness of populations based on microsatellite alleles... 27
DISCUSSION ... 35
LITERATURE CITED ... 39
CHAPTER 2 - Genetic variation and movement of genotypes of Ceratocystis fimbriata in corms of Colocasia esculenta in Brazil ... 44
INTRODUCTION ... 46
vi
Fungal isolates and DNA extraction ... 47
Phylogeny ... 49
Microsatellite markers ... 50
Microsatellite analyses ... 50
RESULTS ... 51
Phylogeny ... 51
Genetic variation of haplotypes based on microsatellite alleles ... 53
Genetic relatedness of populations based on microsatellite alleles... 55
DISCUSSION ... 59
LITERATURE CITED ... 60
CHAPTER 3 - A new wilt disease of Tilia americana caused by Ceratocystis tiliae sp. nov. 63 INTRODUCTION ... 64
MATERIALS AND METHODS ... 65
Collection of isolates ... 65
DNA extraction and gene sequencing ... 65
Phylogenetic analyses ... 66
Pathogenecity tests ... 66
Morphological characterization... 67
RESULTS ... 68
Phylogenetic analyses ... 68
Pathogenecity tests ... 72
Morphological characterization... 73
Taxonomy... 75
DISCUSSION ... 77
vii RESUMO
OLIVEIRA, Leonardo Sarno Soares, D.Sc., Universidade Federal de Viçosa, abril de 2014. Murcha-de-ceratocystis em Mangifera indica, Colocasia esculenta e Tilia americana. Orientador: Acelino Couto Alfenas. Coorientador: Dalmo Lopes Siqueira.
viii ABSTRACT
OLIVEIRA, Leonardo Sarno Soares, D.Sc., Universidade Federal de Viçosa, April, 2014. Ceratocystis wilt on Mangifera indica, Colocasia esculenta and Tilia americana. Advisor: Acelino Couto Alfenas. Co-advisor: Dalmo Lopes Siqueira.
1 GENERAL INTRODUCTION
1 2
3
Members of the Ceratocystis fimbriata complex are wound or soilborne pathogens on root 4
crops or trees and may cause wilting and cankering on some woody hosts (Kile et al, 1996; Johnson 5
et al, 2005). Among the hosts affected by Ceratocystis are Prunus spp (almonds and other stone 6
fruits), Populus spp (aspen and other poplars), Platanus spp (sycamore or plane tree), Theobroma 7
cacao (cacao), Coffea arabica (coffee), Hevea brasiliensis (rubber tree), Eucalyptus spp 8
(eucalyptus), Mangifera indica (mango), Tectona grandis (teak), Acacia spp (acacia), Gmelina 9
robusta (gmelina), Ficus carica (edible fig), Citrus spp (citrus) and other woody plants (Borja et 10
al, 1995; Engelbrecht & Harrington, 2005; Ferreira et al, 1999; Firmino et al, 2012; Johnson et al, 11
2005; Marin et al, 2003; Ribeiro, 1982; Ribeiro et al, 1988; Silveira et al, 1994; Valarini & Tokeshi, 12
1980; Viégas, 1960;). Also, the pathogen can causes the rot of storage roots or corms of Colocasia 13
esculenta (taro or inhame) (Harrington et al, 2005) and Ipomoea patatas (sweet potato) (Halsted, 14
1890). 15
Infection of Ceratocystis sp. may occur through the crown and, or the roots. The root 16
penetration is independent on wounds and the plant dies quickly. When occurs through the crown, 17
the disease begins in lateral branches and progress slowly towards the trunk, reach the trunk and 18
cause the death of the plant. In the absence of living plants, the fungus can survive and multiply in 19
the soil and in the dead branches. The dispersion of the pathogen can occur mainly through infested 20
cuttings, agricultural implements and infected tools or through the soil from infected orchard. The 21
fungus can also be disseminated by coleoborer insects of the subfamily Scolytinae (Curculionidae) 22
as demonstrated in Populus (Hinds, 1972), Prunus (Moller et al., 1969) and in M. indica (Viégas, 23
1960; Ribeiro, 1980; Yamashiro and Myazaki, 1985). 24
The symptoms of Ceratocystis wilt in mango trees resemble those observed in a branch 25
burned by fire. Initially, the apical leaves wilt and become yellowish, following of the complete 26
dry up of the affected branch, but usually the leaves stay in the plant without the occurrence of 27
defoliation. There is sap exudation in some points (gummosis) and, with the evolution of the 28
disease, occurs the death of the infected branch and the adjacent ones, which become progressively 29
2
Currently, Ceratocystis fimbriata sensu lato is recognized as a complex of many fungal 1
species. Four phylogenetic clades are present in the complex and they consist of Latin American 2
clade, North American clade, Asian clade and the African species C. albifundus M. J. Wingf., De 3
Beer, & M. J. Morris and its relatives (Harrington, 2000; Heath et al., 2009; Johnson et al., 2005; 4
Roux et al., 2001; Thorpe et al., 2005). Problems on distinguishing new species based on ITS 5
rDNA sequences were found in isolates of C. fimbriata, and the study of Harrington et al (2014) 6
showed that more than one sequence could be obtained from directly sequencing of PCR 7
fragments. Thereafter, other genes like mating type genes must be applied for distinguishing new 8
Ceratocystis species because they give a more robust and reliable information. There are likely 9
other cryptic species within C. fimbriata species complex, but these species should be delimited 10
by more than ITS sequences alone (Harrington et al, 2014). Recently, the studies of Ferreira et al 11
(2010) proposed that Brazilian isolates be recognized as a single species, C. fimbriata, in part due 12
to the interfertility of Brazilian isolates with isolates from sweet potato, the host from which C. 13
fimbriata was originally described. 14
The present Thesis consists of three chapters. The first chapter aimed to explore the 15
boundaries between species and populations of Ceratocystis fimbriata isolates obtained from 16
mango, studing populations from Brazil, Oman and Pakistan. The second chapter aimed to study 17
the genetic variation of populations of C. fimbriata obtained from Colocasia esculenta in order to 18
establish putatively native and introduced populations of the fungus in Brazil and also evaluate the 19
movement of haplotypes in corms of taro. The third chapter aimed to further determine if C. 20
fimbriata strains from basswood are phylogenetically and pathologically distinct from other 21
members of the North American clade. 22
We expect that the information obtained from this study can significantly contribute to the 23
clarification of the taxonomy of Ceratocystis isolates obtained from mango, taro and basswood. 24
Also, with information generated with microsatelite data, we expect to identify natural and 25
introduced populations of the fungus. 26
3 1
Batista, D.C., Terao, D., Barbosa, M.A.G., and Barbosa, F.R. 2008. Seca-da-mangueira detecção, 2
sintomatologia e controle. Comunicado Técnico 138, Petrolina, PE, Embrapa Available at 3
HTTP://www.cpatsa.embrapa.br. 4
Borja, D.C., Caycedo, J.E.L., Ríos, J.A.L. 1995. El secamiento de los citricos em la zona cafetera 5
central. Cenicafé Avances Tecnicos, Colombia, n. 212, p. 1-8. 6
Engelbrecht, C.J.B., and Harrington, T.C. 2005. Intersterility, morphology, and taxonomy of 7
Ceratocystis fimbriata on sweet potato, cacao, and sycamore. Mycologia 97:57–69. 8
Ferreira, F.A., Demuner, A.M., Demuner, M.L, Pigato, S. 1999. Murcha de Ceratocystis em 9
eucalipto no Brasil. Fitopatologia Brasileira, Brasília, v. 24, p. 284. 10
Ferreira, E.M., Harrington, T.C., Thorpe, D.J., and Alfenas, A.C. 2010. Genetic diversity and 11
interfertility among highly differentiated populations of Ceratocystis fimbriata in Brazil. 12
Plant Pathol 59:721–735. 13
Firmino, A. C., Tozze Júnior, H. J., Furtado, E. L. 2012. First report of Ceratocystis fimbriata 14
causing wilt in Tectona grandis in Brazil. New Disease Reports, Reading, v. 25, p. 24. 15
Halsted, B.D. 1890. Some fungous diseases of sweet potato. The black rot. N.J. Ag. Exp. Sta. 16
Bull. 76:7–14. 17
Harrington, T.C. 2000. Host specialization and speciation in the American wilt pathogen 18
Ceratocystis fimbriata. Fitopatol Brasil 25:262–263. 19
Harrington, T.C., Thorpe, D.J., Marinho, V.L.A. & Furtado, E.L. 2005. First report of black rot of 20
Colocasia esculenta caused by Ceratocystis fimbriata in Brazil. Fitopatologia Brasileira 21
30:88-89. 22
Harrington, T. C., Kazmi, M. R., Al-Sadi, A. M., and Ismail, S. I. 2014. Intraspecific and 23
intragenomic variability of ITS rDNA sequences reveals taxonomic problems in Ceratocystis 24
fimbriata sensu stricto. Mycologia. In press. doi:10.3852/13-189 25
Heath, R.N., Wingfield, M.J., Wingfield, B.D., Meke, G., Mbaga, A., and Roux, J. 2009. 26
Ceratocystis species on Acacia mearnsii and Eucalyptus spp. in eastern and southern Africa 27
including six new species. Fungal Divers. 34:41-67. 28
Hinds, T.E. 1972. Ceratocystis canker of aspen. Phytopathology, 62:213-220 29
Johnson, J.A., Harrington, T.C., Engelbrecht, C.J.B. 2005. Phylogeny and taxonomy of the North 30
American clade of the Ceratocystis fimbriata complex. Mycologia 97:1067–1092. 31
4
Kile, G.A, Harrington, T.C., Yuan, Z.Q., Dudzinski, M.J., Old, K.M. 1996. Ceratocystis eucalypti 1
sp. nov., a vascular stain fungus from eucalypts in Australia. Mycol Res. 100:571–579. 2
Marin, M., Castro, B., Gaitan, A., Preisig, O., Wingfield, B. D., Wingfield, M. J. 2003. 3
Relationships of Ceratocystis fimbriata isolates from Colombian Coffee-Growing regions 4
based on molecular data an pathogenicity. Journal of Phytopathology, Berlin, v. 151, n. 7-8, 5
p. 395-405. 6
Moller, W.J., DeVay, J.E., Backman, P.A. 1969. Effect of some ecological factors on Ceratocystis 7
canker in stone fruits. Phytopathology, 59:938-942. 8
Ribeiro, I.J.A. 1980. Seca de mangueira. Agentes causais e estudo da moléstia. In: Anais do I 9
Simpósio Brasileiro Sobre a Cultura de Mangueira. Sociedade Brasileira de Fruticultura, 10
Jaboticabal, 24-28, 123-130. 11
Ribeiro, G.T. 1982. Avaliação preliminar da resistência de árvores de Gmelina arborea Lineaus, 12
mediante inoculações do fungo Ceratocystis fimbriata Ell.& Halst., causador do cancro em 13
gmelina. Fitopatologia Brasileira, Brasília, v. 7, p. 517. 14
Ribeiro, I.J.A., Fumikoito, M., Paradela Filho, O., Castro, J.L. 1988. Gomose da acácia-negra 15
causada por Ceratocystis fimbriata Ell.; Halst.. Bragantia, Campinas, v. 47, n. 1, p. 71-74. 16
Roux, J., Harrington, T.C., Steimel, J.P., and Wingfield, M.J. 2001. Genetic variation in the wattle 17
wilt pathogen Ceratocystis albofundus. Mycoscience. 42:327-332. 18
Silveira, A.P., Oliveira, D.A., Cardoso, R.M.G., Neto, F.B., Ortolani, A.A., Godoy, G. 1994. 19
Caracterização do prejuízo provocado pelo mofo cinzento (Ceratocystis fimbriata) em 20
painéis de seringueira (Hevea brasiliensis). Summa Phytopathologica, Botucatu, SP. v. 20 n. 21
3-4, p. 196- 199. 22
Thorpe, D.J., Harrington, T.C., and Uchida, J.Y. 2005. Pathogenicity, internal transcribed spacer 23
rDNA variation, and human dispersal of Ceratocystis fimbriata on the family Araceae. 24
Phytopathology 95:316–23. 25
Valarini, P.J., Tokeshi, H. 1980. Ceratocystis fimbriata: agente causal da seca da figueira e seu 26
controle. Summa Phytopathologica, Botucatu, v. 6, n. 3-4, p. 102-106. 27
Viégas, A. P. 1960. Seca da mangueira. Bragantia 19:163-182. 28
Yamashiro, T. and Myazaki, I. 1985. Principal pests and diseases of mango – Mangifera indica L. 29
5
CHAPTER 1
1
2 3 4 5
Genetic variation and intersterility among isolates of Ceratocystis fimbriata
6
from Mangifera indica in Brazil, Oman and Pakistan.
7
6
Genetic variation and intersterility among isolates of Ceratocystis fimbriata from Mangifera 1
indica in Brazil, Oman and Pakistan. 2
3
INTRODUCTION 4
5
The mango tree (Mangifera indica L.), a species from the Anacardiaceae family, is 6
originated in South Asia, more specifically from India and from the Malay Archipelago (Cunha et 7
al., 2002), from where it was taken to other continents, being cultivated in all countries with 8
tropical and subtropical climates. Currently, the mango tree is amongst the most exported tropical 9
fruit trees in the world, being India, China, Thailand, Indonesia, Pakistan, Mexico, and Brazil the 10
main world producers, respectively (FAO, 2011). In Brazil, the main mango producers are the 11
states of Bahia, São Paulo, Pernambuco, and Minas Gerais (IBGE, 2013). Many diseases may 12
affect the mango production and the wilt caused by Ceratocystis fimbriata is being pointed as a 13
limiting factor for mango cultivation in areas where the disease occurs. 14
The first report of C. fimbriata s.l. in mango trees occurred in Brazil in the 1930 decade 15
by Carvalho (1938), in the state of Pernambuco being this disease denominated “Mal do Recife” 16
and the causal agent later identified as C. fimbriata by Viégas (1960). Later on, it was found and 17
confirmed in the states of São Paulo (Viégas, 1960), Bahia (Batista, 2008), Rio de Janeiro (Baker 18
et al, 2003; Silveira et al, 2006; Ferreira et al, 2010). The disease is known as ``seca da 19
mangueira``, Ceratocystis wilt or mango tree wilt. Recently, the disease was observed for the 20
first time outside Brazil, occurring in Pakistan (Fateh et al, 2006) and in the Sultanate of Oman 21
(Al-Adawi et al., 2006), causing serious damages to this culture and becoming an international 22
problem for the mango cultivation. However, based solely on variation of ITS sequences the 23
strains were described as a new species Ceratocytis manginecans M van Wyk, A. Adawi & MJ 24
Wingf. (Van Wyk et al., 2007), although showing similarity with the strains from the Latin 25
American clade (Ferreira et al, 2010; Harrington et al, 2014). Also, two new species infecting 26
mango trees in São Paulo, Brazil, were recently described as Ceratocystis mangicola M van Wyk 27
7
but they are apparently ITS genotypes that have been moved in nursery stock to commercial 1
plantations and small farms in the state of São Paulo. 2
Ceratocystis fimbriata Ellis & Halsted is well known for having a broad host range and 3
are able to infect numerous plant families in over 41 countries spanning in six inhabited 4
continents (CAB International, 2005). The symptoms of the Ceratocystis wilt in mango trees 5
resemble those observed in a branch burned by fire. Initially, the apical leaves wilt and become 6
yellowish, following of the complete dry up of the affected branch, but usually whose leaves stay 7
in the plant without the occurrence of defoliation. There is sap exudation in some points 8
(gummosis) and, with the evolution of the disease, occurs the death of the infected branch and 9
the adjacent ones, which become progressively infected. The infected wood becomes dark, 10
contrasting with the healthy tissue (Batista et al., 2008). 11
Currently, C. fimbriata sensu lato is recognized as a complex of many cryptic species 12
(Harrington, 2000; Engelbrecht & Harrington, 2005; Johnson et al, 2005), and many have been 13
described over the last few years including C. platani Engelbr. & TC Harr. (Engelbrecht & 14
Harrington, 2005), C. cacaofunesta Engelbr. & T.C. Harr. (Elgenbrecht & Harrington, 2005) and 15
C. colombiana M. van Wyk & M. J. Wingfield (Van Wyk et al., 2010). There are four 16
phylogenetic clades within the complex: Latin America clade, the North America clade, the 17
Asian clade and the African clade (Harrington, 2000; Heath et al., 2009; Johnson et al., 2005; 18
Roux et al., 2001; Thorpe et al., 2005). All strains from the complex obtained from Brazil, fall 19
within the Latin America clade and Ferreira et al. (2010) proposed that Brazilian isolates are a 20
single biological species. 21
In the last years, many strains from the Latin America clade have been described as new 22
species based solely on ITS sequences, though there is very limited morphological variation, 23
physiological (host) specialization, isozyme variation, or DNA sequence variation (Engelbrecht 24
and Harrington, 2005; Johnson et al., 2005; Harrington et al., 2011; Thorpe et al., 2005; Van 25
Wyk et al., 2007, 2009, 2010, 2011a, 2011b, 2012). However, problems with the taxonomy of C. 26
fimbriata s.l. using ITS sequences for delimiting species were identified by Harrington et al. 27
(2014) and even being likely the occurrence of new species from the complex, other features 28
must be applied than ITS sequence alone. 29
Populations of C. fimbriata from mango in Brazil were previously studied (Ferreira et al., 30
8
to each other and also related to the populations of the fungus from eucalyptus. Besides, the 1
populations obtained from mango in the small towns of São Fidélis, located on the eastern part of the 2
state of Rio de Janeiro, were the most distinct population and those isolates were able to infect 3
cultivated annona (sugar-apple, Annona squamosa) and the host range of this population appears to 4
be different to the other populations from mango (Baker et al., 2003; Silveira et al., 2006). 5
Based on previous works, the first objective of this work was to study the phylogeny of C. 6
fimbriata isolates from mango obtained from Brazil and Oman, using the phylogenetic species 7
concept supported by Harrington and Rizzo (1999), which consider a solid species only the lineages 8
with unique combination of phenotypic characters. The second objective was to demonstrate the 9
relatedness of C. fimbriata isolates obtained from mango in many regions in Brazil, in order to 10
establish the source of introduced populations and also identification of possible native populations. 11
Besides, isolates from Oman and Pakistan were studied in order to show the relatedness to the 12
other Brazilian isolates. 13
14
MATERIALS AND METHODS 15
16
Collection of Isolates 17
From information provided by mango experts in Brazil and also information from local 18
newspapers, we were able to identify regions with the possibility to find the disease. Isolates were 19
collected from diseased mango in plantations, small farms or single trees in small cities across Brazil 20
(Fig 1), Oman and Pakistan. Trees showing symptoms of wilting, tissue discoloration alongside the 21
stem and sap exudation (gummosis) were chopped generally on the base of the tree and under the bark 22
in order to find the colonized wood. Thereafter, the fungus was baited from diseased wood tissue by 23
placing the pieces of discoloured tissue between two discs of carrot root. Ascospores masses from 24
perithecia formed on the carrot discs were transferred to agar media for purification and then storage. 25
Only one isolate per tree was stored and used in genetic analysis. Pure cultures were stored at 26
Universidade Federal de Vicosa on glycerol 15% at -80 °C. A total of 214 isolates were obtained along 27
9 1
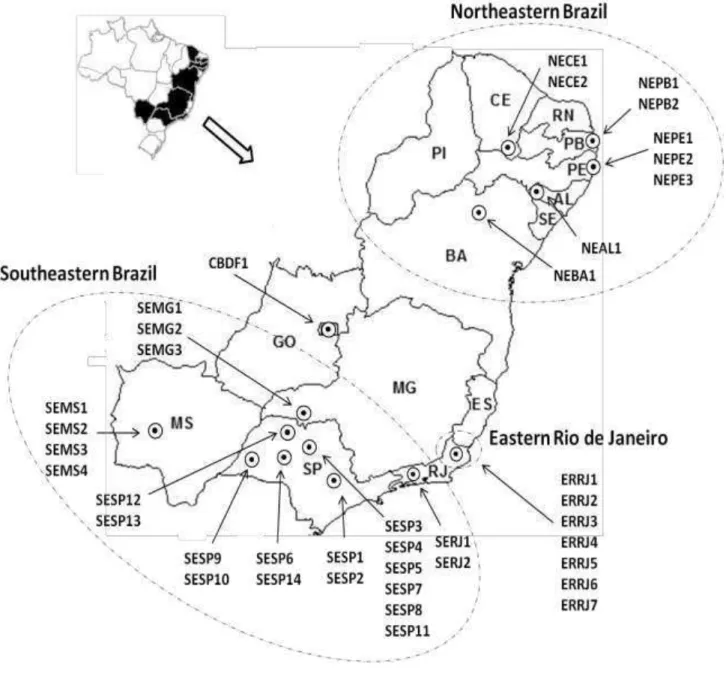
Fig 1. Map of Brazil showing geographic distribution of the 40 sites where Ceratocystis fimbriata 2
was collected from mango trees. The first two letters of each population name indicate the 3
geographic region that isolates come from (SE - Southeastern Brazil; NE - Northeastern 4
Brazil; ER - Eastern Rio de Janeiro; CB - Central Brazil). The last two letters indicate the 5
state of origin(SP -São Paulo; RJ - Rio de Janeiro; MS - Mato Grosso do Sul; MG - Minas 6
Gerais; DF - Distrito Federal; BA - Bahia; PE - Pernambuco; PB - Paraíba; AL - Alagoas; 7
10 Southeastern Brazil populations
1
Fungal isolates were obtained from dead or wilting mango trees in the states of São Paulo (SP), 2
Minas Gerais (MG), Rio de Janeiro (RJ) and Mato Grosso do Sul (MS). In SP, the isolates were 3
obtained from comercial plantations in the cities of Monte Alto, Vista Alegre do Alto, Candido 4
Rodrigues and Taquaritinga. Also, isolates were obtained from backyards or single trees along the 5
streets showing disease symptoms in Santo Anastacio, Ribeirao dos Indios, Guaimbe, Lins, Valentim 6
Gentil and Votuporanga. In Limeira, where much of the nursery industry is located, it was possible to 7
identify an abandoned nursery, where mango plants that would be used as rootstocks showed 8
symptoms of wilting and typical tissue discoloration. From a single row of trees we could obtain 11 9
isolates. In MG, the isolates were obtained from a large plantation with 40,000 trees located in Frutal. 10
In RJ, isolates were collected in the city of Seropedica, nearby the Universidade Federal Rural do Rio 11
de Janeiro, and also in the city of Paraíba do Sul. In MS, we collected isolates from single trees located 12
along the streets of Aquidauana and also in small plantations of a indigenous community located in 13
Limao Verde, nearby Aquidauana. In addition, isolates were also collected in backyards in Campo 14
Grande and Terenos. 15
16
Norheastern Brazil populations 17
The isolates were obtained from dead or wilting mango trees in the states of Bahia (BA), 18
Alagoas (AL), Pernambuco (PE), Paraíba (PB) and Ceará (CE). In BA, we collected all isolates 19
from the small town of Senhor do Bonfim, located about 100 km from the main mango producing 20
area of Brazil. This area has a unique vegetation which is very dry, and is called Caatinga. In AL, 21
all the isolates were obtained from scattered trees along the streets or in backyards of the small 22
town of Agua Branca. This town is also located in a Caatinga region. In PE, we collected the 23
isolates from a small farm with mango trees showing wilting symptoms in Cabo de Santo 24
Agostinho, located in a Atlantic rainforest region. Also, we collected isolates from scattered tree 25
on the city of Recife and Olinda, where the disease was first reported on mango in Brazil. In PB, 26
the isolates were collected from wilting mango trees in the city of Joao Pessoa and suburban 27
neighbor of Conde. They are both located in a Atlantic rainforest region. In CE, the isolates were 28
collected from scattered mango trees along the streets or in backyards of the small town of Brejo 29
11 Eastern Rio de Janeiro (Brazil) populations 1
Previously studies indicated that isolates obtained from mango in the eastern part of the 2
state of Rio de Janeiro were different from the other mango isolates from Brazil (Baker et al., 2003; 3
Silveira et al., 2006; Ferreira et al., 2010). Based on that information, we collected isolates from 4
wilting mango trees along the roads and streets of the small towns of São Fidélis, Itaocara, 5
Itaperuna, Santo Antonio de Padua, São Francisco do Itabapoana e Campos dos Goytacazes. 6
Besides, we identified a mango plantation in Itaocara with wilting trees and then we could sample 7
one population from that area. Eastern Rio de Janeiro is located near the Atlantic Ocean in a 8
Atlantic rainforest region. 9
10
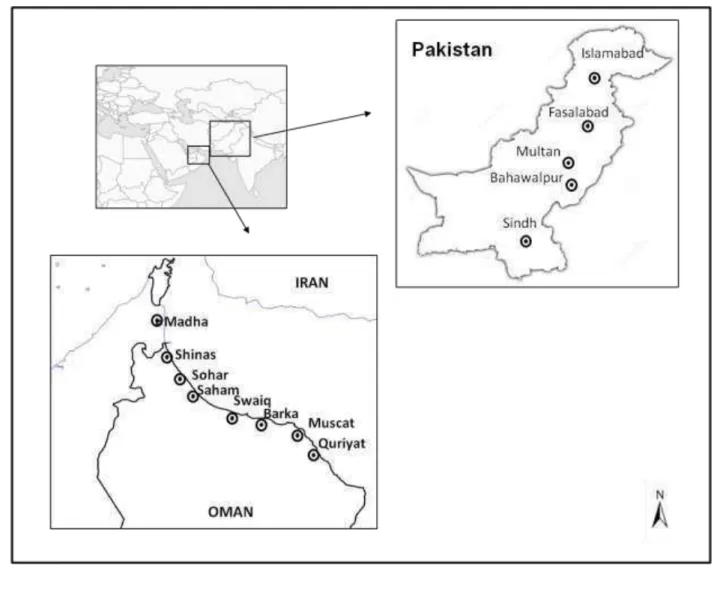
Fig 2. Map of Oman and Pakistan showing geographic distribution of sites where Ceratocystis 11
12 Oman and Pakistan populations
1
In Oman, all the isolates were collected in the Al-Batinah region (Fig 2). The isolates were 2
obtained from dead or wilting mango trees in small farms from northeastern Oman (coastal plains 3
area) in the cities of Barka, Almosna`h, Quriyat, Al-Seeb, Swaiq, Sohar, Shinas, Saham and 4
Madha. The disease was found moving toward north from the Barka region. In Pakistan, the 5
isolates were collected in an earlier study (Harrington et al. 2014) from mango trees showing 6
wilting symptoms in small farms in Multan, Bahawalpur, Islamabad, Fasalabad and Sindh (Fig 2). 7
The northernmost region (Islamabad) is about 2,000 km far from the southernmost region (Sindh). 8
9
Phylogeny 10
A single ascospore strain were derived from the original field isolate by dispersing an 11
ascospore mass in a light oil and spreading the spore suspension over the plate; individual 12
germlings were subcultured to fresh plates for growth and DNA extraction (Harrington and 13
McNew, 1997). A data set with 48 taxon were used in phylogenetic studies, being 28 of the mango 14
collection of the present work. 15
Sequences were generated using PCR folowed by direct DNA sequencing of the PCR 16
products with primers primers ITS1F (5′-CTTGGTCATTTAGAGGAAGTAA-3′) and ITS4 (5′ -17
TCCTCCGCTTATTGATATGC-3) and the following cycling conditions (85 °C for 2 min, 95 °C 18
for 95 sec, and then 36 cycles of 58 °C for 1 min, 72 °C for 80 sec and 95 °C for 70 sec, followed 19
by a 52 °C for 1 min and 72 °C for 15 min (Harrington et al., 2011). The fragments were purified 20
using Ilustra™ GFXTM PCR DNA and Gel Band Purification Kit (GE Healthcare Life Sciences, 21
Buckinghamshire, UK) and sequenced at the Iowa State University DNA Synthesis and Sequence 22
Facility. One of the isolates had ITS PCR product that could not be clearly determined using direct 23
sequencing, so the PCR products were cloned into the pGEM-T Easy vector (Promega 24
Corporation, Madison, Wisconsin). Plasmids were extracted using Ilustra™ plasmidPrep Mini
25
Spin Kit (GE Healthcare Life Sciences, Buckinghamshire, UK), and the cloned fragments were 26
sequenced using primers T7-2 and SP6. 27
All members of the C. fimbriata complex are homothalic through uni-directional mating 28
type switching (Harrington and McNew, 1997; Witthuhn et al, 2000). Homothallic strains have 29
13
and MAT1-1-2. For most isolates, portions of the MAT1-2-1 and MAT1-1-2 regions were amplified 1
and sequence in order to compare to earlier-characterized strains of C. fimbriata (Harrington et al., 2
2014). The primers CFMAT1-F (5' –CAGCCTCGATTGAKGGTATGA-3') and CFMAT1-R (5' 3
–GGCATTTTTACGCTGGTTAG-3') were used to amplify and sequence about 1000 bp region of 4
MAT1-1-2 (Harrington et al., 2013). The primers X9978a (5'
-5
GCTAACCTTCACGCCAATTTTGCC- 3') and CFM2-1F (5' –
6
AGTTACAAGTGTTCCCAAAAG- 3') amplify and sequence about 1150 bp region. The 7
thermocycler settings for amplifying the MAT1 and MAT2 regions included: initial denaturation 8
at 94 °C for 2 min, with 36 cycles of 94 °C for 1 min, 58 °C for 1 min, 72 °C for 2 min, and a final 9
extension of at 72 °C for 10 min. The amplified products were sequenced with the PCR primers. 10
Besides, gene sequences of β-tubulin and TEF-1α were also obtained using PCR folowed 11
by direct DNA sequencing of the PCR products . For β-tubulin, the primers BT1-α (5' -12
TTCCCCCGTCTCCACTTCTTCATG - 3') and BT1-β (5'
-13
GACGAGATCGTTCATGTTGAACTC - 3') were used to amplify and sequence about 600 bp and 14
thermocycler settings for amplifying the β-tubulin region included: initial denaturation at 94 °C 15
for 4 min, with 30 cycles of 94 °C for 50 sec, 55 °C for 50 sec, 72 °C for 50 sec, and a final 16
extension of at 72 °C for 10 min. For TEF-1α, the primers EFCF1.5 (5' - 17
GCYGAGCTCGGTAAGGGYTC- 3'), EFCF2 (5' -TGCTCAACGGGTCTGGCCAT - 3'), 18
EFCF3 (5' - ATGGCCAGACCCGTGAGCA - 3') and EFCF6 (5'
-19
CATGTCACGGACGGCGAAAC - 3') amplify and sequence about 1600 bp region and 20
thermocycler settings for amplifying the TEF-1α region included: initial denaturation at 85 °C for 21
2 min folowed by 94 °C for 1 min and 35 sec, with 36 cycles of 60 °C for 1 min, 72 °C for 1 min 22
and 30 sec, and 94 °C for 35 sec, folowed by final extension of 60 °C for 1 min and 72 °C for 15 23
min. 24
Sequence datasets for the four genomic loci (MAT1, MAT2, TEF-1α and β-tubulin) were 25
aligned in MAFFT Online version v. 7.0 (Katoh & Toh 2010), using the FFT-NS-i (Slow; iterative 26
refinement method) alignment strategy with the 200PAM/ K=2 scoring matrix and a gap opening 27
penalty of 1.53 with an offset value of 0.0. Aligned sequences were then manually corrected when 28
necessary using MEGA v. 5 (Tamura et al. 2011). The likelihood values were calculated and the 29
best model of nucleotide substitution for each gene (TEF-1α, MAT1, MAT2 and β-tubulin) was 30
14
2004). The multi-gene Bayesian Inference (BI) was conducted for the aligned β-tubulin, MAT1, 1
MAT2 and TEF-1α data set with 48 taxa including outgroup (Ceratocystis variospora from 2
Prunus) on MrBayes v. 3.1.1 (Ronquist & Heulsenbeck, 2003) using the algorithm of Markov 3
chain Monte Carlo (MCMC) with two sets of four chains (one cold and three heated) and the 4
stoprule option, stopping the analysis at an average standard deviation of split frequencies of 0.01. 5
The sample frequency was set to 1000; the first 25 percent of trees were removed. 6
7
Mating experiments 8
Representative testers isolates of Ceratocystis fimbriata from mango, eucalyptus, fig, 9
inhame, gmelina and sweet potato and representative testers of an isolate of C. cacaofunesta and 10
C. platani (Engelbrecht & Harrington, 2005) were used in mating experiments (Table 1). 11
Ceratocystis fimbriata is both a heterothallic and a homothallic fungus, with two mating types;
12
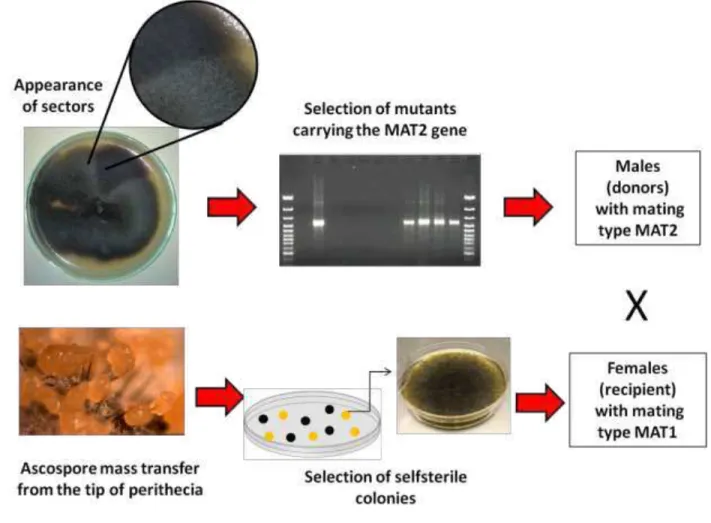
MAT-1 strains are self-sterile, but MAT-2 strains are self-fertile. The MAT-2 strains have both 13
MAT-1 and MAT-2 genes, but during unidirectional mating-type switching, the MAT-2 gene is 14
deleted, and progeny that have inherited nuclei with the deletion behave as MAT-1 and are self-15
sterile (Harrington and McNew, 1997; Witthuhn et al, 2000). Thus 2 (self-fertile) and MAT-16
1 (self-sterile) progeny are recovered from selfings of MAT-2 strains. Based on this, the mating 17
experiments were conducted as described by Ferreira et al (2010) (Fig 3). 18
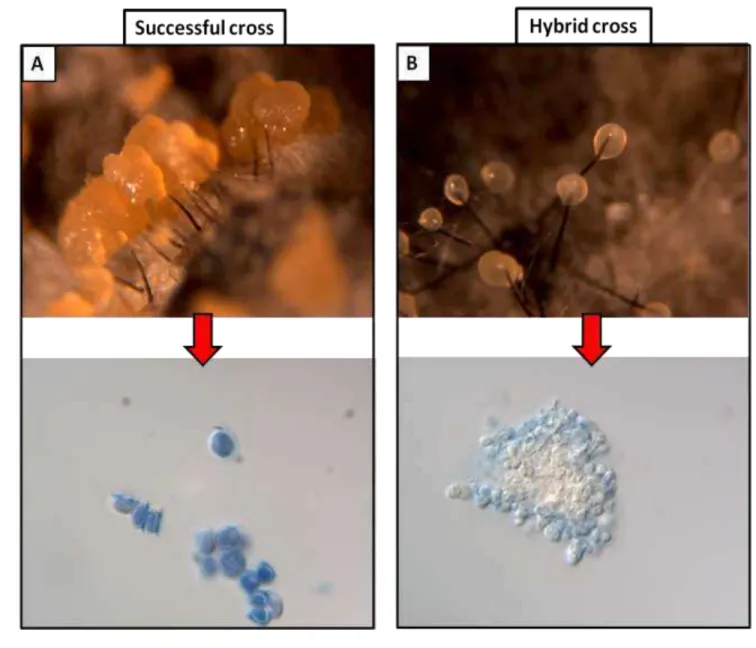
After recovering the female testers with the male tester, the cultures were observed for 3-19
4 weeks for the presence of perithecia and ascospore masses. Ascospore masses were examined 20
microscopically (x400) to see if there were abundant, normal-appearing ascospores, indicating a 21
good cross, or if there were few or no ascospores, or if the ascospores were misshapen, which is 22
typical of an interspecific cross or hybrid (Harrington & McNew, 1998; Harrington et al., 2002, 23
Johnson et al, 2005; Ferreira et al, 2010) (Fig 5). Also, ascospore masses from one or more 24
perithecia of a cross were streaked onto fresh MYEA to observe whether the ascospores were 25
viable and if the progeny had a uniform mycelial morphology, indicating an induced selfing had 26
occurred, or if progeny showed the mycelial phenotypes of the two parents, indicating a successful 27
15 1
Fig 3. Scheme of mating studies showing the selection of male and female testers. 2
3
Morphology 4
Based on previous results, representative isolates were selected for morphology studies. 5
They were grown on MYEA (2% malt extract, 0.2% yeast extract, and 2% agar) for about 10 days 6
at room temperature (approximately 23 C). Measurements of endoconidia and endoconidiophores 7
were made after 4–7 d growth, while perithecia and ascospores were measured after 7– 10 d. 8
Aleurioconidia were measured from cultures that had grown 7–20 d. Material to be measured was 9
mounted in lactophenol cotton blue and observed with Nomarsky interference microscopy. 10
Perithecia were measured with an eyepiece reticule at 400X magnifications. For most structures 11
10 observations were recorded per isolate; when measuring endoconidia, however, 20 conidia were 12
measured per isolate. Some structures were rare or hard to locate in a few isolates, and fewer 13
16 Microsatellite markers
1
We analyzed 14 microsatellite loci (CfAAG8, CfAAG9, CfCAA9, CfCAA10, CfCAA15, 2
CfCAA38, CfCAA80, CfCAT1, CfCAT1200, CfCAG5, CfCAG15, CfCAG900, CfGACA60 and 3
CfGACA650) developed from the total genomic DNA of an isolate of C. cacaofunesta (Steimel 4
et al, 2004) and used in population studies on C. cacaofunesta (Engelbrecht et al., 2007), C. platani 5
(Engelbrecht et al., 2004; Ocasio-Morales et al., 2007) and C. fimbriata (Ferreira et al., 2010; 6
Ferreira et al., 2011). Of the 16 loci used in earlier studies, two (CfCAT3K and CfCAT9X) were 7
not utilized because their alleles could not be consistently resolved with some isolates. For each 8
primer pair specific to the flanking regions of 14 simple sequence repeat regions, one of the primers 9
was fluorescently labeled. PCR amplifications of all microsatellite loci were performed using a 10
96-well thermal cycler (PTC-100) MJ research Inc., Watertown, MA) following the earlier 11
described conditions (Ferreira et al., 2010) . The PCR products were electrophoresed using a four-12
capillary ABI Prism 3100-Avant Genetic Analyzer (Applied Biosystems Inc., Foster City, CA). 13
Band Sizes of the product were determined using marker standards and Peak Scanner 1.0 software 14
(Applied Biosystems Inc.). Each product length (within 1 bp) was considered to be a different 15
allele. The microsatellite regions are trinucleotide repeats, and most alleles of a given locus 16
differed by increments of 3 bp. 17
18
Microsatellite analyses 19
Each population consisted of at least four isolates from one location (one small city, one 20
plantation or a group of small farms in one small city). Nei’s gene diversity of microstatellite loci 21
for each population was calculated with and without clone-corrected data using PopGen 1.32 22
software (Yeh and Boyle, 1997). Clone-corrected datasets were a subset of the population left after 23
removing isolates that were genetically identical, that is, a genotype within a population was 24
counted only once. The clone-corrected value for H would be expected to be higher than the 25
uncorrected value if the population was dominated by one or few genotypes, as might occur if a 26
few genotypes were spread within a plantation on tools or equipment or the pathogen was 27
introduced in infected nursery stock. 28
Besides the simple calculation of genotypic diversity (D, number of genotypes found in the 29
17
estimated with the Stoddart and Taylor's G index (Stoddart and Taylor, 1988). The maximum value 1
of G is limited by the number of isolates sampled; therefore, Stoddart and Taylor`s was scaled by 2
the expected number of genotypes for the smallest sample size being compared (Grünwald et al., 3
2003). For individual plantations, the expected number of genotypes in a sample of four isolates 4
(minimum value = 1.0 and maximum value = 4.0) was estimated based on rarefaction curves using 5
the R package (version 2.9.1; R Development Core Team, Vienna). Partition of total variance 6
using analysis of molecular variance (AMOVA) on Euclidean distances was performed using 7
ARLEQUIN 2.0 (Excoffier et al., 2005). 8
To test for random mating within populations, linkage disequilibrium was analyzed using 9
the index of association (IA) statistic in Multilocus. The populations were clone-corrected before 10
analysis. We used randomization procedures (1000 replications, without replacement) to test the 11
significance of the departure of the observed IA value from zero (randomly mating population). 12
Nei’s genetic distance between populations and UPGMA (unweighted pair group method
13
with arithmetic mean) dendrograms were constructed using PopGen 1.32. Bootstrap values for 14
branches of the population trees were calculated from 100 replicates using SEQBOOT, GENDIST, 15
NEIGHBOR and CONSENSE in PHYLIP version 3.6 (Felsenstein 1989, 1993). Relationships 16
among genotypes were also examined using genetic distance (Nei's) matrices, UPGMA trees, and 17
1000 bootstrap replications generated with PAUP* (Swofford, 1998). 18
RESULTS 19
20
In addition to the states where the disease was previously reported, the present work 21
identified plants with symptoms of the disease in the states of Minas Gerais, Paraíba, Alagoas and 22
Ceará. Visits were also made in the states of Pará, Piauí, Sergipe and Espírito Santo, however the 23
disease was not found in these states. 24
25
Phylogeny 26
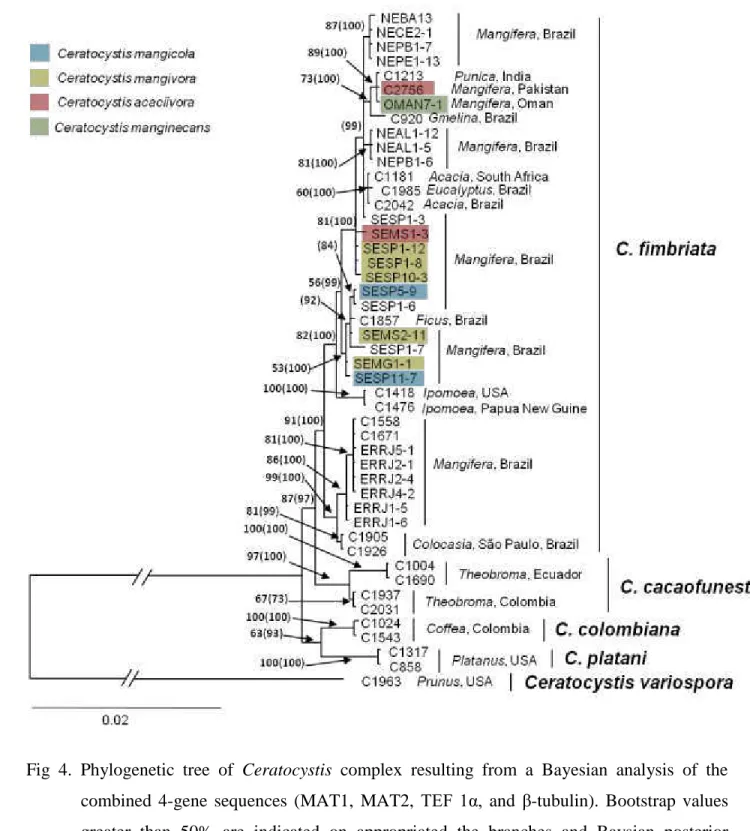
A 4-gene data set including sequences of MAT1, MAT2, TEF-1α and β-tubulin were used 27
to generated a combined phylogenetic tree (Fig 4). The final aligned combined data set contained 28
47 taxa, with a total of 4182 characters, including gaps. The Bayesian analysis lasted 760.000 29
18 1
Fig 4. Phylogenetic tree of Ceratocystis complex resulting from a Bayesian analysis of the 2
combined 4-gene sequences (MAT1, MAT2, TEF 1α, and β-tubulin). Bootstrap values 3
greater than 50% are indicated on appropriated the branches and Baysian posterior 4
probability values greater than 50% are indicated in brackets. The tree was rooted to C. 5
variospora (C1963). 6
19 1
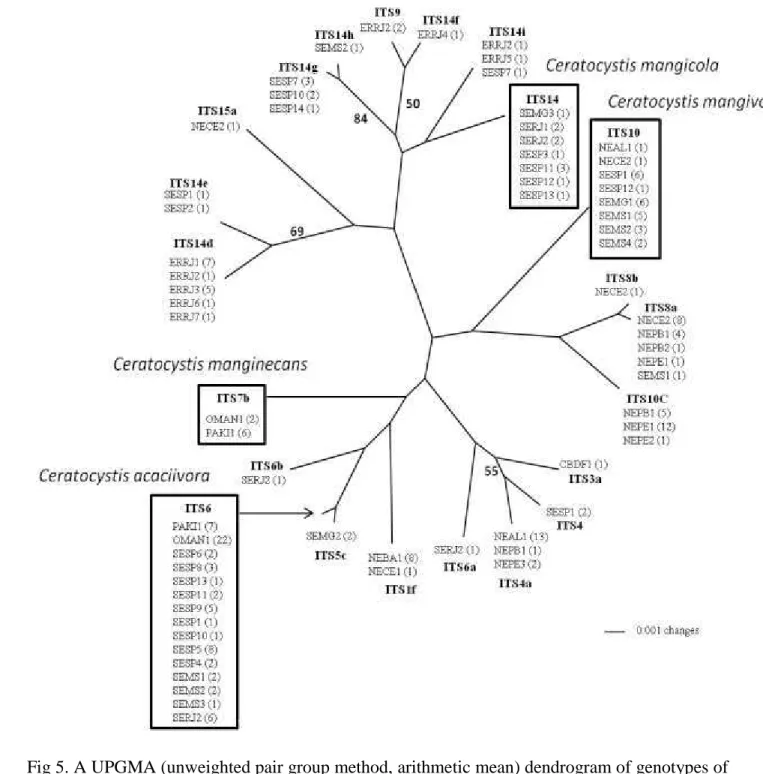
Fig 5. A UPGMA (unweighted pair group method, arithmetic mean) dendrogram of genotypes of 2
Ceratocystis fimbriata from mango based on ITS sequences. Bootstrap values are shown 3
alongside the branches. The number of isolates with that genotype from each population is 4
in parentheses. ITS numbers are based on Harrington et al. (2011), with new ITS sequences 5
20
Among 214 isolates from mango, we identified 22 ITS haplotypes, and 12 of which were 1
not previously reported in the earlier study (Harrington et al. 2014) (Fig 5). The ITS haplotype 2
numbers used by Harrington et al. (2011) were applied, with low case letters to designate new 3
sequences from Harrington et al. (2014) and in the present study. The ITS6 was found in most 4
populations from mango in SE. In ER, the ITS14d was the most common sequence and represents 5
a new ITS haplotype. Four new ITS haplotypes were identified in NE. Among 25 isolates from 6
Oman, we identified 22 as ITS6 and two as ITS7b. One isolate had a mixture of sequences and 7
from the nine cloned fragments obtained we identified three sequences as ITS7b and six as a new 8
ITS haplotype not previously reported. Some of the cloned fragments appeared to have unique 9
single base substitution that were identified as normal PCR error, with random substitution rate of 10
0.44% (Harrington et al., 2014). In Pakistan, the same ITS haplotypes were identified in mango 11
isolates, being eight as ITS6 and five as ITS7b (Harrington et al. 2014). 12
The UPGMA tree based on ITS sequences (Fig 5) showed a much different topology than 13
the tree generated by the microsatellite alleles (Fig 8, 9). Some isolates from ER were grouped 14
with isolates from SE and NE, though they have very distinct microsatellite haplotype. 15
16
Mating experiments 17
Testers from mango isolates of each of the three groups from Brazil and one group from 18
Oman successfully crossed to each other (Table 1). Also, there were successful crosses with all 19
mango isolates from Brazil and Oman with the isolate of Ceratocystis fimbriata s.s. from sweet 20
potato. In most of these crosses, there were many perithecia observed with normal ascospore 21
masses per plate. In successful crosses, perithecia usually developed within a week and produced 22
thick, creamy ascospore masses at the tips of perithecial necks (Fig 6). However, some of the 23
female testers performed poorly in crosses, perhaps through loss of femaleness (poor 24
protoperithecia or development of perithecia) (Ferreira et al, 2010). From the good crosses, single-25
ascospore progeny produced colonies of the mycelial morphology of the male and female parents. 26
In the other hand, all the isolates used as MAT2 male tester from mango did not successfully cross 27
with testers of C. platani from Platanus or C. cacaofunesta from Theobroma. Only a few perithecia 28
were produced, the ascospore masses from these perithecia were watery, not creamy, and 29
microscopic examination showed there to be misshapen ascospores and aborted asci in the 30
21 1
Fig 6. Behavior of perithecia and ascospores in mating experiments. A - Successful cross with 2
many apparently normal perithecia containing normal-appearing ascospores. B - Hybrid 3
22
Table 1. Mating experiments among strains of Ceratocystis fimbriata, Ceratocystis platani and Ceratocystis cacaofunesta. MAT-2 self-sterile sector (sec) strains were used as males and MAT-1 self-self-sterile (ss) strains as females.
MAT-2, Malea
Host MAT-1,
Femalea SESP5-1sec SEMS2-11sec NECE2-1sec OMAN1-8sec ERRJ4-2sec ERRJ1-10sec
Mangifera SESP5-1ss I - - I - -
SEMS2-11ss I I I I I I
NEBA1-10ss I - I I I I
OMAN5-7ss I I I I I I
ERRJ4-2ss - I I I I I
ERRJ2-2ss I - I I I I
Ficus C1783ss - - I I I I
Gmelina C918ss - - I I - -
Eucalyptus C1347ss I I I I I I
Colocasia C1926ss I - I I I I
Ipomoea C1418ss I I I I I I
Theobroma C1587ss H H H H H H
Plantanus C1317ss H H H H H H
H = Hybrid: much cellular debris and few misshapen ascospores inside perithecium, exuded ascospores masses, when present, watery in appearance; I = Interfertile: ascospores abundant, with normal form; exuded ascospore masses orange or creamy. Presence of both parental types when ascospores mass transferred to a new plate; - = No perithecia and ascospores produced.
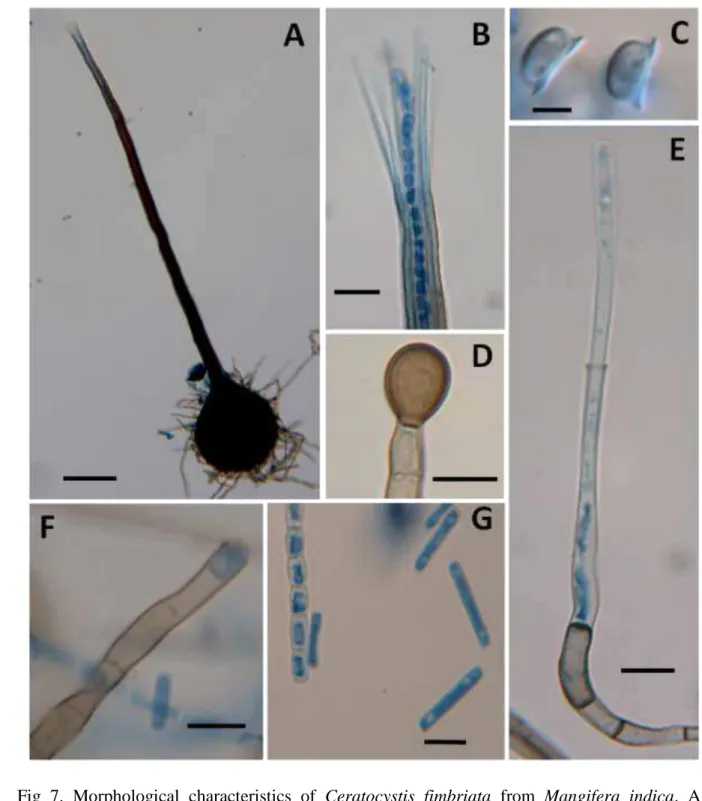
23 Morphology
1
Isolates from Southeastern Brazil, Northeastern Brazil, Eastern Rio de Janeiro and Oman 2
were examined and all of them showed very similar morphological characteristics (Fig 7) and the 3
range of measurements of all isolates were presented as follow: Cultures on malt yeast-extract agar 4
produced a typical banana odour, starting out whitish or pale brown turning to dark brown after 5-5
7 days, undersurface of agar turning dark (Rayner, 1970). Where endoconidiophore are being 6
produce stays a pale brown color, areas with perithecia are darker. Perithecia with bases superficial 7
to partially immersed, bases black or dark brown, globose, 105-280 µm diam, 115-260 µm height, 8
unornamented or with undifferentiated hyphae attached; necks black or dark brown, slender, 260-9
680 µm long, 17-38 µm diam at base and 11-22 µm at the tip; ostiolar hyphae hyaline 20-64 µm 10
long, divergent or convergent; asci not seen; ascospores 4.0-6.0 x 3.0-5.0 µm with outer cell wall 11
forming a hat-shaped brim. Endoconidiophores of two types; one flask-shape, hyaline to pale 12
brown, septate 65-195 µm long, conidiogenous cell 30-115 µm long, width 4.0-7.0 µm at base and 13
3.0-6.0 µm at the mouth; producing chains of hyaline endoconidia 10-30 x 3.0-5.0 µm; the other 14
endoconidiophore less common, shorter, 55-140 µm long, not tapering, conidiogenous cell 27-80 15
µm long, width 4.0-6.0 µm at base and 4.0-7.0 µm at the mouth; producing chains of doliform 16
endoconidia, hyaline 7.0-11.0 x 4.0-6.0 µm; aleuroconidia produced blastically, singly or in 17
24 1
Fig 7. Morphological characteristics of Ceratocystis fimbriata from Mangifera indica. A – 2
Perithecium. B – Ostiolar hyphae and emerging ascospores. C – Ascospores. D – 3
Aleuroconidium. E – Flask-shape endoconidiophore producing cylindrical endoconidium. 4
F – Doliform endoconidiophore producing doliform endoconidium. G - Cylindrical 5
endoconidia and doliform endoconidia in a chain. All features from isolate SESP5-1. Bars: 6
25
Genetic variation of haplotypes based on microsatellite alleles 1
Of the 14 microsatellite loci tested among the isolates from mango, all were polymorphic 2
with exception of the locus CAG900 (Table 3). At some locations only one, two or three isolates 3
were obtained and these were not included in the population analyses. In total, 214 isolates from 4
mango were studied, and 57 microsatellite genotypes were found. The UPGMA tree constructed 5
using these mango genotypes separated the most of the isolates in four groups found in the 6
population analyses: Southeastern Brazil (SE), Northeastern Brazil (NE), Eastern Rio de Janeiro 7
(ER) and Oman/Pakistan (OMAN/PAKI). Two microsatellite genotypes were commonly found in 8
SE, and we could find this isolates in populations in São Paulo, Minas Gerais and Mato Grosso do 9
Sul (Fig 8). This two isolates were both found in a row of trees in an abandoned nursery of Limeira 10
in the state of São Paulo, where the main nursery industry is located. One of the common genotypes 11
is MSAT1 and it was found in eight different populations in SE and the other common genotype 12
MSAT2 was found in twelve different populations in SE. Few genotypes from NE were found 13
occurring in more than one population. The isolates from ER were the most distinct and they 14
grouped separate to the other mango isolates with well-supported (98%) branch. All the isolates 15
from Oman and Pakistan were very similar, showing variation only for the locus CfCAA38, which 16
had seven different alleles, and the locus CfCAA9, which had two different alleles, but the CAA9- 17
211 allele was found in just one isolate from Pakistan or Oman. The most common microsatellite 18
26 1
Fig 8. A UPGMA (unweighted pair group method, arithmetic mean) dendrogram of genotypes of 2
Ceratocystis fimbriata from mango based on alleles of 14 microsatellite loci. Bootstrap 3
values are shown alongside the branches. The number of isolates with that genotype from 4
each population is in parentheses. Thirteen genotypes found in more than one population 5
are designated by MSAT followed by a number. 6
27
Genetic relatedness of populations based on microsatellite alleles 1
A UPGMA tree based on allele frequencies was constructed in order to compare 2
populations from mango of the present study with populations that appeared to represent natural 3
populations. The tree showed that the 19 populations from mango were separated in four 4
geographic groups: Southeastern Brazil (SE), Northeastern Brazil (NE), Easter Rio de Janeiro 5
(ER), Oman/Pakistan (OMAN/PAKI). Eucalyptus populations from Bahia and Minas Gerais and 6
an inhame population from São Paulo studied earlier (Ferreira et al. 2010) were also included for 7
comparisons. The eucalyptus populations appeared related to each other but were distinct from the 8
mango populations. The inhame population appeared to be somewhat related to mango populations 9
from eastern Rio de Janeiro (Fig 9). 10
The population SESP1 from the abandoned nursery in Limeira, São Paulo, was from a 11
single, densely-planted row of mango trees, but it had high levels of gene and genotypic diversity 12
(Table 2), including the two most widespread genotypes of C. fimbriata on mango (Fig 8). These 13
Limeira trees were planted earlier for rootstock material but were never grafted, and they were 14
apparently infected from soilborne inoculum because the infections rose from the roots. 15
Populations from São Paulo, Minas Gerais, and Mato Grosso do Sul were each dominated 16
by those genotypes found in the Limeira nursery (Fig 8, 9), and these Southeastern Brazil 17
populations were closely related based on microsatellite analysis (Fig 7). The populations SESP5, 18
SESP9 and SESP11 are connected by a well-supported (96%) branch and they are single genotype 19
populations dominated by one of the common genotypes in SE (MSAT2), leading to no gene and 20
genotypic diversity. Population SEMG1 from Frutal, Minas Gerais, and SESP7 from Taquaritinga, 21
São Paulo, were obtained from commercial plantations and both populations were composed of 22
the same genotypes and were connected by a well-supported (100%) branch. One of the genotypes 23
from the latter populations (MSAT1) is the other common genotype found in the Limeira nursery. 24
The Mato Grosso do Sul populations were very similar each other and were connected by a well-25
supported (98%) branch. These populations were dominated by the two common genotypes spread 26
in São Paulo, and the MS populations were closely related to the nursery population, connected by 27
a well-supported (99%) branch (Fig 7). Among populations from southeastern Brazil, the western 28
28 1
Fig 9. Dendrogram of the relatedness of populations of Ceratocystis fimbriata from mango, 2
eucalyptus (EucBA1, EucBA2b, and EucMG1), and inhame (ColSP3) generated by 3
UPGMA (unweighted pair group method, arithmetic mean) based on allele frequencies of 4
14 microsatellite loci. Bootstrap values are shown alongside the branches. ITS and Mating 5
29
Northeastern Brazil populations were geographically separated from each other, and they 1
showed the greatest diversity in microsatellite alleles (Table 2). Only a few genotypes were found 2
in more than one population in the Northeast (Fig 8). Populations NEPB1 and NECE2 had the 3
highest levels of gene and genotypic diversity and they were connected by a moderate to high-4
support (86%) branch (Fig 9). Populations NEAL1, NEBA1 and NEPE1 had relatively low gene 5
diversity and were dominated by one or few genotypes. Short branches suggest that populations 6
from NE appeared to be related to each other (Fig 8, 9). 7
Populations from Eastern Rio de Janeiro were the most distinct. Populations ERRJ1, 8
ERRJ2 and ERRJ3 were connected by a well-supported (91%) branch. Population ERRJ1 and 9
ERRJ3 had also strong support (91%) for grouping different than ERRJ2. Besides, population 10
ColSP3 that was obtained from inhame in a coastal area in São Paulo, the same Atlantic Rainforest 11
vegetation found in ER, was connected with the ER populations by a moderate-supported (69%) 12
branch. 13
Populations obtained from Oman and Pakistan were uniform and very similar each other, 14
with gene and genotypic diversity values very low. Both populations were connected by a well-15
supported (91%) branch, though being close related to the eucalyptus, inhame and mango isolates 16
from Brazil. 17
Nei’s gene diversity (H) was calculated for each of the 23 populations of C. fimbriata from 18
Brazil, Oman and Pakistan, including isolates from mango, eucalyptus and inhame. A second 19
calculation of gene diversity was made using only unique genotypes from each population (clone-20
corrected for population) (Table 2). Relatively high levels of gene diversity were found in SESP1, 21
SEMS1, SERJ2, NEPB1 and NECE2 from mango and in EucMG1, EucBA1 and EucBA2b from 22
eucalyptus. A gene diversity value of 0.0 was found in populations SESP5, SESP9, SESP11 and 23
ERRJ3 from mango because they were single-genotypes populations and the data gives a strong 24
support that they are introduced populations. There were relatively low levels of gene diversity 25
found in populations SESP7, SEMG1, SEMS2, NEAL1, NEBA1, NEPE1, ERRJ1, ERRJ2, 26
OMAN1 and PAKI1 from mango, and ColSP3 from inhame. Besides, when we clone-corrected 27
all the populations and compared the groups, the values of gene diversity of the populations from 28
southeastern Brazil were similar to those that apparently are natural populations (Table 2). 29
The highest genotypic diversity with rarefaction were found in populations SERJ2 (G = 30
30
= 3.27) and EucBA2b(G = 3.20) from eucalyptus, with maximum value possible of 4 (Table 2). 1
From single-genotype populations, the expected genotypic diversity value of 1.0 was observed for 2
the populations SESP5, SESP9, SESP11 and ERRJ3 from mango, also supporting that they are 3
introduced populations. The remaining populations had genotypic diversity value G = 1.50 to 2.67. 4
Based on the relatively high levels of diversity obtained from mango populations, the 5
AMOVA was utilized to determine the amount of variation attributable among groups, among 6
populations within groups and within populations (Table 4). For the three mango groups from 7
Brazil, most of the variation was attributable to variation among populations (SE = 55.71%, ER = 8
60.49%, NE = 64.30%). In Oman and Pakistan, there was no variation among population (0.0%) 9
and all the variation (100%) was attributable to variation within populations, which is consistent 10
to other results that indicate both as introduced populations (Ferreira et al., 2010). The results 11
considering all populations from mango in Brazil, Oman and Pakistan showed that most of the 12
variation (51.40%) was attributable to variation among groups, 29.88% to the variation among 13
populations within groups, and 18.68% to the variation within populations. 14
15
31
Table 2. Genetic diversity of populations of Ceratocystis fimbriata based on fourteen microsatellite loci.
Nei`s gene diversity (H) Group Population State or Province City Collected from Brazilian vegetationc No.
isolates No. Geno-types Genotypic diversity (G)a All Isolates Clone correctedb Southeastern Brazil
SERJ2 Rio de Janeiro Seropedica small farms and
gardens Mata Atlantica 10 7 3.14 0.2302 0.3003 SESP1 São Paulo Limeira one row of trees Cerrado/Mata Atlantica 11 4 2.58 0.2267 0.2946 SEMS2 Mato Grosso do Sul Aquidauana small farms Cerrado/Pantanal 6 3 2.33 0.1468 0.1587 SEMS1 Mato Grosso do Sul Aquidauana small city Cerrado/Pantanal 8 3 2.29 0.2277 0.3010
SESP7 São Paulo Taquaritinga Single
plantation Cerrado/Mata Atlantica 4 2 2.00 0.0357 0.0357 SEMG1 Minas Gerais Frutal plantation Cerrado 7 2 1.93 0.0350 0.0357 SESP5 São Paulo Cândido Rodrigues plantation Cerrado/Mata Atlantica 11 1 1.00 0.0000 0.0000 SESP9 São Paulo Santo Anastácio small city Cerrado/Mata Atlantica 5 1 1.00 0.0000 0.0000 SESP11 São Paulo Vista Aleg. do Alto plantation Cerrado/Mata Atlantica 6 1 1.00 0.0000 0.0000
All 68 14 6.04 0.2851 0.3594
Northeastern Brazil
NECE2 Ceará Brejo Santo small city Caatinga 11 7 3.48 0.2786 0.3294 NEPB1 Paraíba Conde small city Mata Atlantica 10 6 3.20 0.3814 0.3889 NEPE1 Pernambuco Cabo St. Agostinho small farms Mata Atlantica 13 5 2.67 0.1183 0.1943 NEAL1 Alagoas Água Branca small city Caatinga 14 4 2.65 0.0576 0.0714 NEBA1 Bahia Senhor do Bonfim small city Caatinga 8 2 1.50 0.0156 0.0357
All 56 22 9.41 0.4301 0.4328
Eastern Rio de Janeiro (Brazil)
ERRJ1 Rio de Janeiro São Fidélis small farms Mata Atlantica 7 3 2.43 0.0466 0.0635 ERRJ2 Rio de Janeiro Itaocara small farms Mata Atlantica 4 2 2.00 0.1339 0.1786 ERRJ3 Rio de Janeiro Itaocara plantation Mata Atlantica 5 1 1.00 0.0000 0.0000
All 16 5 5.00 0.1328 0.1508
Oman/ Pakistan
OMAN1 Al-Batinah Multiple small farms Not known 25 5 2.27 0.0361 0.0571 PAKI1 Multiple Multiple small farms Not known 13 4 1.92 0.0380 0.0804
All 38 7 4.40 0.0376 0.0741
Eucalyptus
Colocasia
EucBA1 Bahia Eunápolis plantation Mata Atlantica 26 13 3.27 0.2191 0.2899 EucBA2b Bahia Caravelas plantation Mata Atlantica 6 4 3.20 0.2262 0.2500 EucMG1 Minas Gerais Curvelo plantation Cerrado 18 14 3.74 0.3069 0.3236
All 50 31 12.49 0.3417 0.3673
ColSP3 São Paulo Piedade infected corms Mata Atlantica 12 4 2.50 0.0784 0.1429 a Stoddart and Taylor`s genotypic diversity, with rarefaction. Rarefaction gave estimated values for G of 1.0 (only one genotype in the population) to maximum value of 4.0 (all isolates of a different genotype). Maximum value of 16 were applied when comparing all populations for each group.
32
Table 3. Estimated sizes (bp) of alleles of 14 microsatellite loci in populations of Ceratocystis fimbriata on mango in four regions. Number of isolates tested in each region is shown in parentheses.
Microsatellite Loci Southeastern Brazil (94) Northeastern Brazil (61) Eastern Rio de Janeiro (20) Oman/Pakistan (38)
CAA38 146, 201, 214, 238, 247 146, 153, 162, 174, 183, 202, 211, 214, 223 168, 211 214, 312, 321, 334, 340, 349, 357
CAA80 311, 317, 320, 323, 329, 333 288, 317, 320, 323, 329, 333 311 305
CAG15 259, 286, 292 268, 286, 292, 295 277, 286 274
AAG9 391, 397, 400 397, 400, 403, 406 391 403
AAG8 174, 177, 180, 183 174, 177 186, 198 177
CAA9 175, 205 175, 178, 205 223, 197 211, 226
CAA10 128, 131, 134 128, 134 128 122
CAA15 321, 324 306, 321, 324 321, 330 324
CAT1 257, 261 254, 257, 260, 261 248 254
CAG5 298, 317, 320 317, 320 323, 326 317
GACA6K 215, 219, 221 215, 221 219 215
CAT12 374, 377 371, 374, 377 380 374
GACA60 187, 200 187 187, 221 187
33
Table 4. Analysis of molecular variance (AMOVA) of Ceratocystis fimbriata populations and regional groups on mango based on fourteen microsatellite loci.
Among Groupsb Among
Populations
Within Populations
Group d.f. % Pa d.f. % Pa d.f. % Pa
All populations 3 51.4 <0.0001 15 29.88 <0.0001 160 18.68 <0.0001
Southeastern Brazil 8 55.71 <0.0001 60 44.29 <0.0001
Northeastern Brazil 4 64.30 <0.0001 51 35.70 <0.0001
Eastern Rio de Janeiro,
Brazil
2 60.49 <0.0001 13 39.51 <0.0001
Oman/Pakistan 1 0.00 0.5318 36 100.00 0.02444
a The P value is for the null hypothesis that there is no significant variation at that level based on 1023 permutations
The index of association (IA) was used to test for random mating in all populations from
SE, NE and ER from mango. The analysis was conducted using clone-corrected data. Because of the very low variability observed in populations from Oman and Pakistan, the analysis was not conducted for this group (Table 5). The value of IA is expected to be near zero in a randomly mating
population, and 1000 randomized replicates were performed to assess whether the value obtained was significantly different from zero. Considering all populations from mango, the IA obtained
showed evidence for non-random mating or asexual reproduction (IA = 2.0090, P < 0.001). The
populations in the four groups each showed significant departure from the values expected for random mating, with values of IA (SE=1.00, P < 0.001; ER = 1.26, P = 0.045; NE = 1.39, P <
0.001).
Table 5. Index of association of Ceratocystis fimbriata populations on mango in Brazil.
Group Location No.
Genotypes
Index of
Association (IA) Probability
a
SE Southeastern Brazil 14 1.0037 < 0.001
ER Eastern Rio de Janeiro 5 1.2619 0.045
34
All
populations 2.0090 < 0.001