*Corresponding author. Tel: +989166687332 E-mail addresses: [email protected] (Z. Zalaghi) © 2014 Growing Science Ltd. All rights reserved. doi: 10.5267/j.msl.2014.3.026
Management Science Letters 4 (2014) 905–912
Contents lists available at GrowingScience
Management Science Letters
homepage: www.GrowingScience.com/msl
Measuring customer loyalty using an extended RFM and clustering technique
Zohre Zalaghi* and Yousef Abbasnejad Varzi
Department of Computer Science, International Kish Branch, Islamic Azad University, Kish, Iran
C H R O N I C L E A B S T R A C T
Article history:
Received December 28, 2013 Accepted 24 March 2014 Available online March 28 2014
Today, the ability to identify the profitable customers, creating a long-term loyalty in them and expanding the existing relationships are considered as the key and competitive factors for a customer-oriented organization. The prerequisite for having such competitive factors is the presence of a very powerful customer relationship management (CRM). The accurate evaluation of customers’ profitability is considered as one of the fundamental reasons that lead to a successful customer relationship management. RFM is a method that scrutinizes three properties, namely recency, frequency and monetary for each customer and scores customers based on these properties. In this paper, a method is introduced that obtains the behavioral traits of customers using the extended RFM approach and having the information related to the customers of an organization; it then classifies the customers using the K-means algorithm and finally scores the customers in terms of their loyalty in each cluster. In the suggested approach, first the customers’ records will be clustered and then the RFM model items will be specified through selecting the effective properties on the customers’ loyalty rate using the multipurpose genetic algorithm. Next, they will be scored in each cluster based on the effect that they have on the loyalty rate. The influence rate each property has on loyalty is calculated using the Spearman’s correlation coefficient.
© 2014 Growing Science Ltd. All rights reserved.
Keywords: Customer Life Time Customer Relationship Management RFM Model K-means Clustering Genetic Algorithm
1. Introduction
906
value. Therefore, customers’ segmentation is considered as one of the primary approaches in marketing, which plays significant role in customer relationship management (CRM). CRM is defined the management skills in the organizational level obtained through a deep understanding, participating and managing the customers’ requirements and it is based on the knowledge obtained from the customers in the direction of increasing the organizational efficacy and productivity and consequently profitability. Today, utilization of the CRM strategies plays essential role as one of the main motives behind many efforts made by firms to create better value for their customers and have long-term revenue for them. The data extraction tool helps organizations necessary knowledge from customers’ data under a CRM framework (Golmah & Mirhashemi, 2012). The concept of customer lifetime (CLV) or loyalty is to measure customers’ loyalty in CRM (Chuang & Shen, 2008). CLV is the current value of all profits obtained from customers and it helps the decision makers target the appropriate markets, more effectively. Many researchers recommended numerous models for CLV calculation and utilization. One of the models used for discovering the rules dominant on the customer relationship is recency, frequency and magnitude (RFM) models. After the preliminary investigations on the previous studies on CRM, it was determined that no approach was suggested so far based on feature selection using the multi-objective genetic algorithm (MOGA) to evaluate the customer loyalty rate but no specific criterion was used in these approaches to weigh the attributes.
In this paper, an approach is suggested, which specifies the attributes effective on the determination of the organization’s customers’ loyalty rate using MOGA whose attributes form the RFM model. The influence rate of each attribute is calculated using the Spearman’s correlation coefficient when determining the customers’ loyalty. This method can specify the loyal and disloyal customers with a good precision.
2. The work platform
2.1The K-means clustering algorithm
Clustering is a data-mining technique, which yields meaningful and informative clusters of objects with similar properties in an automatic mode (Garcia-Murillo & Annabi, 2002). In clustering, the primary objective is to form various groups with similar characteristics and the proposed study of this paper uses the K-means clustering. The purpose of executing K-means is to divide samples into k
clusters and K prime centers will be selected randomly from the input data. Then the distance between each datum and each of the K centers are calculated and they are allocated to the cluster with the least distance with its center. After the allocation of all the points to the K centers, the mean of each cluster is calculated as the new center and the calculation of elements’ distance and their allocation are continued to new centers until there is no displacement in the clusters elements (Baradwaj & Pal, 2011).
2.2 The Spearsman’s Correlation Coefficient
The correlation coefficient is a statistical technique for determining the type and the degree of the relationship between a quantitative variable and another quantitative variable. The correlation coefficient is one of the criteria applied for determining the correlation of two variables. The correlation coefficient demonstrates the intensity and the type of relationship, which could direct or inverse. This coefficient is between 1 to -1, but in case there is no relationship between the two variables, it is 0.
2.3 The Genetic Algorithm
algorithm and solutions will be encoded based on a pattern. In addition, the criterion called the propriety function evaluates each candid solution. In fact, the set of solutions for a problem will be selected randomly and form the primary population. In each level, some of these solutions will be chosen based on the propriety function and will produce the next generation. If this algorithm is designed properly, it will converge towards the optimal solution. One solution for the given problem is demonstrated via a list of parameters called chromosome or genome. Chromosomes are mainly shows as a single string of data. Of course, other types of data structures can also be applied. At first, different indices are generated for creating the first generation. Throughout each generation, each single specification is evaluated through the propriety function. To create the next generation, two genetic operators including chromosomes linkage and mutation are implemented. In the chromosomes linkage operator, two of the solutions from the population are chosen based on the propriety function and they are mixed together in order to generate new solutions or the offspring. In the operator, the offspring gene mutation are changed randomly, which leads the genetic algorithm not to get stuck in the local optimal (Baradwaj & Pal, 2011). The multipurpose genetic algorithm is similar to the genetic algorithm except that the objective is to optimize different purposes, simultaneously. One alternative for these multipurpose optimization solutions is to change them to a problem with one purpose. To so this, the purpose of the problem equals a combination of various primary solutions each of which is assigned a weight (Dias & De Vasconcelos, 2002).
2.4 The extended RFM model
One of the models used for detecting the rules dominant on the customers’ relationships is the RFM models. The RFM models evaluate three properties for customers and score them based on the following properties,
1. Recency: the amount of time elapsed from the last transaction. Lower values indicate higher likelihood of customers’ repurchase.
2. Frequency: The number of transactions conducted in a specified time span. Higher values indicate higher possibility of customer loyalty.
3. Monetary: The more the price of this transaction, the more the organization’s attention to it.
According to Bult and Wansbeek (1995), the customer score in this model is calculated as follows,
C = + + (1)
where j i
C is the customer j’s score, CRj is the recency property value, CFj is the frequency property
value and finally j M
C is the value of the transaction price property for the customer j. In subsequent
studies, the extended version of RFM is proposed. This model is called the weighed RFM model. In this approach, each RFM property is given a coefficient proportionate to its importance (Stone &
Jacobs, 1988). In this approach, the following equation is used for calculating each customer’s score:
C = w + + (2)
In this equation, wM, wF and wR represent the transaction price, the frequency property weight, and the recency property weight, respectively. There are also other ways proposed by considering other parameters such as RFM and WRFM.
3. Recent works
908
transaction price, the relationship time span is considered. The purpose of the relationship time span is the time interval between the first and the last transactions. This approach first clusters the customers and then it finds the error rate based on the distance each record. After clustering, the loyalty amount is calculated for each customer using the WRFM method and then the customers are classified into 16 groups. These groups specify the customers’ profitability rate.
Danaee et al. (2013) considered an approach for classification and prioritization of the customers of a company using the concept of CLV and measuring the customers’ value and according to the importance of their needs. In this approach, the WRFM model and the K-means clustering algorithm are used, which means that first the R, F and M values are specified for each customer and then their weights (relative importance) are determined using analytical hierarch process (AHP) method (Saaty, 1988) and each customer’s value is calculated based on the WRFM model. In the next level, the K-means clustering algorithm places the customers into 8 clusters according to their scores. Then the customers’ clusters are ranked based on their CLV. Finally, the obtained results along with the strategies that are to be applied by the company in various clusters are studied. Khajvand and Tarokh
(2011) presented a model where the customers’ loyalty rate is calculated after studying their history
in different periods and their behaviors in the future is estimated. This framework consists of 7 phases. First, it collects the required information in a six-season periods, then the collected data are divided based on the seasonal divisions and the RFM parameters are extracted for each customer and calculates clusters based on K-means and customer loyalty is calculated. Chan (2008) introduced a genetic algorithm (GA) for customers’ segmentation. In order to apply the genetic algorithm, first the data were converted into a string format of binary numbers called the chromosomes. In each generation, GA generated a new population using operators such as linkage and mutation. Finally, only those individuals with higher fitness can survive. In this algorithm, first the input data are converted into the binary strings. Second, the chromosomes are generated, randomly. Third, each chromosome is evaluated and individuals with higher fitness will be selected as the parents for the next generation. Fifth, the crossover is applied to produce new chromosomes. The mutation takes place in one bit, the new generation is generated.
4. The proposed method
In this paper, a method is presented for evaluating the customers’ loyalty rate. For the suggested method, first the properties and attributes which are more important in identifying the profitable and loyal customers in an organization are selected using the GA and then the customers are scored using the extended RFM model in terms of their loyalty rate. The rate at which each attribute is allocated will be calculated when specifying the customers’ loyalty, using the Spearman’s correlation coefficient. The suggested method can identify the loyal and disloyal customers with a good precision. Based on this, organizations will be able to take on various strategies based on the customers’ properties in order to find and keep the profitable customers in the future.
In this paper, we have tried to select the attributes and properties, which are more important when specifying the customers’ loyalty rate in each cluster using the multipurpose GA after clustering the customers. Then we determined the customers’ loyalty rate based on the extended RFM model. The implementation phases of the suggested method are as follows:
1. Cluster the customers using the K-means clustering algorithm, 2. Calculate the Spearman’s correlation coefficient for all properties,
3. Select the properties that are effective in determining the customers’ loyalty rate using the multipurpose genetic algorithm,
4. Calculate the customers’ score based on the extended RFM method.
= ∑ ( − )( − )
∑ ( − ) ∑ ( − ) (3)
For each attribute (property), x, from the customers’ information set in the training set, there is a set of values. The attribute y is an attribute, which specifies whether the customer is loyal (1) or not (0). This way the correlation of each attribute is obtained with the customer’s loyalty rate in each cluster. The chromosomes are considered equal to the set of attributes, i.e. each chromosome consists of 16 genes (attributes). If the attribute exists in the set of solutions, its corresponding value will be 1 and zero, otherwise. After creating the primary population, new generations will constantly be produced after the mutation and linkage operators are applied and will further be replaced by the previous generation. This process will continue until the solutions are converged towards the optimal solution. The purposes of the multipurpose genetic algorithm in the suggested method are: a) minimizing the number of attributes in the set and b) maximizing the set ability of prediction. Therefore, if we consider two purposes as one, we will have:
= ℎ ℎ (2)
To determine the set prediction power, the Spearman’s correlation coefficient is used. The prediction power equals the total of Spearman’s correlation coefficients belonging to the attributes whose genes value equals 1. In order to calculate the customers’ score based on the extended RFM method, after selecting the properties, which are effective in determining the customers’ loyalty rate, the customers will be scored based on these properties. This score is indicative of the customer’s life time. In this phase, each of the selected properties will be assigned a weight equal to the Spearman’s correlation coefficient. The score of each customer is calculated as follows,
× = ℎ (3)
where Wi is the weight of the i-th attribute (Spearman’s correlation coefficient) and Ci is the value of the i-th attribute. Obviously, higher scores indicate higher customer’s life time. In order to evaluate the presented approach, the Bank Marketing Data Set [http://kdd.ics.uci.edu] is employed, which includes three properties, namely recency, frequency and monetary. After clustering, the customers’ records will be classified into four clusters. For each attribute, the Spearman’s correlation coefficient is calculated per every four clusters. Then for each cluster, the attributes, which determine the customer’s loyalty were selected. Based on the selected attributes in clusters, the scoring relations for customers were specified. In order to accurately assess the obtained relations, a set of records was employed as the examine set for each cluster. After clustering the records, each cluster is stored in a separate file. For each cluster, two third of the records were employed for the training set and the rest were used as the exam set. After the examining the suggested method with the records related to the exam set, the mean score pertinent to the loyal and disloyal customers are depicted for each cluster in Table 1 as follows,
Table 1
The mean score of customers in each cluster
Cluster The mean score of loyal customers The mean score of disloyal customers
1 289.33 127.15
2 157.72 69.06
3 121.06 65.76
4 319.72 82.08
Now, in order to evaluate the obtained results, the two criteria, namely recall and precision were used as follows,
910
= + (5)
where TP represents the number of customers who were correctly realized as loyal, Fn states the number of customers who were not correctly recognized as loyal and FP is associated with the number of customers who were incorrectly realized as loyal. As it is shown in Table 2, the suggested method identified the customers’ situation very well. This identification enables the related company and organization to identify those customers that bring no profit to the system and avoid much concentration on their requests and tastes.
Table 2
Evaluation of the suggested method with the criteria ‘recall’ and ‘precision’
TP FP Fn Precision recall
Cluster 1 404 82 17 0.83 0.96
Cluster 2 340 67 18 0.84 0.95
Cluster 3 175 21 31 0.89 0.85
Cluster 4 299 44 5 0.87 0.98
In order to compare the performance of the proposed method, two methods presented by Liu and Shih
(2005) were employed, namely WRFMCD and A-WRFMCD. In these methods that are applied on a
hardware sale database, first the RFM values of each customer are normalized. Then they will be multiplied by their weights, which are calculated using the Pearson’s correlation coefficient, and then the customers’ records will be clustered using the K-means algorithm, and applying the associative rules on the clusters, it extracts rules for presenting good suggestions to the customers. The two criteria, namely recall and precision are employed to evaluate these methods. Table 3 shows the values resulted from the above mentioned evaluations.
Table 3
The evaluation results of the methods, namely WRFMCD and A-WRFMCD with the two criteria, namely precision and recall
WRFMCD method A-WRFMCD method
Top-N Precision Recall Top-N Precision Recall
Top-2 0.31 0.32 Top-2 0.30 0.32
Top-4 0.32 0.33 Top-4 0.32 0.33
Top-6 0.38 0.45 Top-6 0.40 0.47
Top-10 0.45 0.64 Top-10 0.45 0.66
Top-20 0.45 0.65 Top-20 0.47 0.67
Top-30 0.45 0.65 Top-30 0.46 0.66
Top-40 0.42 0.63 Top-40 0.42 0.64
Top-50 0.41 0.62 Top-50 0.42 0.63
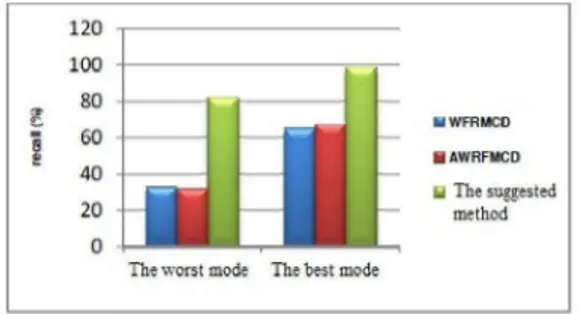
Fig. 1 and Fig. 2 compare the performance of the proposed model with WRFMCD and A-WRFMCD under the best and the worst mode.
Fig. 1. A comparison of the ‘recall’ value from the
suggested method and that of the methods ‘WRFMCD’ and ‘A-WRFMCD’
Fig. 2. A comparison of the ‘precision’ value from the
As we can observe from Fig. 1 and Fig. 2, the suggested method in the customers’ classification provides good precision. In the worst mode, it outperformed the best mode compared with the other two methods.
6. Conclusion
In this paper, a method was presented to determine the customers’ loyalty rate. This method first classified the customers based on their specifications in some clusters using the K-means clustering. Then it specified properties in each cluster, which help identifying the customers’ loyalty rate based on an extended WRFM method. To specify this property set, the multipurpose genetic algorithm was used. The purposes of this algorithm were defined as reducing the number of properties and increasing the prediction power. In order to evaluate the suggested method, a valid benchmarks were employed. The results obtained from the implementation have indicated of the high precision of the suggested method in identifying the condition of customers’ life time.
To conduct more studies in this field, one can utilize more precise clustering algorithms. In addition, since many attributes do not play an important role in determining the customers’ loyalty, one can conduct a pre-process on the primary data and eliminate these attributes. After eliminating the attributes, applying the suggested method on the resulting database may provide better result.
References
Alvandi, M., Fazli, S., & Abdoli, F. S. (2012). K-Mean clustering method for analysis customer
lifetime value with LRFM relationship model in banking services. International Research Journal
of Applied and Basic Sciences, 3(11), 2294-2302.
Balaji, S., & Srivatsa S. K. (2012). Customer segmentation for decision support using clustering and association rule based approaches. International Journal of Computer Science and Engineering
Technology, 3(11), 525-529.
Baradwaj, B. K., & Pal, S. (2011). Mining Educational Data to Analyze Students'
Performance. International Journal of Advanced Computer Science & Applications, 2(6), 63-69.
Bult, J. R., & Wansbeek, T. (1995). Optimal selection for direct mail. Marketing Science, 14(4),
378-394.
Chan, C. C. H. (2008). Intelligent value-based customer segmentation method for campaign
management: A case study of automobile retailer. Expert Systems with Applications, 34(4),
2754-2762.
Cheng, C. H., & Chen, Y. S. (2009). Classifying the segmentation of customer value via RFM model
and RS theory. Expert Systems with Applications, 36(3), 4176-4184.
Chuang, H. M., & Shen, C. C. (2008, July). A study on the applications of data mining techniques to
enhance customer lifetime value—based on the department store industry. In Machine Learning
and Cybernetics, 2008 International Conference on (Vol. 1, pp. 168-173). IEEE.
Danaee, H., Aghaee, Z., Haghtalab, H., & Pour Salimi, M. (2013). Classifying and designing customer's strategy pyramid by customer life time value (CLV) (Case study: Shargh Cement Company). Journal of Basic Applied Science Resources, 3(7), 473-483.
Dias, A. H., & De Vasconcelos, J. A. (2002). Multiobjective genetic algorithms applied to solve
optimization problems. Magnetics, IEEE Transactions on,38(2), 1133-1136.
Garcia-Murillo, M., & Annabi, H. (2002). Customer knowledge management.Journal of the
Operational Research society, 53(8), 875-884.
Golmah, V., & Mirhashemi, G. (2012). Implementing A Data Mining Solution To Customer
Segmentation For Decayable Products-A Case Study For A Textile Firm. International Journal of
912
Hosseini, S. M. S., Maleki, A., & Gholamian, M. R. (2010). Cluster analysis using data mining
approach to develop CRM methodology to assess the customer loyalty. Expert Systems with
Applications, 37(7), 5259-5264.
Khajvand, M., Zolfaghar, K., Ashoori, S., & Alizadeh, S. (2011). Estimating customer lifetime value
based on RFM analysis of customer purchase behavior: Case study. Procedia Computer
Science, 3, 57-63.
Khajvand, M., & Tarokh, M. J. (2011). Estimating customer future value of different customer
segments based on adapted RFM model in retail banking context. Procedia Computer Science, 3,
1327-1332.
Liu, D. R., & Shih, Y. Y. (2005). Hybrid approaches to product recommendation based on customer
lifetime value and purchase preferences. Journal of Systems and Software, 77(2), 181-191.
Mak, M. K., Ho, G. T., & Ting, S. L. (2011). A Financial Data Mining Model for Extracting
Customer Behavior. International Journal of Engineering Business Management, 3(3), 59-72.
Saaty, T. L. (1988). What is the analytic hierarchy process? (pp. 109-121). Springer Berlin
Heidelberg.
Stone, B., & Jacobs, R. (1988). Successful direct marketing methods. Lincolnwood, IL: NTC