DOI: http://dx.doi.org/10.15282/jmes.8.2015.2.0124
1275
FATIGUE FEATURE EXTRACTION ANALYSIS BASED ON A K-MEANS CLUSTERING APPROACH
M.F.M. Yunoh1, S. Abdullah1*, M.H.M. Saad1, Z.M. Nopiah2 and M.Z. Nuawi1
1
Department of Mechanical and Materials Engineering 2
Fundamental Studies of Engineering Unit, Faculty of Engineering and Built Enviroment, Universiti Kebangsaan Malaysia, 43600 Bangi,
Selangor, Malaysia *Email: [email protected] Phone: +60389118411; Fax: +60389118389
ABSTRACT
This paper focuses on clustering analysis using a K-means approach for fatigue feature dataset extraction. The aim of this study is to group the dataset as closely as possible (homogeneity) for the scattered dataset. Kurtosis, the wavelet-based energy coefficient and fatigue damage are calculated for all segments after the extraction process using wavelet transform. Kurtosis, the wavelet-based energy coefficient and fatigue damage are used as input data for the K-means clustering approach. K-means clustering calculates the average distance of each group from the centroid and gives the objective
function values.Based on the results, maximum values of the objective function can be
seen in the two centroid clusters, with a value of 11.58. The minimum objective function value is found at 8.06 for five centroid clusters. It can be seen that the objective function with the lowest value for the number of clusters is equal to five; which is therefore the best cluster for the dataset.
Keywords: Clustering; fatigue feature extraction; k-means; objective function; segments.
INTRODUCTION
Material fatigue has been identified as a main cause of most mechanical failures; particularly in automotive components [1]. In the automotive industry, components; especially suspension systems, are commonly subjected to fatigue loadings that lead to cracks or failures [2]. Consequently, many researchers have developed techniques and tools for fatigue assessment, i.e., laboratory tests, data collection, specific tools and data analysis, in order to identify and prevent fatigue failure [3]. The clustering and classification approach is among the data analysis methods used in fatigue analysis. Data clustering has attracted the attention of many researchers in different disciplines. It is an important and useful technique in data analysis [4]. Until now, clustering and classification for fatigue data analysis has not been extensively studied by researchers.
Putra et al. [5] used clustering analysis to analyze the segment behaviors of fatigue data
for car suspension systems. Based on his studies, segment extraction can be optimized
using a clustering method. Meanwhile, Mao et al. [6] applied clustering analysis to
generate a safety index based on fatigue datafor ship structures. Clustering analysis can
1276
clusters) that correspond to a specific damage mode. This method allows the differentiation of signals resulting from damage mechanisms [7]. In statistic and data mining, K-means clustering is well-known for its efficiency in clustering large datasets [8].
Signal processing analysis for fatigue feature extraction basically contributes much scattered data. Consequently, it deals with this kind of data to determine behaviors. In this paper, fatigue feature extraction was analyzed using K-means clustering to find the cluster that best represents fatigue damage. The objective of this study is to group the dataset into clusters, so that similar items are lumped together in the same cluster. The data lying in one cluster should be as close as possible to the next (homogeneity).
THEORETICAL BACKGROUND
A time series contains a set of explanations of variables taken at equally spaced time intervals. Statistical analysis is commonly used to determine random signals and monitor the pattern of an analyzed signal. In fatigue signals, the calculation of the root-mean-square (r.m.s.) and kurtosis are very important; in order to retain a certain amount
of the signal’s amplitude range characteristics. Both values are defined respectively
as Nuawi et al. [9].
2 / 1 1 2 1 . .
n j j x n s mr (1)
n j j x x s m r n K 1 4 4 ) . . (1 (2)
where, xj is the amplitude of the signal.
A wavelet transform can be classified as either a continuous wavelet transform (CWT) or a discrete wavelet transform (DWT), depending on the discretization of the scale parameter of the analyzing wavelet. A DWT based on such wavelet functions is called an orthogonal wavelet transform (OWT). Orthogonal wavelet transforms are normally applied for the compression and feature selection of signals. DWT is derived from discrete CWT, and is shown as the following expression [10]:
t t k dtf DWT j j j k j
2 2 2 1 ) ,( (3)
where, a and j are the scale factors, both b and k are the position and Ψ is the mother
wavelet.
The strain-life approach (ε-N), which is a suitable approach in analyzing
random data collected from automotive components, was used for the analysis because
the case study related to low-cycle fatigue. Palmgren–Miner’s linear cumulative damage
rule is normally associated with established strain-life fatigue damage models, i.e., the
Coffin–Manson, the Morrow, and the Smith–Watson–Topper (SWT). The Coffin–
Manson relationship only considers the damage calculation at zero mean stress. However, in a real situation, some realistic service situations involve non-zero mean
1277
particularly for wholly compressive cycles – the Morrow mean stress correction effect
provides more realistic life estimates and seems to work reasonably well for steel. The strain-life model is mathematically defined as the following expression [11].
c f f b f f
a N N
E (2 ) (2 )
' '
(4)
K-means, which is a fast and popular method, is used to perform clustering, because it easily manages huge amounts of data. The basic intuition behind K-means is the continuous reassignment of objects into different clusters, so that the within-cluster distance is minimized. It uses an iterative algorithm, divided into two phases, to minimize the sum of point-to-centroid distances over all K clusters [12]. Objective functions for K-means are defined as the following expression:
( ) 2
1 j
j i c i k j
h x c
J
(5)
where, ( ) 2
j j
i c
x is the distance between point xi(j) and the mean of point cj.
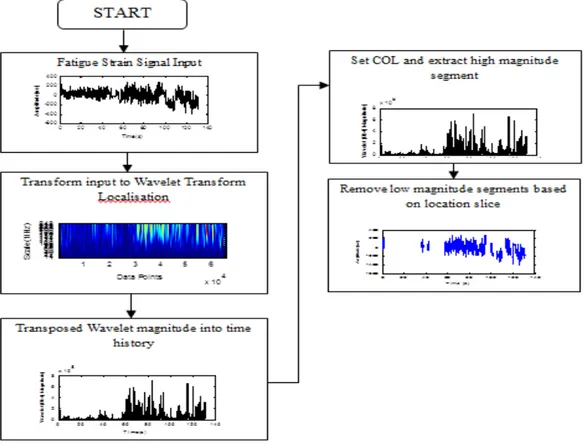
Figure 1. A diagrammatic process flow of the wavelet transform extraction method.
METHODOLOGY
1278
the data are analyzed with wavelet coefficient plots using a time–scale representation.
This is also associated with energy coefficient plots for input values in fatigue data extraction. Data extraction was undertaken using wavelet transform analysis. This process divides data into segments after the low amplitude has been removed (as shown in Figure 1). Every segment extracted from the wavelet analysis was then analyzed
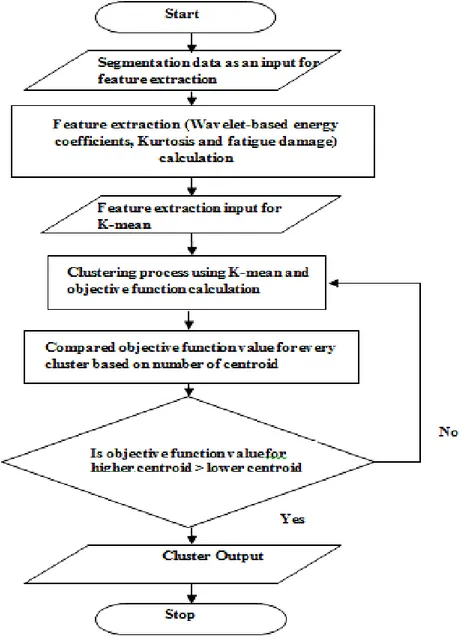
using a statistical method to find the fatigue feature’s extraction properties, i.e., kurtosis,
wavelet-based energy coefficient and fatigue damage. These parameters served as input data for the clustering process. Figure 2 shows the clustering process flowchart using a K-means algorithm. In this analysis, clusters with a certain centroid were formed, with different colors for all objects. The cluster was analyzed based on the changing fatigue feature extraction values. The best cluster was determined based on the objective function value using a Euclidean distance calculation [13]. Euclidean distance gives the distance value for every cluster to the centroid.
1279
RESULTS AND DISCUSSION
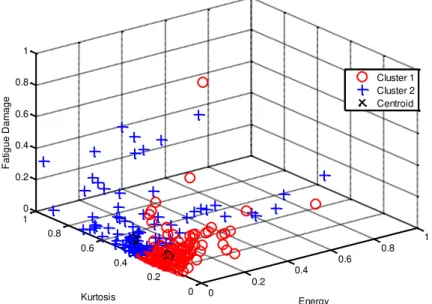
Figures 3-6 show the clustering results for the fatigue feature extraction properties, based on segments using a K-means clustering approach. Based on the plots shown in Figures 3 and 4, every cluster showed a scattered pattern distribution. In this paper, K-means clustering went from a two-centroid cluster to a five-centroid cluster. The selection of this number of centroids was due to a comparison of the density distribution of the data in the clusters, based on an optimized group. The clustering plot, using two centroid points (shown in Figure 3), produced two groups with a scattered distance between most of the data to each centroid. This shows that K-means clustering was very weak at determining the initial centroid because it used centroid point randomness [14]. It can be seen that more than two groups were able to be formed from the data, because in the second groups of data the distributions were not at a uniform distance from the centroid. Based on the clustering plot, the groups of higher and lower fatigue damage were difficult to determine, because the data were only scattered in two groups.
0
0.2 0.4
0.6 0.8
1
0 0.2 0.4 0.6 0.8 1 0 0.2 0.4 0.6 0.8 1
Energy Kurtosis
F
a
ti
g
u
e
D
a
m
a
g
e
Cluster 1 Cluster 2 Centroid
Figure 3. Kurtosis and energy coefficient distributions of fatigue damage for two centroids.
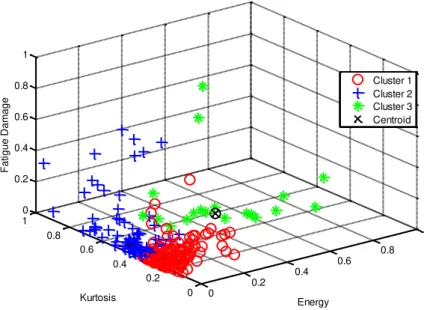
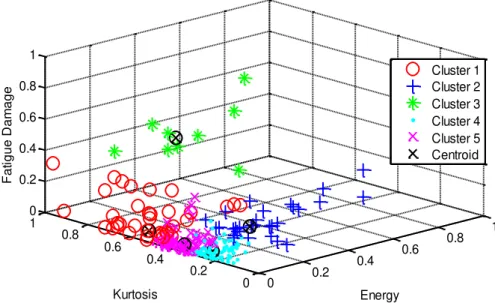
Figure 4 shows the clustering using three centroid points, which produced the best group, compared to the two centroid points. However, in group three (green), there
was a clear separation of data distribution. Despite sharing the same centroid, the data
1280
0
0.2 0.4
0.6 0.8
1
0 0.2 0.4 0.6 0.8 1 0 0.2 0.4 0.6 0.8 1
Energy Kurtosis
F
a
ti
g
u
e
D
a
m
a
g
e
Cluster 1 Cluster 2 Cluster 3 Centroid
Figure 4. Kurtosis and energy coefficient distributions of fatigue damage for three centroids.
0
0.2 0.4
0.6 0.8
1
0 0.2 0.4 0.6 0.8 1 0 0.2 0.4 0.6 0.8 1
Energy Kurtosis
F
a
ti
g
u
e
D
a
m
a
g
e
Cluster 1 Cluster 2 Cluster 3 Cluster 4 Centroid
Figure 5. Kurtosis and energy coefficient distributions of fatigue damage for four centroids
1281 0 0.2
0.4 0.6
0.8 1
0 0.2 0.4 0.6 0.8 1 0 0.2 0.4 0.6 0.8 1
Energy Kurtosis
F
a
ti
g
u
e
D
a
m
a
g
e
Cluster 1 Cluster 2 Cluster 3 Cluster 4 Cluster 5 Centroid
Figure 6. Kurtosis and energy coefficient distributions of fatigue damage for five centroids.
The average distance between data points in the entire centroid cluster is known as the objective function. The objective function values are shown in Table 1. The maximum objective function value seen in the two centroid points was 11.58. Meanwhile, the minimum objective function value was 8.06 for the five centroid points. Based on these results, the objective function value decreased with the increasing number of centroid points in the cluster. This shows that when the number of centroid points increases, the distribution data is more focused towards their centroid and the
average distance to the centroid of each data decreases. A smaller objective function
value gave closer data distributed at each centroid. Table 1 shows that the objective function has the lowest value for clusters equal to five. Therefore, the five centroid points contributed the best cluster for this analysis.
Table 1. Average objective function values.
No. of Clusters Objective Function Value
C=2 11.58
C=3 9.77
C=4 9.04
C=5 8.16
CONCLUSIONS
1282
ACKNOWLEDGEMENTS
Authors would like to express their gratitude to Universiti Kebangsaan Malaysia (Project No: UKM-GUP-2011-069 and UKM-AP-2011-13, for supporting this research.
REFERENCES
[1] Nadot Y, Denier V. Fatigue failure of suspension arm: experimental analysis and
multiaxial criterion. Engineering Failure Analysis. 2004;11:485-99.
[2] Fourlaris G, Ellwood R, Jones T. The reliability of test results from simple test
samples in predicting the fatigue performance of automotive components. Materials & design. 2007;28:1198-210.
[3] Lee DC, Han CS. CAE (computer aided engineering) driven durability model
verification for the automotive structure development. Finite Elements in Analysis and Design. 2009;45:324-32.
[4] Velmurugan T. Performance based analysis between k-Means and Fuzzy
C-Means clustering algorithms for connection oriented telecommunication data. Applied Soft Computing. 2014;19:134-46.
[5] Putra TE, Abdullah S, Schramm D, Nuawi MZ, Bruckmann T. FCM-based
Optimisation to Enhance the Morlet Wavelet Ability for Compressing Suspension Strain Data. Procedia Materials Science. 2014;3:288-94.
[6] Mao W, Rychlik I, Storhaug G. Safety index of fatigue failure for ship structure
details. Journal of Ship Research. 2010;54:197-208.
[7] Momon S, Godin N, Reynaud P, R’Mili M, Fantozzi G. Unsupervised and
supervised classification of AE data collected during fatigue test on CMC at high temperature. Composites Part A: Applied Science and Manufacturing. 2012;43:254-60.
[8] Peng J, Wei Y. Approximating k-means-type clustering via semidefinite
programming. SIAM Journal on Optimization. 2007;18:186-205.
[9] Nuawi MZ, Abdullah S, Arifin A, Haris SM. MATLAB: A Comprehensive
reference for engineers: Mc Graw Hill (Malaysia); 2009.
[10] Purushotham V, Narayanan S, Prasad SA. Multi-fault diagnosis of rolling bearing elements using wavelet analysis and hidden Markov model based fault recognition. NDT & E International. 2005;38:654-64.
[11] Oh CS. Application of wavelet transform in fatigue history editing. International Journal of Fatigue. 2001;23:241-50.
[12] Nopiahl Z, Khairir M, Abdullah S, Mikhael W, Caballero A, Abatzoglou N, et al. Segmentation and scattering of fatigue time series data by kurtosis and root mean square. WSEAS International Conference Proceedings Mathematics and Computers in Science and Engineering: World Scientific and Engineering Academy and Society; 2008.
[13] Jafar OM, Sivakumar R. Hybrid Fuzzy data clustering algorithm using different distance metrics: A comparative study. International Journal of soft Computing and Engineering 2014;3:241-8.
[14] Yedla M, Pathakota SR, Srinivasa T. Enhancing K-means clustering algorithm with improved initial center. International Journal of computer science and information technologies. 2010;1:121-5.