The Global Epidemiology of Syphilis in the
Past Century
–
A Systematic Review Based on
Antenatal Syphilis Prevalence
Chris Richard Kenyon
1,2*
, Kara Osbak
1, Achilleas Tsoumanis
31HIV/STI Unit, Institute of Tropical Medicine, Antwerp, Belgium,2Division of Infectious Diseases and HIV Medicine, University of Cape Town, Cape Town, South Africa,3Clinical Trials Unit, Institute of Tropical Medicine, Antwerp, Belgium
*ckenyon@itg.be
Abstract
Background
How can we explain the uneven decline of syphilis around the world following the
introduc-tion of penicillin? In this paper we use antenatal syphilis prevalence (ASP) to investigate
how syphilis prevalence varied worldwide in the past century, and what risk factors correlate
with this variance.
Methods
1) A systematic review using PubMed and Google Scholar was conducted to identify
coun-tries with published data relating to ASP estimates from before 1952 until the present.
Eleven countries were identified (Canada, Denmark, Finland, India, Japan, Norway,
Singa-pore, South Africa, United States of America (USA), United Kingdom (UK) and Zimbabwe).
The ASP epidemic curve for each population was depicted graphically. In South Africa and
the USA, results are reported separately for the black and white populations. 2) National
antenatal syphilis prevalence estimates for 1990 to 1999 and 2008 were taken from an
Insti-tute for Health Metrics and Evaluation database on the prevalence of syphilis in low risk
populations compiled for the Global Burden of Diseases study and from a recent review
paper respectively. National ASPs were depicted graphically and regional median ASPs
were calculated for both time periods. 3) Linear regression was used to test for an
associa-tion between ASP in 1990
–
1999 and 2008 and four risk factors (efficacy of syphilis
screen-ing/treatment, health expenditure, GDP per capita and circumcision prevalence). WHO
world regions were included as potential explanatory variables.
Results
In most populations, ASP dropped to under 1% before 1960. In Zimbabwe and black South
Africans, ASP was high in the pre-penicillin period, dropped in the post-penicillin period, but
then plateaued at around 6% until the end of the 20th century when ASP dropped to just
above 1%. In black Americans, ASP declined in the post penicillin period, but plateaued at
a11111
OPEN ACCESS
Citation:Kenyon CR, Osbak K, Tsoumanis A (2016) The Global Epidemiology of Syphilis in the Past Century–A Systematic Review Based on Antenatal Syphilis Prevalence. PLoS Negl Trop Dis 10(5): e0004711. doi:10.1371/journal.pntd.0004711
Editor:Pamela L. C. Small, University of Tennessee, UNITED STATES
Received:February 26, 2016
Accepted:April 23, 2016
Published:May 11, 2016
Copyright:© 2016 Kenyon et al. This is an open access article distributed under the terms of the Creative Commons Attribution License, which permits unrestricted use, distribution, and reproduction in any medium, provided the original author and source are credited.
Data Availability Statement:All relevant data are within the paper and its Supporting Information files.
Funding:The authors received no specific funding for this work.
3
–
5% thereafter. ASP was statistically significantly higher in sub-Saharan Africa in 1990
–
1999 and 2008 than in the other world regions (
P
<
0.001). On multivariate analysis in both
time periods, ASP was only associated with residence in sub-Saharan Africa.
Conclusions
Further research is necessary to elucidate the reasons for the higher prevalence of syphilis
in sub-Saharan Africa.
Author Summary
Syphilis rates have varied tremendously between different populations around the world.
We conducted a systematic review of syphilis prevalence in pregnant women in 13
popula-tions with available data for the last 100 years. Our findings were that in most populapopula-tions
syphilis prevalence dropped to under 1% before 1960. In the 2 populations from sub
Saha-ran Africa, the syphilis prevalence remained around 6% until 50 years after the
introduc-tion of penicillin. Other systematic reviews were utilized to provide syphilis prevalence
estimates for all countries with available data for the periods 1990
–
1999 and 2008. We
assessed if there was a correlation between national syphilis prevalence in these periods
and five explanatory factors. Only residence in sub-Saharan Africa was associated with
syphilis prevalence in both time periods. These findings, considered in conjunction with
other types of evidence we review, such as the strong correlations at population level
between syphilis prevalence and those of Herpes Simplex Virus-2 prevalence and HIV
prevalence, suggest that common risk factors may underpin the spread of all three of these
sexually transmitted diseases. Establishing what these factors are is of great importance to
improve the health of highly affected populations such as those in sub-Saharan Africa.
Introduction
Can a meaningful pattern be discerned in the large variations in syphilis rates over the last
cen-tury? A first step toward answering this question is the mapping of syphilis rates across time
and place followed by correlation analyses with possible explanatory variables [
1
]. Numerous
papers have published descriptions of longitudinal changes in reported cases of syphilis within
countries that are associated with events such as the introduction of penicillin, social disruption
associated with wars or the collapse of the Soviet Union [
2
,
3
]. Other analyses have investigated
reasons for the higher incidence in subpopulations such as men who have sex with men
(MSM) [
4
] and non-Hispanic blacks in the United States of America (USA) [
5
]. The World
Health Organization (WHO) and others have published estimates of world regional syphilis
prevalence for 1998, 2001, 2005 and 2012 [
6
–
9
] and national estimates of antenatal syphilis
prevalence for 2008 [
10
].
introduction of the syndromic approach to STI management [
11
] and in part due to the effect
of AIDS mortality breaking up sexual networks [
12
–
15
]. As a result, correlation analyses of risk
factors associated with national ASP from 1990
–
1999 would be less likely to be affected by this
effect of AIDS mortality than those from 2008. Thirdly, we use the 1990
–
99 and 2008 national
ASP estimates to assess if four risk factors, efficacy of syphilis screening/treatment, health
expenditure, GDP per capita and circumcision prevalence, are correlated with ASP in these
two time periods.
Accurate mapping requires a measure of syphilis that can be meaningfully used to compare
syphilis rates between populations. The number of cases of early stage syphilis per year
reported as part of national surveillance programs (case-reporting-based syphilis incidence
—
CSI) is a commonly used variable and has been shown to be useful to compare syphilis trends
over time within countries [
3
]. Case reporting is however beset by numerous problems: many
cases of syphilis are asymptomatic [
6
,
16
], health seeking behavior varies between locales [
17
]
and the completeness of reporting varies tremendously between different types of institutions
[
18
], regions within countries [
18
] and between countries. A twenty four country study from
Europe found that syphilis case surveillance coverage varied from below 10% to over 75% in
these developed countries [
19
]. In addition, there are considerable differences in how sexually
transmitted illnesses (STIs) are classified (such as syndromically or etiologically) [
6
] and in the
accuracy of diagnosis of syphilis when the etiological system is used [
15
,
20
].
As a result, the CSI indicator is suboptimal for comparing syphilis rates between
popula-tions [
10
,
17
,
21
,
22
]. The WHO has suggested that it should continue to be used to provide
minimum estimates of incidence in low prevalence countries [
6
]. In 1960, Guthe noted the
deficiencies of CSI and proposed that
“
the most useful index of the prevalence of syphilis in a
population is
—
for obvious reasons
—
the sero-reactor rate in pregnant women [
21
].
”
The
WHO has recommended the use of ASP as an indicator of syphilis prevalence in high
preva-lence countries [
6
]. In this paper we take up this suggestion to use antenatal syphilis prevalence
(ASP)
—
the serologically determined prevalence of syphilis in antenatal populations
—
to
fur-ther describe the global epidemiology of syphilis.
Methods
Systematic review: longitudinal changes in ASP in 13 populations
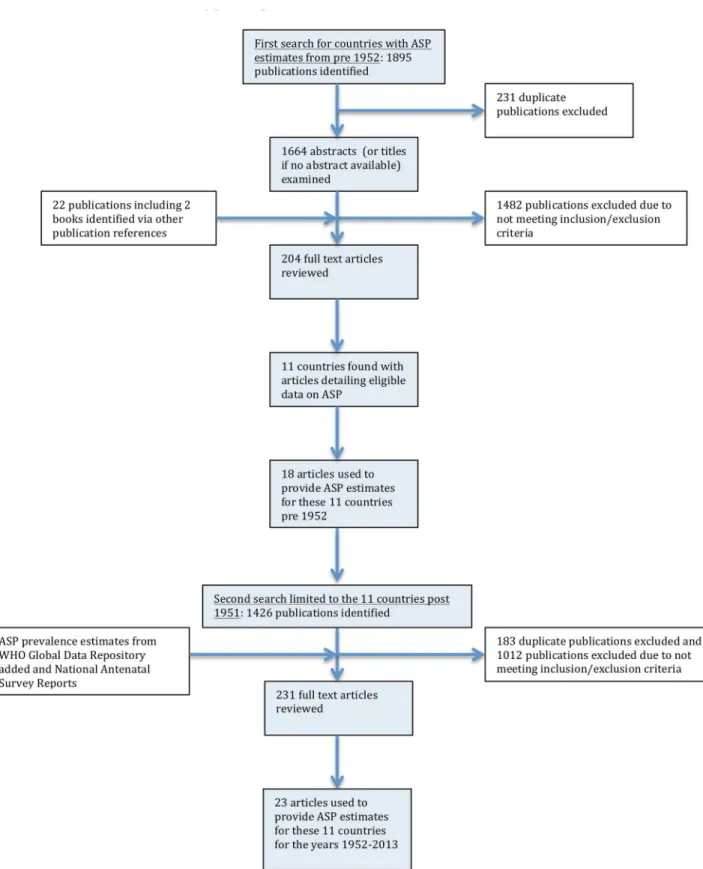
Search strategy and selection criteria.
The search was conducted in two stages (
Fig 1
):
i) In the first stage we sought to find as many countries as possible with published ASP
esti-mates from pre- 1952. We conducted a literature review using PUBMED and Google Scholar
to find countries with sufficient ASP data from any time from 1951 or before until the present.
The 1951 cutoff was chosen as a compromise between being relatively early in the penicillin
period and late enough to include a sufficient sample size of populations. MeSH terms used in
the PubMed search (search date: 10/09/2015) were
‘‘
prevalence
”
, OR
‘‘
incidence
”
, OR
‘‘
antena-tal
”
OR
‘‘
pregnancy
”
, OR
‘‘
pregnant
”
; AND:
‘‘
syphilis
”
, OR
‘‘
treponema pallidum
”
; filters:
pub-lication date from 01/01/1915 until 30/12/1960. Similar search terms were used for the Google
Scholar search (search date: 15/09/2015).
Fig 1. Flow chart showing selection of publications from the literature search for antenatal syphilis prevalence estimates.
1895 articles were identified and 204 articles reviewed, 11 countries were identified as
pro-viding eligible ASP from pre-1952. Three countries were from Asia (India, Japan, Singapore),
two from Africa (South Africa- SA, Zimbabwe), two from North America (Canada, United
States of America- USA) and four from Europe (Denmark, Finland, Norway, the United
King-dom
—
UK).
ii) In the second stage the search was directed at finding all ASP estimates for these
coun-tries between 1952 and 2015. We used the same search terms as above but with the new dates
as limits and the searches limited to these 11 countries. The searches were conducted on
PubMed (search date: 29/09/2015) and Google scholar (search date: 30/09/2015). This search
strategy provided us with 23 articles with ASP estimates for these countries post- 1951.
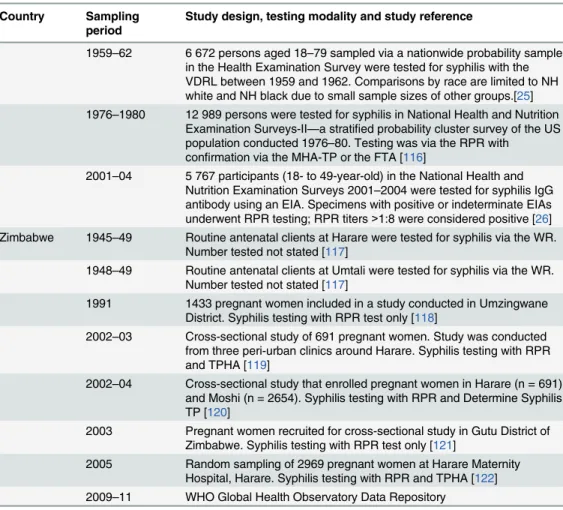
In the case of the USA and SA the results are reported separately by race. This is justified by
the large variations in syphilis prevalence between races in these countries and the strong
ten-dency to racially homophilous sexual partnering found in these countries [
23
,
24
]. In each case
the comparisons are limited to blacks and whites. Other groups are excluded for a number of
reasons including small sample sizes and in the case of Hispanics in the USA, the different
ways the
‘
Hispanics
’
category is defined in different surveys [
25
–
27
].
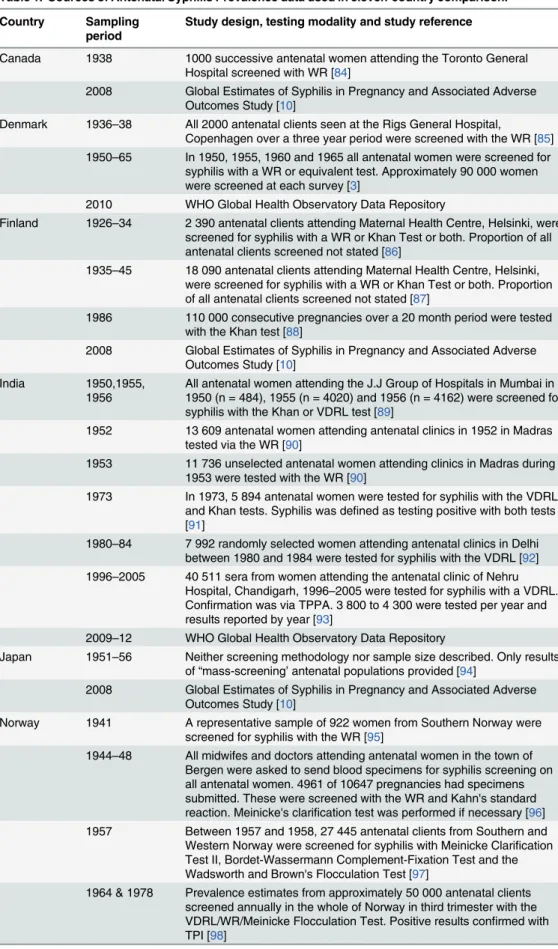
In both stages of the search, prevalence that was weighted or adjusted to account for
selec-tion bias was used where reported. Whenever possible we used ASP that was determined via
both a treponemal and nontreponemal test. If this was not possible we report the ASP
ascer-tained via the treponemal or nontreponemal and specify the testing type used (
Table 1
). In
addition to the ASP estimates we included three prevalence estimates of syphilis prevalence for
women by race for the USA from three waves of the National Health and Nutrition
Examina-tion Surveys. These surveys are designed to provide naExamina-tionally representative samples.
The changes in ASP over time in each population were depicted graphically. A summary of
the study characteristics used to provide these prevalence estimates is given in
Table 1
.
National and regional variations in ASP in 1990
–
1999 and 2008
National ASP.
1990
–
1999. National antenatal syphilis prevalence estimates for 1990 to
1999 were taken from an Institute for Health Metrics and Evaluation (IHME) database on the
prevalence of syphilis in low risk populations compiled for the Global Burden of Diseases
(GBD) study [
28
]. The IHME data sources included UNAIDS epidemiologic fact sheets,
UNGASS country progress reports, reports from country specific surveillance systems, WHO
reports on syphilis epidemiology, and data from correspondence with GBD collaborators.
These were supplemented by a systematic literature review of syphilis seroprevalence (most
recent PubMed search was October 2011). To be included, a study needed to provide data on
the prevalence of syphilis in populations considered representative of the general population
and have a sample size of at least 100. Data from high-risk populations (e.g. sex workers and
STI clinic attendees) were excluded [
6
,
28
–
32
].
For each country we extracted the studies conducted in antenatal populations between 1990
and 1999 and used the median of these studies as a measure of the national prevalence of
ante-natal syphilis.
2008. ASP for 2008
–
2009 were taken from a review article on the prevalence on ASP
con-ducted by the WHO and others [
10
]. In brief, data on syphilis seropositivity among ANC
attend-ees for each country were taken from the WHO HIV Universal Access reporting system for 2008.
If 2008 data were not available, then 2009 data was used. 97 of 193 countries had data available.
Table 1. Sources of Antenatal Syphilis Prevalence data used in eleven-country comparison.
Country Sampling period
Study design, testing modality and study reference
Canada 1938 1000 successive antenatal women attending the Toronto General Hospital screened with WR [84]
2008 Global Estimates of Syphilis in Pregnancy and Associated Adverse Outcomes Study [10]
Denmark 1936–38 All 2000 antenatal clients seen at the Rigs General Hospital,
Copenhagen over a three year period were screened with the WR [85] 1950–65 In 1950, 1955, 1960 and 1965 all antenatal women were screened for
syphilis with a WR or equivalent test. Approximately 90 000 women were screened at each survey [3]
2010 WHO Global Health Observatory Data Repository
Finland 1926–34 2 390 antenatal clients attending Maternal Health Centre, Helsinki, were screened for syphilis with a WR or Khan Test or both. Proportion of all antenatal clients screened not stated [86]
1935–45 18 090 antenatal clients attending Maternal Health Centre, Helsinki, were screened for syphilis with a WR or Khan Test or both. Proportion of all antenatal clients screened not stated [87]
1986 110 000 consecutive pregnancies over a 20 month period were tested with the Khan test [88]
2008 Global Estimates of Syphilis in Pregnancy and Associated Adverse Outcomes Study [10]
India 1950,1955,
1956
All antenatal women attending the J.J Group of Hospitals in Mumbai in 1950 (n = 484), 1955 (n = 4020) and 1956 (n = 4162) were screened for syphilis with the Khan or VDRL test [89]
1952 13 609 antenatal women attending antenatal clinics in 1952 in Madras tested via the WR [90]
1953 11 736 unselected antenatal women attending clinics in Madras during 1953 were tested with the WR [90]
1973 In 1973, 5 894 antenatal women were tested for syphilis with the VDRL and Khan tests. Syphilis was defined as testing positive with both tests [91]
1980–84 7 992 randomly selected women attending antenatal clinics in Delhi between 1980 and 1984 were tested for syphilis with the VDRL [92] 1996–2005 40 511 sera from women attending the antenatal clinic of Nehru
Hospital, Chandigarh, 1996–2005 were tested for syphilis with a VDRL. Confirmation was via TPPA. 3 800 to 4 300 were tested per year and results reported by year [93]
2009–12 WHO Global Health Observatory Data Repository
Japan 1951–56 Neither screening methodology nor sample size described. Only results of“mass-screening’antenatal populations provided [94]
2008 Global Estimates of Syphilis in Pregnancy and Associated Adverse Outcomes Study [10]
Norway 1941 A representative sample of 922 women from Southern Norway were screened for syphilis with the WR [95]
1944–48 All midwifes and doctors attending antenatal women in the town of Bergen were asked to send blood specimens for syphilis screening on all antenatal women. 4961 of 10647 pregnancies had specimens submitted. These were screened with the WR and Kahn's standard reaction. Meinicke's clarification test was performed if necessary [96] 1957 Between 1957 and 1958, 27 445 antenatal clients from Southern and
Western Norway were screened for syphilis with Meinicke Clarification Test II, Bordet-Wassermann Complement-Fixation Test and the Wadsworth and Brown's Flocculation Test [97]
1964 & 1978 Prevalence estimates from approximately 50 000 antenatal clients screened annually in the whole of Norway in third trimester with the VDRL/WR/Meinicke Flocculation Test. Positive results confirmed with TPI [98]
Table 1. (Continued)
Country Sampling period
Study design, testing modality and study reference
2008 Global Estimates of Syphilis in Pregnancy and Associated Adverse Outcomes Study [10]
Singapore 1951–58 Antenatal cases seen at suburban and rural maternity clinics were tested for syphilis with the WR. Results are reported by year for 1951–
58. Between 1 363 and 11 448 women were tested per year [99] 1974 Antenatal women tested for syphilis with RPR and confirmed with
TPHA. Sample size not stated [100]
South Africa 1938–1946 Kark reviewed South African syphilis prevalence in different populations for the period 1921–1946. 8 studies were performed exclusively in black antenatal populations between the years 1938 and 1946. All used a WR to estimate syphilis prevalence. We used the median ASP from these studies for the 1942 black ASP (Median 29.7, IQR 19.5–38, Range 11.4–40.5) [73]
1949–1971 254 137 antenatal black women screened for syphilis with the WR at 6 clinics in Soweto, between 1949 and 1971. Results are reported per year. 3 795 to 15 583 women were tested per year [101]
1991 & 1998–
2011
In 1991 and from 1998–2011, South Africa included testing for syphilis in its annual antenatal HIV surveys. The methodology of these surveys has been described in detail elsewhere [102–107]. In summary, public sector antenatal clinics were sampled on a probability proportional-to-size basis and women attending these clinics for thefirst visit of their pregnancy were tested for syphilis using a RPR test. No confirmatory testing with treponemal-specific assays was conducted. Only in the 1991 survey were results presented broken down by race
1972 2 495 unselected antenatal women (2 056 coloureds, 232 blacks, 201 whites) from Cape Town were tested with WR or RPR and confirmed with FTA. [108]
United Kingdom
1922 Wasserman reaction test was performed on 1 881 consecutive admissions to a maternity hospital in Glasgow in 1922 [109]
1944–49 71 645 antenatal samples tested via the Wasserman reaction test [110] 1953–59 Syphilis prevalence in antenatal women taken from 6 regions in
England and Wales provided by the Department of Health. Figures are provided for each year and involved the testing of between 28 263 and 56 962 women per year [111]
1959–68 42 404 antenatal women seen at Queen Charlotte’s Hospital, London, between 1959 and 1968 tested with VDRL. All positives confirmed with TPI or FTA [112]
1969–71 64 404 antenatal women tested for syphilis in Glasgow laboratories between 1969 and 1971 with WR or VDRL and confirmed by TPI or FTA [113]
1983–87 76 519 antenatal women screened for syphilis in the Oxford region between 1983 and 1987. Tested with TPHA [114]
1996–2010 WHO Global Health Observatory Data Repository
USA 1937–38 The charts of all pregnant women between 1937–38 in the District of Baltimore had their charts reviewed to see if they had a serological test for syphilis (1335 whites and 668 blacks). In 46.7% of whites and 7.6% of blacks no test was performed [115]. ASP is defined as the percent of those with a positive serological test (WR or equivalent) out of all women who were registered pregnant that year
1939–40 The charts of all pregnant women between 1939–40 in the District of Baltimore had their charts reviewed to see if they had a serological test for syphilis (1264 whites and 698 blacks). In 28.9% of whites and 6.8% of blacks no test was performed [115]. ASP is defined as the percent of those with a positive serological test out of all women who were registered pregnant that year
Case-reporting-based syphilis incidence (CSI)
We used various sources to obtain the number of cases of acquired syphilis per 100 000 per
year for 8 of the 11 reviewed countries with available published data from surveillance data.
Much of the SA and USA surveillance data was not disaggregated by race and thus we report
both the overall national incidence and the more limited data available for the black and white
racial groups in these countries. Details of the sources of data are provided in
Table 2
.
Associations with ASP
Syphilis treatment efficacy.
We used two proxy variables as measures of a country
’
s
syph-ilis screening/treatment efficacy:
1. Health expenditure. The per capita total expenditure on health (purchasing power parity
in US$) for 1990 and 2000 were used for the 1990
–
1999 and 2008 analyses respectively.
Table 1. (Continued)
Country Sampling period
Study design, testing modality and study reference
1959–62 6 672 persons aged 18–79 sampled via a nationwide probability sample in the Health Examination Survey were tested for syphilis with the VDRL between 1959 and 1962. Comparisons by race are limited to NH white and NH black due to small sample sizes of other groups.[25] 1976–1980 12 989 persons were tested for syphilis in National Health and Nutrition
Examination Surveys-II—a stratified probability cluster survey of the US population conducted 1976–80. Testing was via the RPR with
confirmation via the MHA-TP or the FTA [116]
2001–04 5 767 participants (18- to 49-year-old) in the National Health and Nutrition Examination Surveys 2001–2004 were tested for syphilis IgG antibody using an EIA. Specimens with positive or indeterminate EIAs underwent RPR testing; RPR titers>1:8 were considered positive [26] Zimbabwe 1945–49 Routine antenatal clients at Harare were tested for syphilis via the WR.
Number tested not stated [117]
1948–49 Routine antenatal clients at Umtali were tested for syphilis via the WR. Number tested not stated [117]
1991 1433 pregnant women included in a study conducted in Umzingwane District. Syphilis testing with RPR test only [118]
2002–03 Cross-sectional study of 691 pregnant women. Study was conducted from three peri-urban clinics around Harare. Syphilis testing with RPR and TPHA [119]
2002–04 Cross-sectional study that enrolled pregnant women in Harare (n = 691) and Moshi (n = 2654). Syphilis testing with RPR and Determine Syphilis TP [120]
2003 Pregnant women recruited for cross-sectional study in Gutu District of Zimbabwe. Syphilis testing with RPR test only [121]
2005 Random sampling of 2969 pregnant women at Harare Maternity Hospital, Harare. Syphilis testing with RPR and TPHA [122] 2009–11 WHO Global Health Observatory Data Repository
Abbreviations: EIA—Enzyme Immuno Assay, FTA—Fluorescent Treponemal Antibody test, MHA-TP—
Microhemagglutination Assay for Treponema Pallidum, RPR—Rapid Plasma Reagin, TPI—Treponema Pallidum Immobilization Assay, TPHA—Treponema Pallidum Hemaglutination Assay, WR—Wasserman Reaction, VDRL—Venereal Diseases Research Laboratory, MHA-TP—Microhemagglutination Assay for Treponema Pallidum
Table 2. Sources of data for incidence of syphilis as ascertained by number of cases reported to cen-tral authorities (all reported per 100,000 population per year).
Country Sampling period
Reporting mechanism, stage of syphilis reported and study reference
Canada 1935 National incidence calculated by aggregating all provincial reports which are comprised of all cases of syphilis reported by private and state institutions [123]
1944–1955 As of 1944 Canada commenced a national reporting system for all cases of syphilis. Figure provided is the annual reported rate of all acquired syphilis per 100 000 [124]
1996 & 2003–
2012
All cases of syphilis according to national reporting system [125] Denmark 1915–51 All cases of acquired syphilis reported to national reporting system [126]
1952–65 All cases of primary, secondary and early latent syphilis reported to national reporting system [3]
All cases of acquired syphilis reported to national reporting system [127,128]
Japan 1947–56 Total number of acquired syphilis cases reported per annum to the Department of Health [94]
Norway 1915–51 All cases of acquired syphilis reported to national reporting system [126] 2006–2009 All cases of acquired syphilis reported to national reporting system
[127,128]
Singapore 1927–1955 All cases of primary, secondary syphilis reported to Ministry of Health by Social Hygiene Clinics [99]
1974–84 All cases of primary, secondary and early latent syphilis reported to Ministry of Health [129]
South Africa 1939 All cases of acquired syphilis in the Cape Town magisterial district reported to the Medical Officer of Health for the year 1939. Incidencefigures per 100 000 population are calculated separately for whites and blacks [72] 1937–39 Cases of all stages of acquired syphilis reported to ten Magisterial Medical
Officers of Health. Incidence per 100 000 were as follows: Johannesburg–
691, Cape Town–851, Pretoria–1645, Springs–1474, Germiston–4028, Benoni–1167, Kimberly–1854, Bloemfontein–1004, Pietermaritzburg–
1337, Vereeniging–1648; median value of 1474 used as syphilis incidence estimate for 1938 [130]
1943 Cases of all stages of syphilis in workforce of Gold Mining companies [131] 1946 Cases of all stages of syphilis in workforce of Gold Mining companies [131] 1999 Estimated incidence of all cases of acquired syphilis for 1999 based on
reported prevalencefigures. Median prevalence rates were derived from published data generated by the Sexually Transmitted Infections Reference Centre (STIRC) and other research centres to cover as comprehensively as possible the whole country. Appropriate adjustments for differences in the prevalence of STIs were made for age (e.g. lower prevalence rates for 35–
49 year age group), population groups and geographical regions (e.g. urban vs. rural) and gender (e.g. female infections more common) [132].
United Kingdom
1902–1950 Numbers of new diagnoses of syphilis (primary, secondary and early latent) reported in England, Wales and Scotland [133]
1990–2012 All cases of acquired syphilis reported to national reporting system [127,128]
USA 1937–38 Rates of primary and secondary syphilis reported to CDC broken down into incidencefigures for whites and blacks in 1981, 1990 and 1993. Thefigures for 1956 and 1969 are only broken down by white versus non white (PS syphilis per 100 000 in 1956: white–1.6 and nonwhite 22.5; 1969: white–
3.3 and nonwhite–54.4) [5]
1941–2008 Data provided by CDC for total number of syphilis cases in all population groups (http://www.cdc.gov/std/stats08/tables/1.htm)
2. Antenatal clients screened/treated for syphilis. The percent of antenatal care attendees
tested for syphilis at their first antenatal visit multiplied by the percent of those who tested
positive who received appropriate therapy for syphilis. Where data was missing for percent
receiving therapy we used regional medians. The data for these two variables was only
able from 2006 until 2013. For each country, we used data from the first year data was
avail-able. The health expenditure and antenatal screening and therapy indicators were taken
from the WHO Global Health Observatory Data Repository (
http://apps.who.int/gho/data/
node.main.A1358STI?lang=en
).
GDP per capita.
To control for economic development we use Gross Domestic Product
(GDP) per capita (US$ Purchasing Power Parity). We use the GDP from 1995 for the 1990
–
1999 analysis and 2005 for 2008 analyses. The data for these variables are taken from the
Human Development Reports [
33
,
34
].
Circumcision.
The national prevalence rates of male circumcision as of December 2006
were taken from a World Health Organization and Joint United Nations Programme on HIV/
AIDS publication. These estimates were based on Demographic and Health Survey data or
from other published sources [
35
]. Countries were classified as having circumcision prevalence
rates
<
20%, 20
–
80% or
>
80%.
World regions.
WHO world regional variables were included to test for regional
differ-ences in ASP [
6
].
Statistical analysis
Box 1. A brief historical overview of the serological diagnostic tests
used to assess syphilis and their diagnostic accuracy
Diagnostic tests
Serologic testing is the most important modality used to make the diagnosis of syphilis.
The serological tests for syphilis come in two categories:
•
Nontreponemal tests (NTT) that do not directly detect antibodies to
T
.
pallidum
but
rather reactions to the inflammation that
T
.
pallidum
infection produces. In general
these tests reflect the activity of the infection and are used to monitor response to
ther-apy. Examples of nontreponemal tests include: Wasserman reaction (WR), Kahn Test
(KT), Venereal Disease Research Laboratory (VDRL), Rapid Plasma Reagin (RPR) and
the Toluidine Red Unheated Serum Test (TRUST).
•
Specific treponemal tests (TT) detect antibodies to specific
T
.
pallidum
antigens or
col-lections of antigens. Examples of these tests include: Microhemagglutination test for
antibodies to
T
.
pallidum
(MHA-TP), Fluorescent treponemal antibody absorption
(FTA-ABS),
T
.
pallidum
particle agglutination assay (TP-PA) and the
T
.
pallidum
enzyme immunoassay (TP-EIA).
A complement-fixation-based test, the Wasserman reaction was the first serological
test used in the diagnosis of syphilis [
77
]. The antigens used in the test were originally
derived from tissue extracts of livers from infants who died of presumed syphilis.
Subse-quently a bovine heart extract was used and to this day remains the basis of the source of
the cardiolipin used in this test [
78
]. A significant problem with the early NTTs was the
high rate of false positives they produced [
79
]. In order to improve the specificity of
these tests cholesterol and lecithin were added [
78
]. The complement-fixation-based
tests were difficult to perform and time consuming and thus Kahn
’
s development of a
flocculation test without complement that could be completed within a few hours
repre-sented a major advance [
80
]. The resultant Kahn Test (KT) was modified in a number of
subsequent NTTs but all these tests suffered from the lack of a standardized antigen [
80
].
It was only in 1941 that a way was found to precipitate cardiolipin from bovine hearts in
a manner that made standardization possible [
80
]. This in turn paved the way for the
development of microflocculation tests such as the VDRL in 1946 which yielded more
reproducible results than preceding tests [
81
]. The RPR, which was developed in the
1950s, incorporated charcoal microparticles into the reagent to facilitate reading the test
[
78
]. The toluidine red unheated serum test (TRUST) and other NTTs represented
fur-ther modifications of the RPR. Most recently a range of automated enzyme
immunoas-says and chemiluminescene asimmunoas-says have been developed with good diagnostic accuracy
(
Table 3
) [
82
].
Testing algorithms
Results
Longitudinal changes in ASP in 13 populations
ASP declined in all populations assessed in this period (
Fig 2
) but at different times and rates. In
the case of Canada, Denmark, Finland, Norway and whites in the USA, ASP dropped to below
1% before 1945 when penicillin started to become widely available. We found no data points for
the UK between 1922 and 1947 but by 1947 its ASP had declined to 0.4%. By 1955 ASP in
Singa-pore and Japan had declined to below 2%. There was little data available for whites in SA but in
a small sample in 1972, prevalence was 2.5% and at the time of the first large sample (1991) ASP
was under 1%. ASP declined somewhat more slowly in India (1.6% in 1973 and 0.1% in 1982),
and USA blacks (3.4% in 1978 and 4.2% in 2001). In Zimbabwe and black South Africans, ASP
was high in the pre penicillin period, dropped in the post-penicillin period but then plateaued at
around 6% until the end of the 20th century when ASP dropped precipitously to just above 1%.
Syphilis case incidence (CSI)
Changes in incidence of reported cases of syphilis per year per 100 000 population were found
to be broadly commensurate with ASP figures (
Fig 3
and
Table 2
). Denmark, Norway and the
UK had low syphilis incidence prior to the introduction of penicillin. By 1939 all three
coun-tries had an incidence below 20. After brief increases during the Second World War, incidence
in these countries as well as Canada, Japan, Singapore and the USA (overall population)
declined rapidly in the post-war period. By 1956 the incidence in Denmark, Norway, Canada,
Japan, Singapore, UK and whites in the USA was below 30/100 000. Incidence in blacks in the
Table 3. Sensitivity and specificity of various treponemal and nontreponemal tests.Figures in parentheses refer to the range of sensitivities and speci-ficities found in the included studies (Table is based on data from [78] and [82]).
Sensitivity at various syphilis disease stages (%) Specificity (%)
Primary Secondary Early Latent Late Latent
Nontreponemal Tests
VDRL 78(74–87) 100 95(88–100) 71(37–94) 98(96–99)
RPR 86(77–100) 100 98(95–100) 73 98(93–99)
USR 80(72–88) 100 95(88–100) 99
TRUST 85(77–86) 100 98(95–100) 99(98–99)
Early Treponemal Tests
FTA-ABS 84(70–100) 100 100 96 97(94–100)
MHA-TP 76(69–90) 100 97(97–100) 94 99(98–100)
TPPA 88(86–100) 100 100 NA 96(95–100)
TPHA 86 100 100 99 96
Enzyme immunoassays
IgG ELISA 100 100 100 NA 100
IgM-EIA 93 85 64 NA NA
ICE 77 100 100 100 99
Immunochemiluminescence assays
CLIA 98 100 100 100 99
Abbreviations: CLIA, chemiluminescence assay; ELISA, enzyme-linked immunosorbent assay; EIA, enzyme immunoassay; FTA-ABS,fluorescent treponemal antibody absorption assay; ICE, immune-capture EIA; MHA-TP, microhemagglutination assay for Treponema pallidum; NA, not available; TPHA, T. pallidum hemagglutination assay; TPPA, T. pallidum particle agglutination; TRUST,toluidine red unheated serum test, USR, unheated serum regain; VDRL, Venereal Disease Research Laboratory.
USA remained approximately an order of magnitude greater than whites at all time points for
which we have data. Incidence in black South Africans in 1939 was five times higher than
whites. The median incidence in ten cities in South Africa (overall population) between 1937
and 1939 was 1474 (range 691
–
4028). This declined somewhat to an estimated 530 by 1999
and more precipitously after 1999 in keeping with the contemporaneous declines in ASP
[
15
,
37
]. Numbers of cases diagnosed with syphilis in Zimbabwe were high in all reports in the
20
thcentury [
38
–
41
] but we have not reported incidence as population denominators were not
provided and a number of expert reviews found evidence of both extensive misclassification of
chancroid as syphilis [
20
,
38
,
40
] and endemic treponemes causing false positive serological
diagnoses of syphilis [
40
].
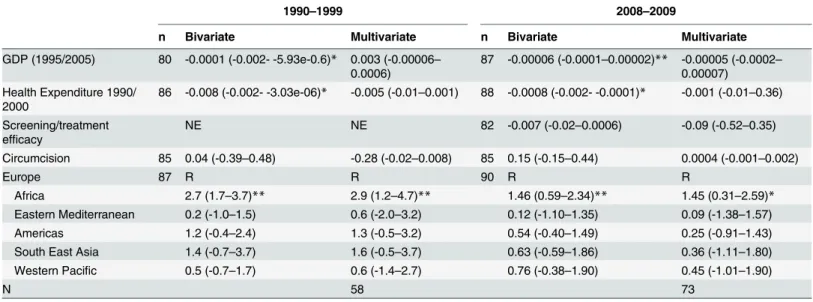
Risk factors associated with ASP
In both 1990
–
99 and 2008 on bivariate analyses, ASP was negatively associated with GDP per
capita, health expenditure and residence in sub- Saharan Africa (henceforth termed Africa;
Table 4
). On multivariate analysis in both time periods, ASP was only associated with residence
in Africa (
Table 5
). We found no evidence of an association between GDP per capita, health
expenditure, screening/treatment or circumcision prevalence and ASP.
Differences in national ASP in the two time periods are represented graphically in
Fig 4
.
Variations in regional ASP
By 1990
–
99, ASP had dropped to a median 3.0 (IQR 1.4
–
4.4) in Africa versus 0.1 (IQR 0.1
–
0.1)
in Europe, 0.4 (IQR 0.2
–
1.0) in the East Mediterranean, 0.4 (IQR 0.2
–
1.4), 0.6 (IQR 0.1
–
2.5) in
Fig 2. Changes in Antenatal Syphilis Prevalence in 13 populations between 1922–2012.
the Americas, 1.3 (IQR 0.7
–
1.7) in South/South Eastern Asia and in the Western Pacific. ASP
was statistically significantly higher in Africa in 1990
–
1999 than in the other world regions
except South/South East Asia where this relationship was not statistically significant (
Table 4
).
By the following decade the median prevalence of ASP had fallen in most regions including
Africa but Africa
’
s median ASP remain statistically significantly higher than the ASP in
Europe, Eastern Mediterranean and the Americas.
Fig 3. Changes in case based reported syphilis incidence (cases per 100 000) in nine populations between 1900–2012 (Inset syphilis incidence in Denmark and Norway).
doi:10.1371/journal.pntd.0004711.g003
Table 4. Median (interquartile range) adjusted antenatal syphilis prevalence for the six WHO world regions.Statistical comparisons are Kruskal-Wallis tests comparing adjusted median ASP in each region with that in sub-Saharan Africa.
Region n 1990–1999 n 2000–2009
Sub-Saharan Africa 33 3.01 (1.39–4.42) 35 1.48 (0.72–2.60)
Europe 14 0.09 (0.09–0.13)*** 11 0.08 (0.04–0.70)***
East Mediterranean 10 0.38 (0.16–0.95)*** 7 0.04 (0.00–0.71)**
Americas 12 0.59 (0.09–2.48)* 21 0.54 (0.35–0.93)*
South/South East Asia 6 1.25 (0.66–1.68) 7 0.40 (0.02–1.47)
Western Pacific 12 0.42 (0.20–1.35)** 9 0.21 (0.10–1.53)
*P<0.05,
**P<0.005,
***P<0.0005
Sensitivity analyses were conducted using the uncorrected ASPs. This did not alter the
bivariate and multivariate results.
Discussion
What determines the tremendous variation in syphilis prevalence around the world over the
past century? Our study provides no definitive answers but contributes some clues. Our 11
country longitudinal case study found that although syphilis prevalence declined in all
popula-tions investigated in the post-penicillin period, it did so to varying degrees and at different
times. In Canada, Denmark, Finland, Norway, UK and USA whites, ASP declined to low levels
prior to the introduction of penicillin. It could be argued that this was due in part to earlier and
better access to efficacious therapies such as salvarsan which had been available since 1909
Table 5. Bivariate and multivariate regression analyses of the relationship between adjusted national antenatal syphilis prevalence and putative risk factors including regional dummies.Beta-coefficients (95% Confidence Intervals).
1990–1999 2008–2009
n Bivariate Multivariate n Bivariate Multivariate
GDP (1995/2005) 80 -0.0001 (-0.002- -5.93e-0.6)* 0.003 (-0.00006–
0.0006)
87 -0.00006 (-0.0001–0.00002)** -0.00005 (-0.0002–
0.00007) Health Expenditure 1990/
2000
86 -0.008 (-0.002- -3.03e-06)* -0.005 (-0.01–0.001) 88 -0.0008 (-0.002- -0.0001)* -0.001 (-0.01–0.36)
Screening/treatment efficacy
NE NE 82 -0.007 (-0.02–0.0006) -0.09 (-0.52–0.35)
Circumcision 85 0.04 (-0.39–0.48) -0.28 (-0.02–0.008) 85 0.15 (-0.15–0.44) 0.0004 (-0.001–0.002)
Europe 87 R R 90 R R
Africa 2.7 (1.7–3.7)** 2.9 (1.2–4.7)** 1.46 (0.59–2.34)** 1.45 (0.31–2.59)*
Eastern Mediterranean 0.2 (-1.0–1.5) 0.6 (-2.0–3.2) 0.12 (-1.10–1.35) 0.09 (-1.38–1.57)
Americas 1.2 (-0.4–2.4) 1.3 (-0.5–3.2) 0.54 (-0.40–1.49) 0.25 (-0.91–1.43)
South East Asia 1.4 (-0.7–3.7) 1.6 (-0.5–3.7) 0.63 (-0.59–1.86) 0.36 (-1.11–1.80)
Western Pacific 0.5 (-0.7–1.7) 0.6 (-1.4–2.7) 0.76 (-0.38–1.90) 0.45 (-1.01–1.90)
N 58 73
*P<0.05, **P<0.05
NE—Not entered
n refers to number of observations in the bivariate analyses doi:10.1371/journal.pntd.0004711.t005
Fig 4. Antenatal syphilis prevalence by country in 1990–99 (A) and 2008 (B).
[
42
,
43
]. It is however striking how much lower ASP was in these populations in the pre-
peni-cillin period than they were in South Africa and Zimbabwe 50 years into the penipeni-cillin period.
The data from CSI shows a similar pattern. When plotted by themselves the
case-based-reporting epidemic curves of countries like Denmark and Norway reveal dramatic changes in
syphilis incidence coinciding with the two world wars and the introduction of penicillin (
Fig
3
, inset [
3
]). However, when plotted on the same axes as the high ASP populations these
fluc-tuations are dwarfed by the large difference in prevalence between high and low prevalence
populations. We have only data available for 11 countries and thus should be careful about
the conclusions we draw from this small dataset. The data is however broadly commensurate
with other sources. For example, although our case study contained only two countries from
Africa, a review of longitudinal changes in ASP from 11 Southern and Eastern African
coun-tries from the pre-AIDS period found ASP in the same range (median ASP 10%; Interquartile
range, 6.5
–
11.5% [
44
]) as those found for Zimbabwe and black South Africans from the same
period reported in the current study. Our findings are also commensurate with those from a
review conducted by the WHO for the years 1945 to 1958, which found that the incidence of
syphilis declined in all regions of the world excluding Africa [
21
]. This review was based on
reported cases of syphilis per year. As noted above, this indicator is a far from optimal marker
of syphilis incidence. Using ASP data, our review of the global epidemiology of syphilis comes
to a similar conclusion: the decline in ASP was slowest in Africa. Other non-African low and
middle-income countries (LMICs) such as India and Singapore (which was a middle income
country in the 1950s [
45
]) experienced a more rapid decline in ASP. The syphilis prevalence
in both 1990
–
99 and 2008 was significantly higher in Africa than most other regions. This
finding remained after controlling for GDP, health expenditure, syphilis testing/treating and
circumcision.
The reason why ASP was not uniformly raised in LMICs but predominantly in Africa
requires further research. The fact that the global distribution of syphilis is similar to that of
HIV and Herpes Simplex Virus-2 (HSV-2) may be instructive [
32
,
46
–
48
]. All three STIs have
been found to be more prevalent in Africa than elsewhere [
48
,
49
]. In studies that used the
same national ASP data in 1990
–
99 as those used here, ASP was found to be closely correlated
with both HSV-2 prevalence in 1990
–
99 [
47
] and subsequent peak HIV prevalence [
32
].
Whilst the association of HIV and syphilis could conceivably be due to syphilis enhancing the
transmission of HIV this cannot easily explain the association between HSV-2 and syphilis
—
HSV-2 and syphilis have not been shown to influence the prevalence of one another. The
asso-ciation between these two is thus likely due to a common factor driving both STIs. The fact
that HSV-2 prevalence should not be influenced by STI treatment capacity makes it less likely
that this common factor is STI treatment capacity.
include differential access to appropriate health care [
59
], usage of barrier contraception [
60
],
the presence or absence of social disruption and other socio-economic factors such as the
extent of social capital and the degree of economic inequality [
59
,
61
,
62
].
There are numerous limitations of this study, including the poor quality of much the data
used in this study. There is a paucity of population-based samples of ASP from prior to the
1990
’
s. Our linear regression analyses are compromised by the low number of data points for
both ASP and the independent variables that were available from the 1980s and 1990s. Our
measures of syphilis treatment efficacy are far from optimal but were the best we could find
sufficient data for. In addition, they are similar to WHO estimates for the proportion of all
per-sons with symptomatic primary and secondary syphilis in 1995 who received appropriate
ther-apy as determined by WHO estimates [
8
]. According to these estimates this proportion varied
between 0.35 in Africa and South/South East Asia, 0.6 in East Asia, Latin America, East Europe,
the Middle East and 0.85 in North America, Western Europe and Australasia. They are also
close to 2008 estimates for the proportion of all ANC attendees who are tested and treated for
syphilis according to the study by Cal Ham
et al
[
36
] (Africa and Eastern Mediterranean, 0.3;
South/South East Asia, 0.4; Americas and Western Pacific, 0.6 and Europe 0.7). We were
unable to find sufficient comparable data on aspects of sexual behavioural and condom usage
data to be able to include these in our explanatory models. The use of ASP as a measure of
syphilis prevalence has three major limitations. Firstly, there is a paucity of published large
sur-veys of ASP particularly from the early period of this study [
63
]. Secondly, there are a number
of different tests and different testing algorithms for the diagnosis of syphilis, each of which is
susceptible to differing rates of false positive and negative results. In countries where conditions
such as the endemic trepanematoses are endemic a large proportion of positive results may
then be false positives [
64
] since these give positive syphilis test results. Thirdly, antenatal
pop-ulations differ systematically from general poppop-ulations in a number of ways [
36
,
65
]. An
exam-ple is that syphilis has been shown to impair fertility and thus ASPs may underestimate the
prevalence of syphilis in the general population [
66
]. Unlike syphilis, HIV prevalence estimates
from population surveys have been compared with those obtained from antenatal surveys. In
two countries where the HIV epidemic had stabilized (Uganda and Zimbabwe) the estimates
were found to be very similar [
65
,
67
] whereas in four other countries (Ethiopia, Kenya, Malawi,
Tanzania) the population estimates were lower than those from the antenatal surveys [
68
]. We
use two strategies to overcome the first two limitations.
Firstly, for the cross-country quantitative comparative analyses we limit the analyses to the
periods 1990
–
1999 and 2008. This has three advantages. (1) By the 1990s the endemic
trepo-nemes had been eradicated from most of the world
’
s populations [
69
,
70
]. (2) The syphilis tests
and testing algorithms used in this period resulted in fewer false positive results than those
used in earlier periods [
36
]. (3) There is also better ASP data available for this time period than
earlier periods [
10
]. Secondly, we conduct sensitivity analyses that correct for the type of
syphi-lis testing algorithm used.
Finally, we do not include uncertainty estimates of our ASP or CSI data and we do not control
for differences in age structures of the sampled populations.
Conclusion
By 1959, 600 tons of penicillin were being produced per year and there is little doubt that its
widespread use played an important role in the decline of syphilis rates [
21
]. However, ASP in
certain populations around the world exhibited more resilience in response to the introduction
of penicillin and associated syphilis control strategies. The populations that in the 1990
’
s had
high prevalences of syphilis and HSV-2 went on to have high HIV prevalences [
52
]. Although
this analysis suffers from numerous limitations, if taken in conjunction with the other evidence
reviewed here it generates the hypothesis that more connected sexual networks may have been
partly responsible for the higher prevalences of syphilis and other STIs in high prevalence
pop-ulations. High AIDS related mortality has been shown in both MSM in the USA and the
gener-alized HIV epidemics of Africa to have disrupted sexual networks and thereby reduced the
prevalence of syphilis [
12
–
14
]. It is possible that the widespread use of antiretroviral therapy
may be followed by the reconstitution of more connected sexual networks and a return of
syphilis in these populations
—
as has occurred in MSM in the USA and elsewhere [
76
]. An
improved understanding of the factors underpinning variations in syphilis rates around the
world in the last 100 years could help us to better understand the current and predict the future
patterning of syphilis prevalence.
Supporting Information
S1 Table. PRISMA checklist.
(DOC)
Acknowledgments
We would like to thank the Institute for Health Metrics and Evaluation for use of the 1990
–
99
syphilis prevalence dataset and Anne Buvé for helpful comments on an earlier draft of this
manuscript.
Author Contributions
Conceived and designed the experiments: CRK. Performed the experiments: CRK KO AT.
Analyzed the data: CRK KO AT. Contributed reagents/materials/analysis tools: CRK KO AT.
Wrote the paper: CRK.
References
1. Reingold AL (1998) Outbreak investigations-a perspective. Emerg Infect Dis 4: 21. PMID:9452395
2. Herbert LJ, Middleton SI (2012) An estimate of syphilis incidence in Eastern Europe. J Glob Health 2: 010402. doi:10.7189/jogh.02.010402PMID:23198131
3. Idsoe O, Guthe T (1967) The rise and fall of the treponematoses. I. Ecological aspects and interna-tional trends. in venereal syphilis. Br J Vener Dis 43: 227–243. PMID:5582624
4. Fenton KA, Imrie J (2005) Increasing rates of sexually transmitted diseases in homosexual men in Western europe and the United States: why? Infectious disease clinics of North America 19: 311–
331. PMID:15963874
5. Nakashima AK, Rolfs RT, Flock ML, Kilmarx P, Greenspan JR (1996) Epidemiology of syphilis in the United States, 1941–1993. Sex Transm Dis 23: 16–23. PMID:8801638
7. World Health Organization (1995) Global prevalence and incidence of selected curable Sexually Transmitted Diseases: Overview and estimates. Geneva: World Health Organization.
8. World Health Organization (2001) Global prevalence and incidence of selected curable Sexually Transmitted Diseases: Overview and estimates. Geneva: World Health Organization.
9. Newman L, Rowley J, Vander Hoorn S, Wijesooriya NS, Unemo M, Low N, et al. (2015) Global Esti-mates of the Prevalence and Incidence of Four Curable Sexually Transmitted Infections in 2012 Based on Systematic Review and Global Reporting. PLoS One 10: e0143304. doi:10.1371/journal. pone.0143304PMID:26646541
10. Newman L, Kamb M, Hawkes S, Gomez G, Say L, Seuc A, et al. (2013) Global estimates of syphilis in pregnancy and associated adverse outcomes: analysis of multinational antenatal surveillance data. PLoS Med 10: e1001396. doi:10.1371/journal.pmed.1001396PMID:23468598
11. Pettifor A, Walsh J, Wilkins V, Raghunathan P (2000) How effective is syndromic management of STDs?: A review of current studies. Sex Transm Dis 27: 371–385. PMID:10949428
12. Chesson HW, Dee TS, Aral SO (2003) AIDS mortality may have contributed to the decline in syphilis rates in the United States in the 1990s. Sexually Transmitted Diseases 30: 419–424. PMID: 12916133
13. Kenyon CR, Osbak K, Buyze J, Chico RM (2015) The changing relationship between bacterial STIs and HIV prevalence in South Africa—an ecological study. Int J STD AIDS 26: 556–564. doi:10.1177/ 0956462414546392PMID:25122576
14. Kenyon CR, Osbak K, Chico RM (2014) What underpins the decline in syphilis in Southern and East-ern Africa? An exploratory ecological analysis. Int J Infect Dis 29: 54–61. doi:10.1016/j.ijid.2014.05. 014PMID:25449236
15. Johnson LF, Dorrington RE, Bradshaw D, Coetzee DJ (2011) The effect of syndromic management interventions on the prevalence of sexually transmitted infections in South Africa. Sex Reprod Healthc 2: 13–20. doi:10.1016/j.srhc.2010.08.006PMID:21147454
16. Singh AE, Romanowski B (1999) Syphilis: review with emphasis on clinical, epidemiologic, and some biologic features. Clin Microbiol Rev 12: 187–209. PMID:10194456
17. Gerbase A, Rowley J, Heymann D, Berkley S, Piot P (1998) Global prevalence and incidence esti-mates of selected curable STDs. Sex Transm Infect 74: 12.
18. Greco D, Giuliani M, Suligoi B, Panatta M, Giannetti A (1990) Sexually transmitted diseases in Italy: clinical returns versus statutory notifications. Genitourin Med 66: 383–386. PMID:2245987
19. Lowndes CM, Fenton KA, European Surveillance of SsN (2004) Surveillance systems for STIs in the European Union: facing a changing epidemiology. Sex Transm Infect 80: 264–271. PMID:15295122
20. Willcox RR (1951) Chancroid in tropical Africa: Southern Rhodesia and the Gold Coast. Bulletin of the World Health Organization 4: 283. PMID:14859082
21. Guthe T (1960) The treponematoses as a world problem. British Journal of Venereal Diseases 36: 67. PMID:13830447
22. World Health Oganization (2002) Estimation of the incidence and prevalence of Sexually Transmitted Infections. Report of a WHO consultation, Treviso, Italy | 27 February—1 March 2002.
23. Kenyon C, Colebunders R (2013) Birds of a feather: homophily and sexual network structure in sub-Saharan Africa. Int J STD AIDS 24: 211–215. doi:10.1177/0956462412472455PMID:23535354
24. Laumann EO (1994) The social organization of sexuality: Sexual practices in the United States: Uni-versity of Chicago Press.
25. Gordon T, Devine B (1965) Findings on the Serologic Test for Syphilis in Adults, United States 1960–
1962. Vital Health Stat 11 11: 1–31.
26. Gottlieb SL, Pope V, Sternberg MR, McQuillan GM, Beltrami JF, Berman SM, et al. (2008) Prevalence of syphilis seroreactivity in the United States: data from the National Health and Nutrition Examination Surveys (NHANES) 2001–2004. Sex Transm Dis 35: 507–511. doi:10.1097/OLQ.
0b013e3181644baePMID:18356772
27. Hahn RA, Magder L, Aral S, Johnson RE, Larsen SA (1989) Race and the prevalence of syphilis ser-oreactivity in the United States population: a national sero-epidemiologic study. American journal of public health 79: 467–470. PMID:2929806
28. Lozano R, Naghavi M, Foreman K, Lim S, Shibuya K, Aboyans V, et al. (2012) Global and regional mortality from 235 causes of death for 20 age groups in 1990 and 2010: a systematic analysis for the Global Burden of Disease Study 2010. Lancet 380: 2095–2128. doi: 10.1016/S0140-6736(12)61728-0PMID:23245604
30. Meredith S, Hawkes S, Schmid G, Broutet N (2007) The global elimination of congenital syphilis: ratio-nale and strategy for action.
31. Kenyon C, Tsoumanis A, Osbak K (In Press) Strong country level correlation between syphilis and HSV-2 prevalence. Journal of Sexually Transmitted Diseases.
32. Osbak K, Rowley J, Kassebaum N, Kenyon C (2016) The Prevalence of Syphilis From the Early HIV Period Is Correlated With Peak HIV Prevalence at a Country Level. Sex Transm Dis 43: 255–257. doi:10.1097/OLQ.0000000000000422PMID:26967303
33. UNDP (1996) Human Development Report 1996. United Nations Development Program New York.
34. United Nations Development Programme (UNDP) (2010) Human Development Report 2010: the real wealth of nations; pathways to human development. New York: United Nations Development Program.
35. Weiss H (2008) Male Circumcision: Global Trends and Determinants of Prevalence, Safety, and Acceptability. World Health Organization. 9291736333 9291736333.
36. Cal Ham D, Lin C, Newman l, Saman Wijesooriya N, Kamb M (2015) Improving global estimates of syphilis in pregnancy by diagnostic test type: a systematic review and meta-analysis International Journal of Gynecology & Obstetrics 130: S10–24.
37. National Institute for Communicable Diseases (2003) Sexually Transmitted Infections Reference Cen-tre. Communicable Diseases Communique, 2: 1–3.
38. Holland S (1976) Sexually transmitted disease in Rhodesia. Cent Afr J Med 22: 193–195. PMID: 1036719
39. Latif AS (1981) Sexually, transmitted disease in clinic patients in Salisbury, Zimbabwe. Br J Vener Dis 57: 181–183. PMID:6894561
40. Willcox RR (1949) Report on a Venereal Diseases Survey of the African in Southern Rhodesia. Report on a Venereal Diseases Survey of the African in Southern Rhodesia.
41. Holland S (1976) Sexually transmitted diseases in Rhodesia. Part II. Cent Afr J Med 22: 216–220. PMID:1036971
42. Francis AM (2013) The wages of sin: how the discovery of penicillin reshaped modern sexuality. Arch Sex Behav 42: 5–13. doi:10.1007/s10508-012-0018-4PMID:23054260
43. Fleming A, Colebrook L (1911) On the use of Salvarsan in the treatment of Syphilis. The Lancet 177: 1631–1634.
44. Kenyon CR, Osbak K, Chico RM (2014) What underpins the decline in syphilis in Southern and East-ern Africa? An exploratory ecological analysis. IntEast-ernational Journal of Infectious Diseases.
45. Nielsen L (2011) Classifications of countries based on their level of development: How it is done and how it could be done. IMF Working Papers: 1–45.
46. UNAIDS (2009) AIDS epidemic update: December 2009: WHO Regional Office Europe.
47. Kenyon C, Tsoumanis A, Osbak K (2016) Strong country level correlation between syphilis and HSV-2 prevalence. Journal of Sexually Transmitted Diseases Article ID 595903HSV-2.
48. Kenyon C, Colebunders R, Buyze J (2014) Classification of incidence and prevalence of certain sexu-ally transmitted infections by world regions. Int J of Infec Dis 18: 73–80.
49. Kenyon C, Buyze J (2014) Should the threshold for generalized HIV epidemics be 1% or 5%? Int J STDs & AIDS 25: 898.
50. Morris M, Kurth AE, Hamilton DT, Moody J, Wakefield S (2009) Concurrent partnerships and HIV prevalence disparities by race: linking science and public health practice. Am J Public Health 99: 1023–1031. doi:10.2105/AJPH.2008.147835PMID:19372508
51. Kenyon C, Osbak K, Buyze J (2014) The prevalence of HIV by ethnic group is correlated with HSV-2 and syphilis prevalence in Kenya, South Africa, the United Kingdom and the United States. Interdisci-plinary Perspectives on Infectious Diseases: Article ID 284317.
52. Kenyon C, Colebunders R, Hens N (2013) Determinants of generalized herpes simplex virus-2 epi-demics: the role of sexual partner concurrency. Int J STD AIDS 24: 375–382. doi:10.1177/ 0956462412472816PMID:23970705
53. Koumans EH, Farley TA, Gibson JJ, Langley C, Ross MW, McFarlane M, et al. (2001) Characteristics of persons with syphilis in areas of persisting syphilis in the United States: sustained transmission associated with concurrent partnerships. Sex Transm Dis 28: 497–503. PMID:11518865
55. Kenyon CR, Osbak K (2015) The Prevalence of Syphilis Is Associated with the Prevalence of Male Point-Concurrency: An Ecological Analysis. World Journal of AIDS 5: 131.
56. Lagarde E, Auvert B, Carael M, Laourou M, Ferry B, Akam E, et al. (2001) Concurrent sexual partner-ships and HIV prevalence in five urban communities of sub-Saharan Africa. AIDS 15: 877–884. PMID:11399960
57. Sawers L (2013) Measuring and modelling concurrency. J Int AIDS Soc 16: 17431. doi:10.7448/IAS. 16.1.17431PMID:23406964
58. Tanser F, Barnighausen T, Hund L, Garnett GP, McGrath N, Newell ML (2011) Effect of concurrent sexual partnerships on rate of new HIV infections in a high-prevalence, rural South African population: a cohort study. Lancet 378: 247–255. doi:10.1016/S0140-6736(11)60779-4PMID:21763937
59. Aral SO, Over M, Manhart L, Holmes KK (2006) Sexually Transmitted Infections. In: Jamison DT, Mosley WH, editors. Disease control priorities in developing countries: health policy responses to epi-demiological change. Washington (DC): World Bank. pp. 653–689.
60. Xiao Y, Sun J, Li C, Lu F, Allen KL, Vermund SH, et al. (2010) Prevalence and correlates of HIV and syphilis infections among men who have sex with men in seven provinces in China with historically low HIV prevalence. J Acquir Immune Defic Syndr 53 Suppl 1: S66–73. doi:10.1097/QAI. 0b013e3181c7db43PMID:20104113
61. Holtgrave DR, Crosby RA (2003) Social capital, poverty, and income inequality as predictors of gonor-rhoea, syphilis, chlamydia and AIDS case rates in the United States. Sex Transm Infect 79: 62–64. PMID:12576618
62. Aral SO (1996) The social context of syphilis persistence in the southeastern United States. Sex Transm Dis 23: 9–15. PMID:8801650
63. Chico RM, Mayaud P, Ariti C, Mabey D, Ronsmans C, Chandramohan D (2012) Prevalence of Malaria and Sexually Transmitted and Reproductive Tract Infections in Pregnancy in Sub-Saharan Africa A Systematic Review. JAMA 307: 2079–2086. doi:10.1001/jama.2012.3428PMID:22665107
64. Moore JE, Mohr CF (1952) Biologically false positive serologic tests for syphilis; type, incidence, and cause. J Am Med Assoc 150: 467–473. PMID:14955455
65. Gonese E, Dzangare J, Gregson S, Jonga N, Mugurungi O, Mishra V (2010) Comparison of HIV prev-alence estimates for Zimbabwe from antenatal clinic surveillance (2006) and the 2005–06 Zimbabwe Demographic and Health Survey. PLoS One 5: e13819. doi:10.1371/journal.pone.0013819PMID: 21072202
66. Gray RH, Wawer MJ, Serwadda D, Sewankambo N, Li C, Wabwire-Mangen F, et al. (1998) Popula-tion-based study of fertility in women with HIV-1 infection in Uganda. Lancet 351: 98–103. PMID: 9439494
67. Musinguzi J, Kirungi W, Opio A, Montana L, Mishra V, Madraa E, et al. (2009) Comparison of HIV prevalence estimates from sentinel surveillance and a national population-based survey in Uganda, 2004–2005. J Acquir Immune Defic Syndr 51: 78–84. doi:10.1097/QAI.0b013e3181990713PMID: 19325495
68. Montana LS, Mishra V, Hong R (2008) Comparison of HIV prevalence estimates from antenatal care surveillance and population-based surveys in sub-Saharan Africa. Sex Transm Infect 84 Suppl 1: i78–i84. doi:10.1136/sti.2008.030106PMID:18647871
69. Marks M, Solomon AW, Mabey DC (2014) Endemic treponemal diseases. Trans R Soc Trop Med Hyg 108: 601–607. doi:10.1093/trstmh/tru128PMID:25157125
70. Otieno-Nyunya B, Bennett E, Bunnell R, Dadabhai S, Gichangi AA, Mugo N, et al. (2011) Epidemiol-ogy of syphilis in Kenya: results from a nationally representative serological survey. Sex Transm Infect 87: 521–525. doi:10.1136/sextrans-2011-050026PMID:21917697
71. Willcox R (1967) Fifty Years since the Conception of an Organized Venereal Diseases Service in Great Britain: THE ROYAL COMMISSION OF 1916*. British Journal of Venereal Diseases 43: 1.
72. O'Malley CK (1940) Syphilis in South Africa. South African Medical Journal 14: 459–462.
73. Kark SL (2003) The social pathology of syphilis in Africans. 1949. Int J Epidemiol 32: 181–186. PMID: 12714531
74. Vonderlehr R, Usilton LJ (1942) Syphilis among men of draft age in the United States: an analysis of 1,895,778 serologic reports of men aged 21–35 who were examined under the selective training and service act of 1940. Journal of the American Medical Association 120: 1369–1372.
75. Rolfs RT, Nakashima AK (1990) Epidemiology of primary and secondary syphilis in the United States, 1981 through 1989. JAMA 264: 1432–1437. PMID:2391740
77. Tramont E (2010) Syphilis. In: Mandell GL BJa DR, editor. Principles and Practice of Infectious Dis-eases 7th ed: Churchill Livingstone Inc.
78. Larsen SA, Steiner BM, Rudolph AH (1995) Laboratory diagnosis and interpretation of tests for syphi-lis. Clin Microbiol Rev 8: 1–21. PMID:7704889
79. Eagle H (1937) The laboratory diagnosis of syphilis. The CV Mosby Co St Louis: 21–28.
80. Larsen SA, Johnson RE (1998) History of the tests for Syphilis. In: Centers for DIsease Control and Prevention, editor. Manual of Tests for Syphilis 9th Edition. Atlanta.
81. Harris A, Rosenberg AA, Riedel LM (1946) A microflocculation test for syphilis using cardiolipin anti-gen. J Vener Dis Inf 27: 169–174.
82. Sena AC, White BL, Sparling PF (2010) Novel Treponema pallidum serologic tests: a paradigm shift in syphilis screening for the 21st century. Clin Infect Dis 51: 700–708. doi:10.1086/655832PMID: 20687840
83. Centers for Disease C, Prevention (2008) Syphilis testing algorithms using treponemal tests for initial screening—four laboratories, New York City, 2005–2006. MMWR Morbidity and mortality weekly report 57: 872.
84. Bates G (1939) Results of Venereal Disease Control in Canada. Am J Public Health Nations Health 29: 143–150. PMID:18014985
85. Parran T (1936) Health Security. Am J Public Health Nations Health 26: 329–335. PMID:18014396
86. Putkonen T, Patiala R (1950) Seropositive syphilis in Finland 1939–1944 in the light of blood donor volunteer material. Ann Med Exp Biol Fenn 28: 246–254. PMID:14878239
87. Pentinnen K (1946) On the Wasserman and Khan reactions during pregnancy. Helsinki: Univeristy of Helsinki.
88. Koskela P, Vaarala O, Makitalo R, Palosuo T, Aho K (1988) Significance of false positive syphilis reactions and anticardiolipin antibodies in a nationwide series of pregnant women. J Rheumatol 15: 70–73. PMID:3258387
89. Mungale MD, Jhala HI, Welinkar WN (1958) Sero-reactivity for Syphilis in Bombay. Br J Vener Dis 34: 113–117. PMID:13560798
90. Rajam RV (1956) Venereal diseases in India. Br J Vener Dis 32: 79–81. PMID:13355995
91. Bhargava N, Singh O (1974) Prevalence of Syphilis in Different Classes of Population. Indian Journal of Dermatology, Venereology, and Leprology 40: 215.
92. Chakraborty S, Munni M (1989) Serological survey for syphilis amongst antenatal cases in selected hospitals of Delhi. Indian journal of public health 33.
93. Sethi S, Sharma K, Dhaliwal LK, Banga SS, Sharma M (2007) Declining trends in syphilis prevalence among antenatal women in northern India: a 10-year analysis from a tertiary healthcare centre. Sex Transm Infect 83: 592.
94. Tanami Y, Yamamoto J (1958) The venereal disease problem in Japan. Bull World Health Organ 19: 519–529. PMID:13596879
95. Hartmann O, Schone R (1943) On the Frequency of Seropositive Syphilis in Norway in Presumably Healthy Adults. Acta Medica Scandinavica 114: 236–258.
96. Vogelsang TM (1950) Serological syphilis control in pregnancy in Bergen, Norway. Acta Derm Vener-eol Suppl (Stockh) 31: 100–101.
97. Eng J (1959) Treponemal immobilization test in expectant mothers; results in 142 reactors to standard serological tests. Br J Vener Dis 35: 10–14. PMID:13651658
98. Stray-Pedersen B (1983) Economic evaluation of maternal screening to prevent congenital syphilis. Sex Transm Dis 10: 167–172. PMID:6665662
99. Ram LM (1960) Treponematosis in Singapore. Br J Vener Dis 36: 93–97. PMID:14435996
100. De Schryver A, Meheus A (1990) Syphilis and blood transfusion: a global perspective. Transfusion 30: 844–847. PMID:2238035
101. Eisenberg L (1973) Syphilis In the Bantu of Soweto. S Afr Med J 47: 2181. PMID:4758247
102. National Department of Health (2006) The National Antenatal Sentinel HIV and Syphilis Prevalence Survey, South Africa.
103. National Department of Health (2008) The National Antenatal Sentinel HIV and Syphilis Prevalence Survey, South Africa.


![Table 3. Sensitivity and specificity of various treponemal and nontreponemal tests. Figures in parentheses refer to the range of sensitivities and speci- speci-ficities found in the included studies (Table is based on data from [78] and [82]).](https://thumb-eu.123doks.com/thumbv2/123dok_br/17157430.240476/12.918.66.867.148.502/sensitivity-specificity-treponemal-nontreponemal-figures-parentheses-sensitivities-ficities.webp)