www.biogeosciences.net/10/23/2013/ doi:10.5194/bg-10-23-2013
© Author(s) 2013. CC Attribution 3.0 License.
Biogeosciences
Organic carbon and nitrogen export from a
tropical dam-impacted floodplain system
R. Zurbr ¨ugg1,2, S. Suter1, M. F. Lehmann3, B. Wehrli1,2, and D. B. Senn1,2
1Institute of Biogeochemistry and Pollutant Dynamics, ETH Zurich, Universit¨atstrasse 16, 8092 Zurich, Switzerland 2Eawag, Swiss Federal Institute of Aquatic Science and Technology, Surface Waters – Research and Management,
Seestrasse 79, 6047 Kastanienbaum, Switzerland
3Institute of Environmental Geosciences, University of Basel, Bernoullistrasse 30, 4056 Basel, Switzerland Correspondence to:R. Zurbr¨ugg ([email protected])
Received: 31 May 2012 – Published in Biogeosciences Discuss.: 28 June 2012
Revised: 12 November 2012 – Accepted: 29 November 2012 – Published: 4 January 2013
Abstract.Tropical floodplains play an important role in or-ganic matter transport, storage, and transformation between headwaters and oceans. However, the fluxes and quality of organic carbon (OC) and organic nitrogen (ON) in tropical river-floodplain systems are not well constrained. We ex-plored the quantity and characteristics of dissolved and par-ticulate organic matter (DOM and POM, respectively) in the Kafue River flowing through the Kafue Flats (Zambia), a tropical river-floodplain system in the Zambezi River basin. During the flooding season,>80 % of the Kafue River wa-ter passed through the floodplain, mobilizing large quanti-ties of OC and ON, which resulted in a net export of 69– 119 kg OC km−2d−1and 3.8–4.7 kg ON km−2d−1, 80 % of
which was in the dissolved form. The elemental C : N ratio of ∼20, the comparatively highδ13C values of −25 ‰ to
−21 ‰, and its spectroscopic properties (excitation-emission matrices) showed that DOM in the river was mainly of terres-trial origin. Despite a threefold increase in OC loads due to inputs from the floodplain, the characteristics of the riverine DOM remained relatively constant along the sampled 410-km river reach. This suggests that floodplain DOM displayed properties similar to those of DOM leaving the upstream reservoir and implied that the DOM produced in the reser-voir was relatively short-lived. In contrast, the particulate fraction was13C-depleted (−29 ‰) and had a C : N ratio of
∼8, which indicated that POM originated from phytoplank-ton production in the reservoir and in the floodplain, rather than from plant debris or resuspended sediments. While the upstream dam had little effect on the DOM pool, terrestrial particles were retained, and POM from algal and microbial
sources was released to the river. A nitrogen mass balance over the 2200 km2 flooded area revealed an annual deficit of 15 500–22 100 t N in the Kafue Flats. The N isotope bud-get suggests that these N losses are balanced by intense N-fixation. Our study shows that the Kafue Flats are a signifi-cant local source of OC and ON to downstream ecosystems and illustrates how the composition of riverine OM can be altered by dams and floodplains in tropical catchments.
1 Introduction
Floodplains can act as major sources or sinks for riverine car-bon (C) and nitrogen (N), regulating the organic matter (OM) transport from headwaters to downstream systems such as lakes and oceans. Numerous studies in temperate floodplains have quantified their function as efficient particle and nutri-ent sinks (e.g. Noe and Hupp, 2009; Hoffmann et al., 2011; Olde Venterink et al., 2003), while only a few studies have examined tropical systems (e.g. McJannet et al., 2012). De-spite the importance of wetlands in the global C cycle, the role of floodplains for riverine C storage, transformation and export has not been well constrained (Battin et al., 2009). This is particularly true for the large wetlands in the tropics, which are among the most productive and valuable ecosys-tems worldwide.
differences in age, origin, chemical structure and bioavail-ability within the DOC pool and between DOC and partic-ulate organic C (POC). While POC in forested catchments has frequently been associated with plant debris, the source allocation of DOC is more complex and often inconclusive (Tremblay and Benner, 2009). The organic N fraction, in particular the analysis of dissolved organic N (DON), how-ever, has seldom been used as a means of dissolved OM (DOM) characterization in tropical systems, despite the fact that DON accounts for 50–90 % of total dissolved N (TDN), and generally high DON export from tropical catchments (Berman and Bronk, 2003; Wiegner et al., 2009).
Hydrological interaction between rivers and floodplains has been identified as a primary factor governing OM mo-bilization and nutrient dynamics in temperate systems (Hun-singer et al., 2010). In the tropical floodplains of the Ama-zon basin, river-floodplain exchange has been shown to affect particle distribution and storage (Aalto et al., 2003), cause shifts in the composition of riverine OM due to the injec-tion of floodplain-derived OM to rivers (Richey et al., 1990), and foster in-stream mineralization of OM (Mayorga et al., 2005).
In this study we examined the changes in loading and qual-ity of riverine OC and ON during passage through highly productive floodplains. We characterized POM and DOM in the Kafue Flats (Fig. 1a), a floodplain system along the Ka-fue River, the largest tributary of the Zambezi River in south-ern Africa. The hydrology of the Kafue River shows a dis-tinct seasonality, with more than 80 % of the river discharge during the wet season (600–800 m3s−1)passing through the
floodplain (Zurbr¨ugg et al., 2012). For comparison, only
∼30 % of the Amazon stream flow travels through flood-plains (Richey et al., 1989). During the dry season, the dis-charge is rather constant and the exchange with the floodplain strongly reduced. Intense river-floodplain exchange exerts a strong influence on river biogeochemistry of the Kafue River, as evidenced by pronounced hypoxia over the last 150 km-long river reach dominated by lateral inflows from the inun-dated floodplain (Zurbr¨ugg et al., 2012).
The case of the Kafue Flats illustrates how a pristine trop-ical floodplain system can be affected by water resources development. Two large dams built in the 1970s have al-tered the hydrological regime (Zurbr¨ugg et al., 2012), and the flooding patterns in the Kafue Flats (Mumba and Thomp-son, 2005; Meier et al., 2010). The associated changes in downstream flooding modified the hydrological connectiv-ity between river and floodplain, and could eventually affect the quality and fluxes of OM (Bouillon et al., 2009). Biogeo-chemical impacts of dam operation in this system have been addressed recently (Zurbr¨ugg et al., 2012; Kunz et al., 2011) as part of an effort to quantify the effect of damming on flu-vial ecosystems in the tropics.
The goals of this study were (1) to quantify retention or leaching and export of OC and ON from the floodplain to the river, and the net export from the Kafue Flats; (2) to
de-termine source, quality and fate of the exported OM during the flooding and dry season; (3) describe how intense river-floodplain exchange affects the sources of OM transported by the Kafue River; and (4) to explore changes in OM mobiliza-tion, transport, and quality that are related to dam operation. We hypothesized that intense river-floodplain exchange and the backflow from the floodplain carries large OM loads with terrestrial characteristics to the river and alter the composi-tion of the riverine OM. In addicomposi-tion, we hypothesized that dam operation would affect the source and quality of OM in the downstream Kafue Flats.
2 Methods
2.1 Study site – Kafue Flats
The Kafue Flats are a floodplain system along the Kafue River in Zambia (Fig. 1a). The total area of the floodplain is 6500 km2, whereof up to 3300 km2 are seasonally inun-dated (K¨ock, personal communication). The annual flooding occurs from January to August and is caused by direct pre-cipitation (November–April; mean 800 mm), the peak flows of the Kafue River (up to 1900 m3s−1; Fig. 1b), and
sea-sonal tributaries, creating an extensive wetland area and rich wildlife habitat. The floodplain vegetation fringing the river channel consists of highly productive C4grasses, with a net
primary production of 800–2000 g C m−2yr−1, while water
meadows with less productive C3 vegetation prevail in the
more distant areas (Ellenbroek, 1987). During the dry season from June-October, river discharge drops to <100 m3s−1 (Fig. 1b) and the floodplain dries up almost completely. The land use in the immediate catchment is traditional, that is, small-scale cattle farming and fisheries, and large areas re-main unutilized. Sugar cane plantations are located along the last 60 river-km, leaving large sections of the Kafue Flats rel-atively pristine.
The hydrology of the Kafue River (Qavg ∼300 m3s−1)
has been influenced by two large dams at Itezhi-Tezhi (ITT; closed in 1978) immediately upstream of the flats, and Ka-fue Gorge (closed in 1972), immediately downstream of the flats (Fig. 1c). At ITT dam, water is currently released to the floodplain via spillways, draining the reservoir’s epilimnion. A recent study by Kunz et al. (2011) showed that ITT reser-voir (with a hydraulic residence time of∼0.7 yr) efficiently traps particles and removes 50 % of N and 60 % of P inputs from the Kafue River.
Intense hydrological exchange between river and flood-plain has been identified as a major feature in the Kafue Flats (Zurbr¨ugg et al., 2012). A constriction of the river channel forced 70 % of the stream flow into the floodplain between 180 and 225 km downstream of ITT dam (Fig. 2). The back-flow from the wetlands caused a seasonally recurring steep decline in dissolved oxygen (DO) concentration down to <1 mg l−1and low DO levels (<2 mg l−1)along a 150-km
Fig. 1. (a)Kafue Flats in the Kafue River basin (dark shaded), a sub-basin of the Zambezi River basin (light gray).(b)The hydrograph from 2007–2010 shows the reservoir inflow (gray line), dam release (black line), rainfall (bars), and the water level in the middle of the floodplain (dotted line, lower panel). The three sampling campaigns are marked by vertical lines.(c)Map of the Kafue Flats. Dams are marked with triangles, white dots indicate sampling stations along the main channel, arrows T1–T5 depict transects into the floodplain.
The extent of river-floodplain exchange during inundation was quantified in a mixing model using natural tracers such as specific conductivity and δ18O-H2O (stable oxygen
iso-tope composition of water; Zurbr¨ugg et al., 2012). The tracer levels in ITT reservoir and along transects into the floodplain served as end members to calculate the fractions of flood-plain and reservoir water to the river discharge for the 410 km longitudinal transect (Fig. 2). Intense lateral exchange was observed after∼230 km, by monitoring the increasing contribution of floodplain water to river discharge (Fig. 2). As a net result, more than 80 % of the water leaving the Ka-fue Flats had passed through the floodplain. A comparison of the 2008–2009 exchange regime with historical discharge data showed that the magnitude river-floodplain exchange has been reduced by 50 % since the construction of the two dams in the 1970s (Zurbr¨ugg et al., 2012). In addition, dam operation also changed the timing and extent of inundation in the Kafue Flats (Mumba and Thompson, 2005).
2.2 Sampling campaigns
After a pilot campaign in May 2008, three spatially inten-sive sampling campaigns were carried out during the dry sea-son (October 2008), and the flooding seasea-sons in May 2009 and May 2010 (Fig. 1b). Sampling was conducted along the Kafue River at∼20 km resolution from downstream of the spillways at ITT dam (0 km) until the end of the floodplain (410 km; Fig. 1c). To characterize floodplain waters,
addi-Fig. 2.Evidence of river-floodplain exchange in May 2010, indi-cated by an increasing proportion of floodplain-derived water (dark gray shading) to the river discharge (solid line) relative to water from the upstream reservoir (light gray shading). The contribution of floodplain water was calculated by a mixing model based on
δ18O-H2O along the river (full circles). For details see Zurbr¨ugg et al. (2012). The arrow marks the steep decline in discharge (180– 225 km) caused by a constriction in the river channel.
peristaltic pump (Ejikelkamp, 12 VDC Standard). The tub-ing was flushed repeatedly before taktub-ing samples, and the contact time was minimized to avoid contamination. Samples for DOC and DON, and spectroscopic analyses were filtered in the field through 0.7 µm glass fiber (GF) filters (Whatman) into glass bottles and LDPE bottles for DON. Samples for spectroscopic analyses were kept at 4◦C in the dark and an-alyzed within 3–4 weeks after sampling. Replicate measure-ments were done after different storage times after sampling and no effect of storage was detected. Water samples for el-emental and isotope analyses were acidified to pH 2.5 and frozen until further analysis. For POC and particulate N (PN) characterization, particles from ∼2 L of water were col-lected on 0.7 µm GF filters (Whatman) and frozen until anal-ysis. All sampling equipment was 2 M HCl / MilliQ-washed, glassware and filters were, in addition, pre-combusted (6 h at 450◦C). For comparative purposes,δ13C,δ15N and C and
N contents were also analyzed in floodplain vegetation, soil OM, river sediment, and dry deposition (see Supplement for details).
2.3 Laboratory analyses
2.3.1 Concentrations and stable isotopic composition of
DOC, POC and PN
DOC concentration was measured on a Shimadzu 5050 TOC analyzer. For POC and PN concentration and C and N isotope measurements (δ13C-POC and δ15N-PN, respectively), GF filters were dried (3 h at 40◦C), and cut into subsamples. POM samples were not acidified because the sediments of ITT reservoir contained only negligible amounts of inorganic carbon (Kunz et al., 2011) and the epilimnion was undersaturated with respect to calcium carbonate (CaCO3; data not shown). POM aliquots were
enclosed in tin capsules and measured on a FlashEA 1112 coupled to a DeltaV Adantage Continuous-Flow Isotope Ratio Mass Spectrometer (FlashEA-CF-IRMS; ThermoFinnigan). In-house ethylenediaminetetraacetic acid (EDTA; δ13C =−30.25 ‰VPDB; δ15N =−1.1 ‰air)
and ammonium oxalate standards (δ13C =−17.02 ‰ VPDB;
δ15N = +32.7 ‰air)were used for calibration, with a
preci-sion of±0.1 ‰VPDB forδ13C and±0.2 ‰airfor δ15N. The
isotopic ratios are reported using the delta notation, that is, δ13C or δ15N = (Rsample−1)×Rstandard×1000 ‰ , where
Ris the isotopic ratio (13C :12C or15N :14N) of the sample (Rsample)and the standards (Rstandard), i.e. Vienna Pee Dee
Belemnite (VPDB) for C and atmospheric N2for N.
For the C-isotope analysis of DOC (δ13C-DOC), 1 ml of 5 g l−1high-purity, precombusted potassium sulfate (K2SO4)
was added to 40 ml of sample and the acidic samples were purged for 2 min with argon to remove inorganic C (HCl had been added in the field), refrozen and freeze-dried (Schwen-denmann and Veldkamp, 2005). The precipitate was mea-sured on the same FlashEA-CF-IRMS using IAEA-CH6
su-crose (δ13C =−10.45 ‰VPDB), EDTA and ammonium
ox-alate as standards at an analytical precision of±0.1 ‰VPDB.
The analytical precision is based on replicate measurements of untreated standards of sucrose (n=7) and ammonium ox-alate (n=7), and standards that were processed as samples (n=6 andn=8, respectively).
2.3.2 Concentrations of DIN and DON, andδ15N-TDN
For dissolved inorganic N (DIN), ammonium (NH+4)and ni-trite (NO−2)were measured using standard colorimetric tech-niques. The sum of nitrate (NO−3)and NO−2 was determined by reduction to nitrous oxide (Braman and Hendrix, 1989) in an acidic vanadium (III) solution in an Antek 745 prepara-tion module followed by chemoluminescence detecprepara-tion (An-tek 9000), and NO−3 was calculated by difference.
TDN was measured according to Sol´orzano and Sharp (1980) and Bronk et al. (2000) by oxidizing 12 ml of filtered sample to NO−3 with 2 ml of persulfate oxidizing reagent (POR), which consisted of 6 g potassium peroxy-disulfate (K2S2O8)and 6 g sodium hydroxide (NaOH; both
ACS-grade) per 100 ml MilliQ water (Knapp et al., 2005). In order to reduce the nitrogen blank of POR, the peroxydisul-fate salt was recrystallized 3–5 times according to Grasshoff et al. (1999) and stored under argon atmosphere. Samples with POR were autoclaved in 30 ml Pyrex vials (acid washed, precombusted, teflon-lined lids) for 55 min and the NO−3 concentration was measured as described above. IAEA-N2 (ammonium sulfate (NH4)2SO4; +20.3 ‰air),
USGS-41 (L-glutamic acid; +47.6 ‰air), urea (+0.24 ‰air),
and EDTA were used as processing and isotopic standards, and were oxidized with the samples over the expected con-centration range (Fig. S1, Supplement). The oxidation yield was 95–106 % after blank correction. Duplicates of pure POR solution were oxidized with every run to determine the contribution of POR to the N blank. The POR blank contribution was generally 0.5±0.3 µM per sample, which is equal to∼3 % of the sample TDN. DON concentrations were calculated as DON = TDN−NO−3 −NO−2 −NH+4.
The δ15N ratio of TDN-derived NO−3 (δ15N-TDN) was measured according to Knapp et al. (2005) and Bourbonnais et al. (2009), combining persulfate oxidation and the denitri-fier method (Casciotti et al., 2002; Sigman et al., 2001) where NO−3 is bacterially converted to N2O. After microbial
reduc-tion of NO−3, N2O was measured on a modified GasBench
II with a GC PAL autosampler coupled to a Delta Plus XP Continuous Flow IRMS (all instruments ThermoFinnigan). IAEA-NO3 (+4.7 ‰air) and in-house UBN1 (+14.2 ‰air)
2.3.3 Concentrations of total suspended solids
Total suspended solids (TSS) were measured in October 2008 and May 2009 by gravimetry, that is, weighing 47 mm pre-combusted 0.7 µm GF filters (Whatman) before and after filtration of∼2 l of water sample and subsequent drying (3 h at 40◦C).
2.3.4 Spectroscopic analyses
To constrain the source and chemical character of DOM we measured specific UV absorption at 254 nm (SUVA254),
which is a measure of the aromaticity of the DOM (Weishaar et al., 2003). UV absorption from 200–700 nm was measured in a 1 cm quartz cuvette using a UV-VIS spectrophotometer (Varian Cary 100Bio) and SUVA254was calculated as
SUVA254=
Abs254
[DOC] [lmg −1
m−1], (1)
whereby Abs254 is the absorption measured at 254 nm and
[DOC] is the DOC concentration. Excitation-emission ma-trices (EEMs; Coble, 1996; McKnight et al., 2001) were obtained for each of the 45 filtered whole water samples from May 2010 over an excitation range from 240 to 450 nm in 5 nm increments and an emission range from 320 to 550 nm in 2 nm increments on a Fluoromax-4 spectrofluo-rometer (Horiba Jobin Yvon). All matrices were corrected for the inner-filter effect, using measured UV absorbance (Lakowicz, 2006), for lamp decay (Stedmon et al., 2003), and normalized by the Raman peak area. Parallel factor anal-ysis (PARAFAC) was used to identify the underlying flu-orescence components following the procedures of Sted-mon et al. (2003) and StedSted-mon and Bro (2008). A series of PARAFAC models with two to eight components were fit-ted to the data and we found that a four-component model gave the best representation of the EEMs’ fluorescence sig-nal. More details on PARAFAC modeling are given in the Supplement.
In order to characterize the origin of DOM, the fluores-cence index (FI) was calculated as:
FI=Em470 Em520
. (2)
Em470and Em520are the emission intensities at wavelengths
of 470 nm and 520 nm, respectively, at an excitation wave-length of 370 nm (Cory et al., 2010). The FI was origi-nally developed to distinguish fulvic acids from “terrestrial” (e.g. from decomposition and leaching of plant and soil or-ganic matter) and “microbial” sources (autochthonous; e.g. from extracellular release and leachate of algae and bacte-ria; McKnight et al., 2001) and has widely been applied for bulk DOM samples (e.g. Johnson et al., 2011; Mladenov et al., 2005; Miller and McKnight, 2010). The range of FI is confined by end member fulvic acids from terrestrially dom-inated (river draining a swamp) and microbially domdom-inated
sources (lakes in the Antarctica). The end member values are∼1.2 for terrestrial and,∼1.6 for the microbial sources, whereby values of>1.4 indicate rather microbial and<1.4 mainly terrestrial origin (Cory et al., 2010).
2.4 Statistical analyses
Correlations between normally distributed parameters were determined by linear regression, and by Spearman’s corre-lations for non-normally distributed data. To evaluate differ-ences between pooled data, we used ANOVA if normally dis-tributed, otherwise we used non-parametric Kruskal–Wallis tests, both at a critical level of 0.05. Averaged data are given as mean±SD. Statistical analyses were done with SigmaPlot 11. The full concentration and stable isotope data set is avail-able as an electronic supplement.
3 Results
3.1 Organic carbon and nitrogen concentrations along
the Kafue River
Longitudinal profiles of dissolved and particulate organic matter revealed significant differences between the two flooding season campaigns in May 2009 and May 2010 com-pared to the data set from the dry season in October 2008 (Fig. 3). Wet season DOC increased from∼250 µM imme-diately downstream of ITT dam (0 km) to∼400 µM at end of the floodplain (410 km; Fig. 3a). Most of the DOC increase occurred after 230 km, where a large influx of floodplain-derived water began entering the river (Fig. 2). Dry season DOC concentrations remained relatively constant at 280±
50 µM along the river reach, with the exception of lower con-centrations at 240 km and 270 km.
Flooding season DON concentrations showed a similar twofold increase, from ∼10 µM at the dam site to maxi-mum concentrations of∼20 µM at 410 km. In the dry sea-son, DON was found at fairly constant concentrations of 14±1.2 µM. For all three campaigns, ON was the domi-nant form of N, representing 93–97 % of total N while DIN, mainly in form of NO−3 and NH+4, was generally<1.5 µM (data not shown). As a logic consequence of the similar in-crease of the DOC and DON concentrations for all three cam-paigns, the molar DOC : DON ratio remained relatively in-variant along the river (May 2010: 19.7±2.4; May 2009: 23.2±2.3; October 2008: 19.8±3.5; Fig. 3a). In May 2010, DOC tended to be higher in the inundated floodplain than at the adjacent river stations, reaching up to 600 µM, while the DON concentrations were comparable to those measured in the river (Fig. 3a).
for POC and 6.6 µM for PN, respectively. For the dry sea-son, pronounced peaks to 130 µM POC and 13 µM PN were evident between 200 and 300 km (Fig. 3b), while for the re-maining reaches the concentrations of both parameters were comparable to values observed during flooding. As observed for the dissolved fraction, the molar ratio of POC and PN was uniform during the flooding period (May 2010: 7.9±0.9; May 2009: 8.6±0.7). For the dry season, POC : PN was ele-vated at the dam site but decreased to the levels found in May when passing the Kafue Flats (Fig. 3b).
TSS measurements from May 2009 and October 2008 gen-erally followed the POC and PN concentration data (Fig. 3c). However, for both campaigns, the C and N content of the par-ticles revealed that parpar-ticles leaving the ITT reservoir were highly enriched in C (36–42 wt %) and N (4.0–4.7 wt %) rel-ative to the downstream reaches, but C and N contents in-creased again between 200–300 km.
3.2 Carbon and nitrogen stable isotopes
δ13C-DOC values in the river were confined to a narrow range of −21.0 ‰ to −24.7 ‰ during all three sampling campaigns (Fig. 4). Nonetheless, some systematic varia-tions were evident. During the May 2010 campaign,δ13 C-DOC exhibited a distinct increase from−23.9 ‰ to−21.7 ‰ over the first 90 km, and during both flooding season cam-paignsδ13C-DOC decreased by 2.5 ‰ after 250 km. Along the floodplain transects,13C-enrichment in DOC tended to co-occur with high DOC concentrations, mostly in the more distant areas from the river channel. During the dry season, δ13C-DOC did not show any systematic variation along the river channel and the negative peaks corresponded to the DOC concentration minima.
Across all sampling campaigns, POC at the river stations was systematically depleted in13C relative to the correspond-ing DOC (mean difference = 5.1±1.7 ‰; Fig. 4). During both flooding seasons,δ13C-POC increased by∼2.5 ‰ over the first 100 km downstream of ITT dam. Theδ13C-POC of floodplain samples varied substantially, covering a range of
−33.7 ‰ to−23.4 ‰. In the dry season,δ13C-POC initially remained constant at−26 ‰, that is, enriched by>1 ‰ rel-ative to the co-located flooding season data. After 250 km, δ13C-POC sharply declined to almost−30 ‰ which essen-tially is the13C signature of the POC leaving the Kafue Flats. δ15N-TDN values during the May 2010 and May 2009 campaigns exhibited limited variability along the river (2.1±
0.4 ‰ and 1.4±0.5 ‰, respectively), as well as small differ-ences between river and adjacent floodplain stations (Fig. 4). Dry seasonδ15N-TDN was characterized by a 3 ‰ increase over the first 65 km after the dam followed by a net decline ofδ15N-TDN to 2.5 ‰ at the end of the floodplain. For the particulate fraction,δ15N-PN at ITT dam in May 2010 and 2009 was elevated by∼2 ‰ relative toδ15N-TDN, and grad-ually approximated values comparable toδ15N-TDN further downstream (Fig. 4). Floodplainδ15N-PN in May 2010
cov-Fig. 3. (a) Concentrations of DOC and DON, and molar DOC : DON ratio,(b)concentrations of POC and PN, and molar POC : PN ratio for the flooding season (May 2010 and May 2009), and the dry season (October 2008) along the Kafue River channel (black dots and lines), at floodplain stations (empty diamonds) and tributaries (gray triangles).(c)TSS concentration and C and N con-tent of the particles in the Kafue River for May 2009 and October 2008.
ered a considerably wider range than observed in river sam-ples (0.3 ‰ to 5.7 ‰). High variation inδ15N-PN was also measured in the dry season, however, without obvious trend.
3.3 Spectroscopic analyses of dissolved organic matter
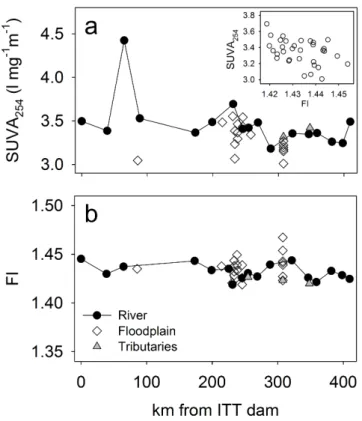
SUVA254 was 3.5±0.3 l mg−1m−1 (Fig. 5a) and did not
Fig. 4.Stable isotope signatures of dissolved and particulate organic carbon and nitrogen for the flooding seasons and dry season (sym-bols as indicated in Fig. 3).
a very narrow range between 1.42 and 1.47 and exhibited only minor, non-significant (P =0.117) variation along the river (Fig. 5b). The EEMs showed a high degree of similar-ity among the stations along the river (Fig. 6a) and flood-plain transects (Fig. 6b). Two main fluorescence peaks were detected at excitation/emission wavelengths of 345/440 nm, and 240/430 nm. These peaks are common features in nat-ural DOM and have been named Peak A and Peak C (Coble, 1996), respectively.
4 Discussion
4.1 Net export of organic matter from the Kafue Flats
The Kafue River’s channel morphology is conducive to in-tense exchange with the floodplain, yet this exchange is highly variable along the river (Fig. 2). During high flows, a large fraction of the stream flow was diverted into the floodplain between 180 and 225 km, while downstream of the 300 km mark, water returned from the floodplain into the river, resulting in a∼fourfold discharge increase (Fig. 2). The average water residence time on the floodplain of
∼2 months was deduced from the evaporative signal of water isotopes (Zurbr¨ugg et al., 2012). Most of the dis-charge and the chemical loads of the lower Kafue River in May 2010 and May 2009 originated in, or passed through, the floodplain. Comparable levels of exchange occur every year when flow rates substantially exceed∼200–300 m3s−1
(December–July; Zurbr¨ugg et al., 2012). During low-flow pe-riods (August–November), the exchange with the floodplain was substantially reduced.
Fig. 5. (a) Specific UV absorption at 254 nm (SUVA254), and
(b) fluorescence index (FI) along the river (black circles), in the floodplain (empty diamonds), and in tributaries (gray triangles) in May 2010. The insert in(a)shows the negative correlation of the pooled SUVA254and FI data (P <0.001). Samples with SUVA254
>4.0 l mg−1m−1were removed for clarity.
We combined discharge measurements with concentration data to quantify mass loads of OC and ON along the river (Fig. 7; Table 1). In May 2010, the minimum discharge and minimum DOC and DON loads were observed at∼230 km (Fig. 2), after∼85 % of the flow and loads had been forced into the floodplain (Fig. 7). Downstream of 230 km, dis-charge and concentrations of dissolved organic matter in-creased, resulting in a threefold increase in loading (Table 1). As DOC and DON mass loads at 410 km were 2.7 and 2.3 times larger than at the dam, and some of the dissolved or-ganic matter entering the floodplain may have been metabo-lized before reentering the river, a minimum of 82 % of DOC and 75 % of DON in the river originated from the flood-plain. Load patterns in May 2009 were, overall, similar to those in May 2010, indicating that the large export pulses of DOC and DON from the Kafue Flats are a recurring seasonal phenomenon (Fig. 7). During the flooding period, the Ka-fue Flats were a net source of 108–214 t DOC d−1and 6.0– 7.6 t DON d−1. This stands in contrast to the dry season when
0 km 175 km175 km 290 km 410 km
T1 T2 T3 T4
a
Kafue River main channelb
Floodplain transectsFig. 6.Excitation-emission matrices (EEMs) for(a)four river samples indicated with distance from ITT dam, and(b)four floodplain samples along different floodplain transects. The two main fluorescence peaks are at excitation/emission wavelengths of 240/430 nm and 345/440 nm, and have been named by Coble (1996) as Peak A and Peak C, respectively.
In contrast to the clear pattern of dissolved organic mat-ter, the Kafue Flats were a net POM source only in May 2010, not in 2009. During inundation, the contribution of POC to the total OC declined threefold along the flow path from∼15 % to∼5 %, and the PN fraction of total N from
∼30 % to∼10 % (Fig. S2, Supplement). Concentration and load data show that some fraction of POM must have been deposited or degraded during the transit through the inun-dated floodplain. The floodplain had no net effect on the par-ticle transport during the dry season, as the Kafue River was flowing through the flats with little floodplain interaction. The short travel times of 1.5 weeks along the river (aver-age velocity of∼0.5 m s−1)and relatively constant flows for several weeks around the sampling time period (Zurbr¨ugg et al., 2012) allowed for a comparison of upstream and down-stream loads. Strictly speaking, our results represent “snap-shots” in time, which may not represent the average an-nual conditions. However, results from a bi-monthly sam-pling campaign that was carried out over one year at sev-eral stations along the river indicate a net export of OM pre-dominating for several months. Integrated over an annual cycle, net exports from the Kafue Flats were estimated as
∼60 000 t OC yr−1and∼1800 t ON yr−1, respectively (Wa-mulume et al., 2011).
The sources and sinks of a floodplain can be compared among different systems by scaling the fluxes to the active area. We assumed that the OC and ON export resulted from the total inundated area at a given time and used the inun-dation model of Meier et al. (2010) to retrieve flooded ar-eas and calculate area-specific export rates (or yields). The monthly mean flooded surfaces for May 2010, May 2009
Fig. 7.Organic carbon (a) and nitrogen (b) loads (t C or N d−1) cal-culated as discharge ×concentration for the flooding and dry season. For the hatched areas in May 2010, N loads were calculated with extrapolated concentrations using the regression between DOC and DON (ρ=0.901,P <0.001), due to missing DON data. Arrows indicate the discharge minimum due to a channel constriction from Zurbr¨ugg et al. (2012).
and October 2008 were 1930 km2, 1560 km2 and 270 km2 (K¨ock, personal communication). Flooding in the dry sea-son was restricted to the actual river channel and the perma-nently flooded areas after 320 river-km. Based on the net OC and ON export for the 2010 and 2009 flooding periods and the respective area, OC yields were 119 and 69 kg C km−2 d−1(annual average 43 and 25 g C m−2yr−1)for May 2010 and 2009, respectively. The ON exports from the Kafue Flats were on the order of 6–9 t N d−1, which corresponds
to area normalized yields of 3.8–4.7 kg N km−2d−1 (1.4–
1.7 g N m−2yr−1)for May 2009 and 2010, respectively
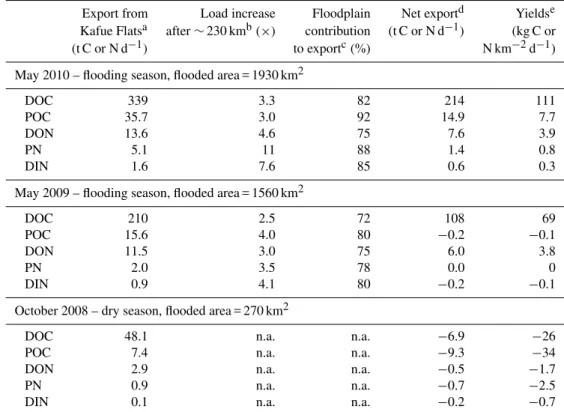
Table 1.Organic carbon and nitrogen loads, net exports and yields from the Kafue Flats.
Export from Load increase Floodplain Net exportd Yieldse Kafue Flatsa after∼230 kmb(×) contribution (t C or N d−1) (kg C or
(t C or N d−1) to exportc(%) N km−2d−1)
May 2010 – flooding season, flooded area = 1930 km2
DOC 339 3.3 82 214 111
POC 35.7 3.0 92 14.9 7.7
DON 13.6 4.6 75 7.6 3.9
PN 5.1 11 88 1.4 0.8
DIN 1.6 7.6 85 0.6 0.3
May 2009 – flooding season, flooded area = 1560 km2
DOC 210 2.5 72 108 69
POC 15.6 4.0 80 −0.2 −0.1
DON 11.5 3.0 75 6.0 3.8
PN 2.0 3.5 78 0.0 0
DIN 0.9 4.1 80 −0.2 −0.1
October 2008 – dry season, flooded area = 270 km2
DOC 48.1 n.a. n.a. −6.9 −26
POC 7.4 n.a. n.a. −9.3 −34
DON 2.9 n.a. n.a. −0.5 −1.7
PN 0.9 n.a. n.a. −0.7 −2.5
DIN 0.1 n.a. n.a. −0.2 −0.7
aCalculated as discharge×concentration at the outflow (410 km).
bFlooding season C and N loads were minimum at∼230 km due to a channel constriction and reduced river discharge (marked with
arrows in Fig. 7). The increase in C and N loads thereafter was assumed to originate from the floodplain.
cThe floodplain contribution to the exported OM was calculated assuming negligible in-stream production of DOM or POM. dCalculated as the difference of discharge×concentration between 0 km and 410 km.
eThe export per area was calculated using modeled monthly mean flooded areas from the model of Meier et al. (2010; F. K¨ock,
personal communication, 2012).
The OC yields from the Kafue Flats correspond to 3–17 % of the floodplain’s annual mean estimated primary produc-tion of 260–800 g C m−2yr−1(Ellenbroek, 1987; Blaser, un-published). For the overall carbon budget, other processes like burial, mineralization, burning and particularly grazing are important. For example, burial in the open water areas was estimated to be 25–42 g C m−2yr−1(Zurbr¨ugg,
unpub-lished), and may be as high as 60–90 g C m−2yr−1in the
veg-etated floodplain (Mitsch and Gosselink, 2007).
Comparable OC yields of 8–19 g DOC m−2yr−1 were
found in subcatchments of the Amazon basin (Waterloo et al., 2006; Johnson et al., 2006). A model study by Alvarez-Cobelas (2012) estimated C exports for over 500 catchments ranging from 1.2–57 g DOC m−2yr−1 and 0.4–
74 g POC m−2yr−1. The Zambezi river basin is at the lower end of this range at 1–2 g DOC m−2yr−1 (Harri-son et al., 2005) and 0.3–0.5 g POC m−2yr−1 (Mayorga et al., 2010). Both, the Zambezi model predictions of OC and for ON of 0.14–0.27 kg DON km−2d−1 (Harrison et al., 2005) and 0.30–0.49 kg ON km−2d−1 (Mayorga et al., 2010), show that the yields from the Kafue Flats are very
high and that the system represents a substantial local source of OM to the Kafue and the Zambezi Rivers.
4.2 Source of organic matter
Analogous to the river discharge, the OM transported in the Kafue River can, to a first approximation, come from reser-voir or floodplain sources, or from in-stream processes such as aquatic primary production or river bed erosion. If there were distinct differences in OM characteristics, a shift from reservoir to floodplain OM could be expected, as suggested by the relative contributions of the water masses (Fig. 2).
between the C : N ratios of DOM and POM (P <0.05) and betweenδ13C of DOC and POC across all campaigns (Fig. 8). This indicates that DOM and POM derived from distinctly different sources.
There are several lines of evidence indicating a planktonic source of particulate organic matter: POM had a substantially lower C:N elemental ratio (∼8) than DOM (∼21), soil OM and river sediments (both∼20; Table S1, Supplement). The relative elemental N-enrichment and13C-depletion suggest that POM along the river consisted mainly of phytoplankton sources (Hamilton and Lewis, 1992; Ellis et al., 2012). This finding is consistent with the high C content of the suspended material leaving the ITT reservoir (30–40 wt % C; Fig. 3c). Profiles taken in ITT reservoir between May 2008 and June 2009 (Fig. S4, Supplement) showed epilimneticδ13C-POC signatures closely matching riverine POC in October 2008 and May 2009. Over an annual cycle,δ13C-POC in the reser-voir varied between−25 and−30 ‰ , indicating that some minor terrestrial contribution of fine POM cannot be ex-cluded. In summary, however, there is strong evidence that the POM downstream of the dam originated mainly from the primary production of the reservoir.
By contrast, the composition of dissolved organic matter suggests primarily terrestrial sources: The consistently ele-vated DOC : DON (range 19–23; Fig. 3a) observed during all sampling campaigns and across all sites indicates an N-poor DOM pool, indicating a terrestrial origin, given its el-evated δ13C compatible with a mix of C3 vegetation and
soil/sedimentary OM (Table S1, Supplement). DOM does not indicate any significant contribution from the C4
vegeta-tion fringing the Kafue River (Ellenbroek, 1987), which has a distinct C isotopic signature of−13 ‰ . Several studies in the Amazon River have documented high DOC : DON in re-fractory, degraded DOM from lowland reaches of Amazon tributaries (Aufdenkampe et al., 2007), dominated by fulvic and humic substances (Hedges et al., 2000), or soil-derived DOM (Bernardes et al., 2004). In some of the investigated systems like the Tana River in Kenya (Bouillon et al., 2007) or the Amazon (Raymond and Bauer, 2001), POC was en-riched in13C relative to DOC, and DOC could thus originate from POC degradation. In the Kafue Flats this is unlikely, be-cause of the consistently isotopically heavier DOC (Fig. 7).
Spectroscopic results supported the chemical findings that DOM was primarily of terrestrial origin, but they also re-vealed a microbially derived contribution. The SUVA254
val-ues for the Kafue River of∼3.5 l mg−1m−1are
characteris-tic for humic substances of∼25 % aromaticity (Weishaar et al., 2003). Similarly, the two peaks detected in the EEMs, fall in the range of “humic acid-like” DOM (Peak A), and “ful-vic acid-like” and “hydrophobic acid-like” DOM (Peak C), respectively (Chen et al., 2003). However, the FI of∼1.43 is a median between the terrestrial and microbial end members and indicates contributions of mixed sources to DOM (Cory et al., 2010). Because of the relative stability of terrestrial DOM, the FI is often negatively correlated with DOC
con-C:N ratio -35
-30 -25 -20
May 2010 May 2009 October 2008
0.0 2.0 4.0 6.0
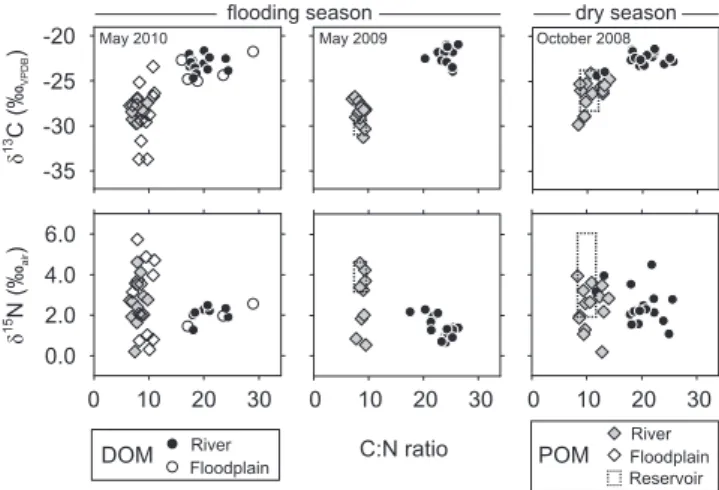
δ
13C (‰
VPDB
)
δ
15N (‰
air
)
0 10 20 30 0 10 20 30 0 10 20 30
DOM FloodplainRiver POM
River Floodplain Reservoir
flooding season dry season
May 2010 May 2009 October 2008
Fig. 8.δ13C andδ15N values of dissolved and particulate organic matter, relative to their C : N ratio. Dashed rectangles in May 2009 and October 2008 indicate the ranges measured in the epilimnion of the upstream ITT reservoir at the time of river sampling (Fig. S4, Supplement). Significant differences (P <0.05) were found be-tween C : N ratios andδ13C of DOM and POM, throughout all sam-pling campaigns, but not forδ15N.
centration (Johnson et al., 2011; Petrone et al., 2011), but no significant correlation between FI or SUVA254and DOC was
found in the Kafue (P >0.05). In other tropical systems, FI ranged from 1.21–1.41 on the Guayana Shield in Venezuela (Yamashita et al., 2010a) and 1.3–3.0 in the lower Amazon basin (Johnson et al., 2011), and in subtropical systems from 1.28–1.47 in the Everglades (Yamashita et al., 2010b) to 2.0– 2.3 in the Yangtze River basin (Chen and Zheng, 2012). The microbial signal in the FI of the Kafue River DOM could be associated with the onset of microbial degradation of mobi-lized terrestrial OM after the peak flow (Johnson et al., 2011; Mladenov et al., 2005) or with the aquatic primary produc-tion in the floodplain.
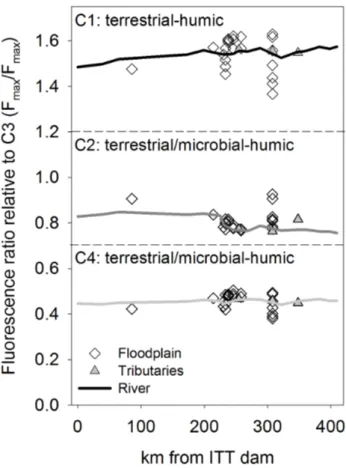
The four components C1–C4 derived from the PARAFAC analysis provided additional evidence for terrestrial DOM with some minor microbial contribution. All components had been identified in previous studies (Fig. S6 and Table S2, Supplement) and were found characteristic for humic-like substances (Stedmon and Markager, 2005). The components C1 and C3 are exclusively from terrestrial sources while C2 and C4 can also have microbial origin. A detailed evaluation of components C2–C4 is given in Ishii and Boyer (2012).
Based on spectroscopic data (SUVA254, EEMs and FI),
old (>1000 yr) OM fraction (Raymond and Bauer, 2001), whereby young OM was found to be preferably mineralized (Mayorga et al., 2005). Large wetlands that are hydrologi-cally connected to the Kafue River upstream of ITT reservoir (Lukanga and Busanga Swamps; total area = 4600 km2)are a potential source of this floodplain-like DOM.
In summary, DOM in the Kafue River was mainly of ter-restrial origin with some microbial contribution, while POM had a distinct phytoplankton signature. Nevertheless, some variation in the chemical characteristics along the channel and between seasons was evident, which is discussed in the next section.
4.3 Longitudinal and seasonal changes in organic
matter characteristics
Contrary to our hypotheses, OM quality indicators showed only small variation along the river, even along reaches of intense river-floodplain exchange and elevated C and N con-centrations and loads. For POM, C : N ratios were rather invariant along the river even after the 3 to 10-fold in-crease in POC and PN loads from floodplain contributions downstream of 300 km (Fig. 7), which caused some varia-tion in the isotopic signatures of riverine POM. We propose that floodplain-derived POM and reservoir POM had simi-larδ13C-POC and C : N, and suggest that floodplain-derived POM was thus dominated by microbial sources, such as phytoplankton or periphyton from the floodplain. While the in-stream production was limited (2–5 µg l−1chlorophylla;
Zurbr¨ugg, unpublished), the consistently13C-depleted POC in the river and along some floodplain transects (Fig. 4) sug-gest that floodplain primary production substantially con-tributed to riverine POM, e.g. from open lagoons on the floodplain, which can be sites of high primary production, even under low nutrient conditions (Cotner et al., 2006).
The small changes in OM characteristics along the river illustrated a complex interplay of terrestrial and microbial sources to the riverine OM pool, which has been observed in other studies (e.g. Tamooh et al., 2012). For example, δ13C-POC and POC:PN between 200 and 300 km showed opposite trends for May 2009 and May 2010 (Fig. 4). Along this reach, the contribution of floodplain water was steadily rising (Fig. 2) and C and N loads, and the distinct increase in the C content of TSS in 2009 (Fig. 3a) imply that flood-plain POM entered the river. Based on the δ13C-POC and POC : PN, the floodplain inflows can be attributed to an in-creasing contribution of13C-depleted and N-rich microbial POM in 2010, and13C-enriched and N-poor POM in 2009 which could originate from terrestrial sources, e.g. plant de-bris or eroded soils. During both flooding campaigns,δ13 C-POC increased by 2.5 ‰ over the first 90 km, which could similarly be explained by erosion of13C-enriched terrestrial matter of lower C content (Fig. 3c). Terrestrial inputs could also cause the concurrent 2 ‰ increase inδ13C-DOC in May 2010. On the other hand, the decrease inδ13C-DOC after
∼250 km during flood season (Fig. 4) requires an inflow of DOC with an averageδ13C of−30.2 ‰, based on a two end-member mixing calculation. This suggests a relative increase in the abundance of isotopically light DOM, produced from microbial sources.
Results from fluorescence spectroscopy revealed further changes in DOM composition along the river transect begin-ning at ∼230 km. The PARAFAC component’s peak fluo-rescence intensity (Fmax)sharply increased (P <0.001)
be-tween 230 and 280 km for all four components (Fig. S7, Supplement). For each component, Fmaxwas moderately to
strongly correlated with DOC concentration (R2=0.68−
0.87), with C3 (“terrestrial-humic”) showing the highest cor-relation. To detect changes in the DOM fluorescence proper-ties along the river, while correcting for the influence of vary-ing DOC concentrations (Stedmon et al., 2003), we present the Fmaxratios of C1, C2 and C4 relative to C3 (Fig. 9). The
sharp decrease in C2 after 230 km coincides with the decline in DO (Zurbr¨ugg et al., 2012), which implies that C2-type DOM is preferentially degraded in the floodplain. Along the floodplain transects, C1 and C4 increased with increasing distance from the river or the shore into the floodplain (Fig. S9, supplement), indicating higher abundance or production of DOM with C1- and C4-like fluorophores in the floodplain. More pronounced differences in the OM characteristics than along the longitudinal sampling transects were detected between wet and dry seasons. The absence of lateral ex-change during the dry season was evident as relatively con-stant DOC and DON concentrations and loads (Fig.7). The differences between wet and dry seasonδ13C-POC were con-sistent with the POM reservoir profiles (Fig. S4, Supple-ment). The marked peak in POC, PN and TSS concentrations between 200 km and 300 km could be explained by resuspen-sion of river sediment because of the small organic fraction in TSS and the lack of floodplain inflows in this area.
4.4 Dam effects on organic matter composition
In the Kafue River basin, terrestrial POM is efficiently re-tained in the ITT reservoir upstream of the Kafue Flats, as indicated by the high sedimentation rates (Kunz et al., 2011) and the elevatedδ13C and C : N in sediments relative to epil-imnetic POM (Table S1, Fig. S4, Supplement). This effec-tive particle retention is reflected in the high abundance of DOC (>80 %) relative to total OC, compared to tropical (61 %) or subtropical (70 %) catchments (Alvarez-Cobelas et al., 2012).
−29 ‰ to−22 ‰. Our flooding season data from the first 90 km showed a less distinct rebound to values of−28 ‰, accompanied by a concentration increase (Fig. 3b), which suggests inputs of POM from the floodplain rather than sig-nificant in-stream mineralization of POM.
Contrary to the particulate fraction, the primary produc-tion in the reservoir had limited influence on the riverine δ13C-DOC, which is consistent with the study from Bouil-lon et al. (2009), where river and reservoirδ13C-DOC were indifferent. This supports the notion that the DOM from the upstream catchment was refractory and not mineralized in significant quantities before entering the Kafue Flats. The lack of a strong microbial DOM signal downstream of ITT dam further suggests that DOM produced in the reservoir was mineralized in situ.
Finally, we observed a 4 ‰ decline inδ13C-POC (Fig. 4) and a concurrent enrichment in C and N of TSS (Fig. 3c) after∼320 km in the dry season. This lowest section of the Kafue Flats is permanently inundated due to the backwaters of the downstream Kafue Gorge reservoir. As the Kafue was flowing through this area,δ13C-POC declined to values typi-cal for the flooding period, (−29 ‰) which may be the result of hydrological exchange with the permanent wetlands and the supply of POM from phytoplankton-dominated sources.
4.5 Processes affecting the nitrogen budget in the Kafue Flats
The nitrogen cycle in tropical floodplains is poorly con-strained compared to temperate systems (e.g. Hoffmann et al., 2011; Olde Venterink et al., 2003). Our data indicate a large annual N export from the Kafue Flats mostly in the form of refractory DON. We hypothesized that high N-fixation rates are required to compensate the N losses. Com-bining N fluxes andδ15N signatures, completed by flux es-timates from the literature, we obtained a putative N bud-get over the flooded area and constrained the N-fixation rates required to balance the N deficit. The N fluxes were calculated using our own data and literature values for the Kafue Flats. Denitrification was approximated using con-servative rates from a wide range of rivers and floodplains (of 1–4 g N m−2yr−1, Table S3, Supplement). For the
up-stream reservoir, the fluxes have been described by Kunz et al. (2011), who proposed N-fixation rates of 12 g N m−2yr−1
to account for the N losses through export, sediment accumu-lation and denitrification in the reservoir (Fig. 10a).
For the Kafue Flats, budget calculations revealed an N deficit of 15 500–22 100 t N yr−1, which was 5–7 times
higher than the N input from the reservoir and equal to areal rates of 58–82 µmol N m−2h−1or 7–10 g N m−2yr−1, respectively (Fig. 10b). Previous studies in tropical flood-plains found N-fixation rates of several g N m−2yr−1 (Cleve-land et al., 1999), through symbiotic or asymbiotic fixation by free-floating or attached cyanobacteria (Kern and Dar-wich, 2003). The 15N isotope mass balance of the Kafue
Fig. 9. Ratios of components identified by PARAFAC analysis. Components C1, C2, and C4 are shown relative to C3 along the river, in floodplain and tributaries, measured in May 2010.
Flats supports the hypothesis of N-fixation being the main N source (Fig. 10b). The isotope balance requires aδ15N of 0.8–1.2 ‰ for the calculated N deficit, which are values close to the 0 ‰ expected from the fixation of atmospheric N (Mar-tinelli et al., 1992).
The N stable isotope data from the dissolved and partic-ulate fraction provide additional evidence for N-fixation in the Kafue Flats. For the flooding campaigns,δ15N-PN after the dam reflected the epilimnetic signature of∼4 ‰. During the floodplain transit,δ15N-PN gradually approximated the fairly constantδ15N-TDN signal of∼2 ‰ (Fig. 4). This shift towards 0 ‰ could imply the increasing contribution of non-symbiotic N-fixers along the river (Gu and Alexander, 1993; Rejmankova et al., 2004), even though the floodplainδ15 N-PN showed considerable heterogeneity (Fig. 4). Theδ15 N-PN of∼2 ‰ also persisted during the dry season.
Itezhi-Tezhi reservoir from Kunz et al. (2011) Kafue Flats
dam wall Denitrification
2400 t N Kafue River inflow
39 000 - 211 000 t C 5900 - 9900 t N
Sedimentary OM: δ13C = -23.8‰ C:N~12
Aerial deposition4) 400 t N δ15N = 2.3‰
Kafue River outflow3) 136 000 t C 4900 t N Kafue River
inflow3) 76 000 t C 3100 t N
Denitrification5) 2200 - 8800 t N
Max. flooded area2) 2200 km2
Terrestrial DOM
Terrestrial POM
Algal/ microbial
DOM Phytoplankton
DOC:DON7) = 21.9 POC:PN8) = 10.2±2.4
δ15N-TDN7) = 1.9‰
δ15N-PN8) = 3.5±0.8‰ Sediment
accumulation 16 000 t C 1500 t N
a
b
Deficit 15 520 - 22 120 t N 58 - 82 µmol N m-2h-1
7 - 10 g N m-2yr-1
δ15N = 0.8 - 1.2‰
Fire6) 920 t N Annual NPP1) ~56 000 t N
DOC:DON7) = 19.7 POC:PN8) = 9.6±1.4
δ15N-TDN7) = 1.3‰
δ15N-PN8) = 4.0±2.4‰ Floodplain
mobilization3) 60 000 t C 1800 t N
Burial4) 11 000 t N δ15N = 0.6‰ Dam release
48 000 - 173 000 t C 3000 - 5000 t N N-fixation
>3000 t N
Fig. 10. (a)Schematic illustration of the annual C and N fluxes in ITT reservoir from Kunz et al. (2011).(b)System-scale N balance of the Kafue Flats based on our own data from 2008–2010 and literature values: (1) Estimated based on Ellenbroek (1987); (2) data from the inundation model of Meier et al. (2010); (3) data from Wamulume et al. (2011); (4) deposition based on trap data, burial from sediment cores (Zurbr¨ugg, unpublished); (5) estimated from literature data (Table S3, Supplement); (6) burnt areas from Munyati (2000); (7) data from October 2008, May 2009, and May 2010; (8) mean±SD from annual sampling campaign (Fig. S3, Supplement).
Schlarbaum et al. (2011) who found variation of more than 10 ‰ due to release and uptake of DON in a temperate estu-ary. Compensating N isotopic fractionation that would result in no net change in δ15N-TDN, e.g. from concomitant re-lease, uptake, and degradation along the main channel cannot be completely excluded, but is considered unlikely (Knapp et al., 2005).
The high abundance of periphyton on inundated vegeta-tion and the high diversity and spreading of N-fixing plants in the floodplain (Ellenbroek, 1987) indicate that N-fixation also occurred through attached and symbiotic fixers. N that was fixed through trees and shrubs outside the flooded area, and deposited through seasonal tributaries could be an addi-tional N source to the floodplain. Complementary measure-ments of N pools across the Kafue Flats fell in a relatively narrow range (−1 to 4 ‰; Table S1, Supplement). This range is within the data range reported for the Amazon floodplains (Aufdenkampe et al., 2007; Hedges et al., 2000; Bernardes et al., 2004) and might be characteristic for such systems.
5 Conclusions
Intense river-floodplain exchange during the flooding period caused a net export of 69–111 kg C km−2d−1in the form of
DOC from the Kafue Flats, which exceeded specific export rates predicted for the Amazon or the Congo River basins by a factor of 5 or more (5–14 kg C km−2d−1; Harrison et al., 2005; Mayorga et al., 2010). During the dry season, the Kafue Flats were a net sink of OM, but during the wet season and over an annual cycle, C and N export exceeded import. Significant N losses through export, burial and denitrification caused an annual N deficit of 15 500–22 100 t N which must
be balanced by high N-fixation rates of 7–10 g N m−2yr−1 (Fig. 10b).
Stable isotope and spectroscopic analyses showed that DOM in the Kafue River was dominated by terrestrial sources along the entire reach, despite several months res-idence time in the upstream reservoir. River DOM charac-teristics did not vary substantially as floodplain waters in-creased the DOC and DON loads by a factor of 3, which indi-cates that DOM leaving the reservoir was likely from refrac-tory terrestrial sources. The exported POM was clearly dis-tinguishable from DOM by its overall lower C : N ratio and more negative δ13C. Both indicators suggest planktonic or microbial sources for POM from the reservoir and floodplain primary production. Marked differences between the flood-ing and the dry season showed that the in-stream processes were small compared to the organic matter pulses from the floodplain.
Our study underlines how intense river-floodplain ex-change fosters high DOM exports to a tropical river basin. In contrast to forested systems like the Amazon, in the flooded grassland ecosystem of the Kafue Flats, the aquatic primary production from the floodplain was a more important POM source than plant debris or soil/sedimentary OM. Finally, the upstream reservoir had a strong effect on the quality of POM by replacing terrestrial particles with OM from au-tochthonous sources, while its impact on the DOM pool was small.
Supplementary material related to this article is
Acknowledgements. The authors thank Jason Wamulume, Grif-fin Shanungu, Manuel Kunz, Wilma Blaser, and Event Ngandu, and the ZAWA wildlife officers for assistance during field work; Mark Rollog (University of Basel), Ruth Stierli (Eawag), Kate Ashe, the ETHZ Soil Chemistry and Environmental Chem-istry groups for laboratory support, Britt Peterson (ETHZ) for assistance with excitation-emission spectroscopy analyses, Linda Jørgensen (University of Copenhagen) and Dolly Kothawala (University of Uppsala) for support with PARAFAC modeling and interpretation. This study was supported by the following Zambian partners and agencies: Imasiku Nyambe (University of Zambia), Zambia Wildlife Authority, Zambia Electricity Supply Corporation (ZESCO), Zambezi River Authority, and Department of Water Affairs. We also acknowledge the helpful comments of the two anonymous reviewers and the handling editor, Steven Bouillon, which significantly improved the manuscript. Funding was provided by the Competence Center for Environment and Sustainability (CCES) of the ETH domain, the Swiss National Science Foundation (Grant No. 128707), and Eawag.
Edited by: S. Bouillon
References
Aalto, R., Maurice-Bourgoin, L., Dunne, T., Montgomery, D. R., Nittrouer, C. A., and Guyot, J. L.: Episodic sediment accumula-tion on Amazonian flood plains influenced by El Ni˜no/Southern Oscillation, Nature, 425, 493–497, doi:10.1038/nature02002, 2003.
Alin, S. R., Aalto, R., Goni, M. A., Richey, J. E., and Dietrich, W. E.: Biogeochemical characterization of carbon sources in the strickland and fly rivers, Papua New Guinea, J. Geophys. Res.-Earth Surface, 113, F01s05, doi:10.1029/2006jf000625, 2008. Alvarez-Cobelas, M., Angeler, D. G., Sanchez-Carrillo, S.,
and Almendros, G.: A worldwide view of organic car-bon export from catchments, Biogeochemistry, 107, 275–293, doi:10.1007/s10533-010-9553-z, 2012.
Aufdenkampe, A. K., Mayorga, E., Hedges, J. I., Llerena, C., Quay, P. D., Gudeman, J., Krusche, A. V., and Richey, J. E.: Organic matter in the Peruvian headwaters of the Amazon: Compositional evolution from the Andes to the lowland Amazon mainstem, Org. Geochem., 38, 337–364, doi:10.1016/j.orggeochem.2006.06.003, 2007.
Battin, T. J., Luyssaert, S., Kaplan, L. A., Aufdenkampe, A. K., Richter, A., and Tranvik, L. J.: The boundless carbon cycle, Na-ture Geosci., 2, 598–600, doi:10.1038/ngeo618, 2009.
Berman, T. and Bronk, D. A.: Dissolved organic nitrogen: a dy-namic participant in aquatic ecosystems, Aquat. Microb. Ecol., 31, 279–305, 2003.
Bernardes, M. C., Martinelli, L. A., Krusche, A. V., Gudeman, J., Moreira, M., Victoria, R. L., Ometto, J., Ballester, M. V. R., Aufdenkampe, A. K., Richey, J. E., and Hedges, J. I.: Riverine organic matter composition as a function of land use changes, Southwest Amazon, Ecol. Appl., 14, S263–S279, 2004. Bouillon, S., Dehairs, F., Schiettecatte, L. S., and Borges, A. V.:
Biogeochemistry of the Tana estuary and delta (northern Kenya), Limnol. Oceanogr., 52, 46–59, 2007.
Bouillon, S., Abril, G., Borges, A. V., Dehairs, F., Govers, G., Hughes, H. J.,Merckx, R., Meysman, F. J. R., Nyunja, J.,
Os-burn, C., and Middelburg, J. J.: Distribution, origin and cycling of carbon in the Tana River (Kenya): a dry season basin-scale sur-vey from headwaters to the delta, Biogeosciences, 6, 2475–2493, doi:10.5194/bg-6-2475-2009, 2009.
Bourbonnais, A., Lehmann, M. F., Waniek, J. J., and Schulz-Bull, D. E.: Nitrate isotope anomalies reflect N2fixation in the Azores Front region (subtropical NE Atlantic), J. Geophys. Res.-Oceans, 114, doi:10.1029/2007jc004617, 2009.
Braman, R. S. and Hendrix, S. A.: Nanogram nitrite and nitrate de-termination in environmental and biological materials by vana-dium(III) reduction with chemiluminescence detection, Anal. Chem., 61, 2715–2718, 1989.
Bronk, D. A., Lomas, M. W., Glibert, P. M., Schukert, K. J., and Sanderson, M. P.: Total dissolved nitrogen analysis: compar-isons between the persulfate, UV and high temperature oxidation methods, Mar. Chem., 69, 163–178, 2000.
Casciotti, K. L., Sigman, D. M., Hastings, M. G., B¨ohlke, J. K., and Hilkert, A.: Measurement of the oxygen isotopic composition of nitrate in seawater and freshwater using the denitrifier method, Anal. Chem., 74, 4905–4912, 2002.
Chen, F. J. and Jia, G. D.: Spatial and seasonal variations in δ13C and δ15N of particulate organic matter in a dam-controlled subtropical river, River Res. Appl., 25, 1169–1176, doi:10.1002/rra.1225, 2009.
Chen, H. and Zheng, B. H.: Characterizing natural dissolved organic matter in a freshly submerged catchment (Three Gorges Dam, China) using UV absorption, fluorescence spec-troscopy and PARAFAC, Water Sci. Technol., 65, 962–969, doi:10.2166/wst.2012.939, 2012.
Chen, W., Westerhoff, P., Leenheer, J. A., and Booksh, K.: Fluores-cence excitation-emission matrix regional integration to quantify spectra for dissolved organic matter, Environ. Sci. Technol., 37, 5701–5710, doi:10.1021/es034354c, 2003.
Cleveland, C. C., Townsend, A. R., Schimel, D. S., Fisher, H., Howarth, R. W., Hedin, L. O., Perakis, S. S., Latty, E. F., Von Fischer, J. C., Elseroad, A., and Wasson, M. F.: Global patterns of terrestrial biological nitrogen (N2)fixation in natural ecosystems, Global Biogeochem. Cy., 13, 623–645, doi:10.1029/1999gb900014, 1999.
Coble, P. G.: Characterization of marine and terrestrial DOM in seawater using excitation emission matrix spectroscopy, Mar. Chem., 51, 325–346, 1996.
Cory, R. M., Miller, M. P., McKnight, D. M., Guerard, J. J., and Miller, P. L.: Effect of instrument-specific response on the analy-sis of fulvic acid fluorescence spectra, Limnol. Oceanogr.-Meth., 8, 67–78, 2010.
Cotner, J. B., Montoya, J. V., Roelke, D. L., and Winemiller, K. O.: Seasonally variable riverine production in the Venezuelan llanos, J. North Am. Benthol. Soc., 25, 171–184, doi:10.1899/0887-3593(2006)25[171:SVRPIT]2.0.CO;2, 2006.
Ellenbroek, G. A.: Ecology and productivity of an African wetland system. Geobotany 9, Dr. W. Junk, Dordrecht, 267 pp., 1987. Ellis, E. E., Richey, J. E., Aufdenkampe, A. K., Krusche, A. V.,
Quay, P. D., Salimon, C., and da Cunha, H. B.: Factors con-trolling water-column respiration in rivers of the central and southwestern Amazon Basin, Limnol. Oceanogr., 57, 527–540, doi:10.4319/lo.2012.57.2.0527, 2012.
doi:10.1038/ngeo1293, 2011.
Grasshoff, K., Kremling, K., and Ehrhardt, M.: Methods of Sea-water Analysis, Third ed., Wiley-VCH, Weinheim, New York, Chichester Brisbane, Singapore, Tokyo, 632 pp., 1999.
Gu, B. and Alexander, V.: Estimation of N2fixation based on dif-ferences in the natural-abundance of15N among fresh-water N2 -fixing and non-N2-fixing algae, Oecologia, 96, 43–48, 1993. Hamilton, S. K. and Lewis, W. M.: Stable carbon and nitrogen
iso-topes in algae and detritus from the Orinoco River floodplain, Venezuela, Geochim. Cosmochim. Ac., 56, 4237–4246, 1992. Harrison, J. A., Caraco, N., and Seitzinger, S. P.: Global patterns
and sources of dissolved organic matter export to the coastal zone: Results from a spatially explicit, global model, Global Bio-geochem. Cy., 19, Gb4s04 doi:10.1029/2005gb002480, 2005. Hedges, J. I., Mayorga, E., Tsamakis, E., McClain, M. E.,
Auf-denkampe, A., Quay, P., Richey, J. E., Benner, R., Opsahl, S., Black, B., Pimentel, T., Quintanilla, J., and Maurice, L.: Organic matter in Bolivian tributaries of the Amazon River: A compari-son to the lower mainstream, Limnol. Oceanogr., 45, 1449–1466, 2000.
Hoffmann, C. C., Kronvang, B., and Audet, J.: Evaluation of nutri-ent retnutri-ention in four restored Danish riparian wetlands, Hydrobi-ologia, 674, 5–24, doi:10.1007/s10750-011-0734-0, 2011. Hunsinger, G. B., Mitra, S., Findlay, S. E. G., and Fischer, D. T.:
Wetland-driven shifts in suspended particulate organic matter composition of the Hudson River estuary, New York, Limnol. Oceanogr., 55, 1653–1667, 2010.
Ishii, S. K. L. and Boyer, T. H.: Behavior of reoccurring PARAFAC components in fluorescent dissolved organic matter in natural and engineered systems: A critical review, Environ. Sci. Tech-nol., 46, 2006–2017, doi:10.1021/es2043504, 2012.
Johnson, M. S., Lehmann, J., Selva, E. C., Abdo, M., Riha, S., and Couto, E. G.: Organic carbon fluxes within and streamwater ex-ports from headwater catchments in the southern Amazon, Hy-drol. Process., 20, 2599–2614, doi:10.1002/hyp.6218, 2006. Johnson, M. S., Couto, E. G., Abdo, M., and Lehmann, J.:
Fluo-rescence index as an indicator of dissolved organic carbon qual-ity in hydrologic flowpaths of forested tropical watersheds, Bio-geochemistry, 105, 149–157, doi:10.1007/s10533-011-9595-x, 2011.
Kern, J. and Darwich, A.: The role of periphytic N2fixation for stands of macrophytes in the whitewater floodplain (varzea), Amazoniana-Limnologia Et Oecologia Regionalis Systemae Fluminis Amazonas, 17, 361–375, 2003.
Knapp, A. N., Sigman, D. M., and Lipschultz, F.: N isotopic com-position of dissolved organic nitrogen and nitrate at the Bermuda Atlantic time-series study site, Global Biogeochem. Cy., 19, GB1018, doi:10.1029/2004gb002320, 2005.
Kunz, M. J., W¨uest, A., Wehrli, B., Landert, J., and Senn, D. B.: Impact of a large tropical reservoir on riverine transport of sedi-ment, carbon, and nutrients to downstream wetlands, Water Re-sour. Res., 47, W12531, doi:10.1029/2011WR010996, 2011. Lakowicz, J. R.: Principles of Fluorescence Spectroscopy, 3rd Edn.,
Springer, New York, 954 pp., 2006.
Martinelli, L. A., Victoria, R. L., Trivelin, P. C. O., Devol, A. H., and Richey, J. E.: N-15 natural abundance in plants of the Ama-zon River floodplain and potential atmospheric N2fixation, Oe-cologia, 90, 591–596, 1992.
Mayorga, E., Aufdenkampe, A. K., Masiello, C. A., Krusche, A. V., Hedges, J. I., Quay, P. D., Richey, J. E., and Brown, T. A.: Young organic matter as a source of carbon diox-ide outgassing from Amazonian rivers, Nature, 436, 538–541, doi:10.1038/nature03880, 2005.
Mayorga, E., Seitzinger, S. P., Harrison, J. A., Dumont, E., Beusen, A. H. W., Bouwman, A. F., Fekete, B. M., Kroeze, C., and Van Drecht, G.: Global Nutrient Export from WaterSheds 2 (NEWS 2): Model development and implementation, Environ. Mod-ell. Software, 25, 837–853, doi:10.1016/j.envsoft.2010.01.007, 2010.
McJannet, D., Wallace, J., Keen, R., Hawdon, A., and Kemei, J.: The filtering capacity of a tropical riverine wetland: II. Sediment and nutrient balances, Hydrol. Process., 26, 53–72, doi:10.1002/hyp.8111, 2012.
McKnight, D. M., Boyer, E. W., Westerhoff, P. K., Doran, P. T., Kulbe, T., and Andersen, D. T.: Spectrofluorometric character-ization of dissolved organic matter for indication of precursor organic material and aromaticity, Limnol. Oceanogr., 46, 38–48, 2001.
Meier, P., Wang, H., Milzow, C., and Kinzelbach, W.: Remote sens-ing for hydrological modelsens-ing of seasonal wetlands – Concepts and applications, ESA Living Planet Symposium, 28 June–2 July 2010, Bergen, Norway, 2010,
Miller, M. P. and McKnight, D. M.: Comparison of seasonal changes in fluorescent dissolved organic matter among aquatic lake and stream sites in the Green Lakes Valley, J. Geophys. Res.-Biogeosci., 115, doi:10.1029/2009jg000985, 2010.
Mitsch, W. J. and Gosselink, J. G.: Wetlands, 4th Edn., John Wiley & Sons Inc., New Jersey, USA, 582 pp., 2007.
Mladenov, N., McKnight, D. M., Wolski, P., and Ramberg, L.: Ef-fects of annual flooding on dissolved organic carbon dynamics within a pristine wetland, the Okavango Delta, Botswana, Wet-lands, 25, 622–638, 2005.
Mumba, M., and Thompson, J. R.: Hydrological and ecological im-pacts of dams on the Kafue Flats floodplain system, southern Zambia, Phys. Chem. Earth, 30, 442–447, 2005.
Munyati, C.: Wetland change detection on the Kafue Flats, Zam-bia, by classification of a multitemporal remote sensing image dataset, Int. J. Remote Sens., 21, 1787–1806, 2000.
Noe, G. B. and Hupp, C. R.: Retention of riverine sediment and nutrient loads by coastal plain floodplains, Ecosystems, 12, 728– 746, doi:10.1007/s10021-009-9253-5, 2009.
Olde Venterink, H., Wiegman, F., Van der Lee, G. E. M., and Ver-maat, J. E.: Role of active floodplains for nutrient retention in the river Rhine, J. Environ. Qual., 32, 1430–1435, 2003.
Petrone, K. C., Fellman, J. B., Hood, E., Donn, M. J., and Grier-son, P. F.: The origin and function of dissolved organic matter in agro-urban coastal streams, J. Geophys. Res.-Biogeosci., 116, 13, G01028, doi:10.1029/2010jg001537, 2011.
Raymond, P. A. and Bauer, J. E.: Riverine export of aged terrestrial organic matter to the North Atlantic Ocean, Nature, 409, 497– 500, 2001.
Rejmankova, E., Komarkova, J., and Rejmanek, M.: δ15N as an indicator of N2-fixation by cyanobacterial mats in tropical marshes, Biogeochemistry, 67, 353–368, 2004.
1989.
Richey, J. E., Hedges, J. I., Devol, A. H., Quay, P. D., Victoria, R., Martinelli, L., and Forsberg, B. R.: Biogeochemistry of carbon in the Amazon River, Limnol. Oceanogr., 35, 352–371, 1990. Schlarbaum, T., D¨ahnke, K., and Emeis, K.: Dissolved and
partic-ulate reactive nitrogen in the Elbe River/NW Europe: a 2-yr N-isotope study, Biogeosciences, 8, 3519–3530, doi:10.5194/bg-8-3519-2011, 2011.
Schwendenmann, L., and Veldkamp, E.: The role of dissolved or-ganic carbon, dissolved oror-ganic nitrogen, and dissolved inoror-ganic nitrogen in a tropical wet forest ecosystem, Ecosystems, 8, 339– 351, doi:10.1007/s10021-003-0088-1, 2005.
Sigman, D. M., Casciotti, K. L., Andreani, M., Barford, C., Galanter, M., and B¨ohlke, J. K.: A bacterial method for the nitro-gen isotopic analysis of nitrate in seawater and freshwater, Anal. Chem., 73, 4145–4153, 2001.
Sol´orzano, L. and Sharp, J. H.: Determination of total dissolved ni-trogen in natural waters, Limnol. Oceanogr., 25, 751–754, 1980. Spencer, R. G. M., Hernes, P. J., Ruf, R., Baker, A., Dyda, R. Y., Stubbins, A., and Six, J.: Temporal controls on dissolved organic matter and lignin biogeochemistry in a pristine tropical river, Democratic Republic of Congo, J. Geophys. Res.-Biogeosci., 115, G03013, doi:10.1029/2009jg001180, 2010.
Stedmon, C. A., Markager, S., and Bro, R.: Tracing dissolved organic matter in aquatic environments using a new ap-proach to fluorescence spectroscopy, Mar. Chem., 82, 239–254, doi:10.1016/s0304-4203(03)00072-0, 2003.
Stedmon, C. A., and Markager, S.: Resolving the variability in dis-solved organic matter fluorescence in a temperate estuary and its catchment using PARAFAC analysis, Limnol. Oceanogr., 50, 686–697, 2005.
Stedmon, C. A. and Bro, R.: Characterizing dissolved organic mat-ter fluorescence with parallel factor analysis: a tutorial, Limnol. Oceanogr.-Meth., 6, 572–579, 2008.
Tamooh, F., Van den Meersche, K., Meysman, F., Marwick, T. R., Borges, A. V., Merckx, R., Dehairs, F., Schmidt, S., Nyunja, J., and Bouillon, S.: Distribution and origin of suspended matter and organic carbon pools in the Tana River Basin, Kenya, Biogeo-sciences, 9, 2905–2920, doi:10.5194/bg-9-2905-2012, 2012.
Tremblay, L. and Benner, R.: Organic matter diagenesis and bacte-rial contributions to detrital carbon and nitrogen in the Amazon River system, Limnol. Oceanogr., 54, 681–691, 2009.
Wamulume, J., Landert, J., Zurbr¨ugg, R., Nyambe, I., Wehrli, B., and Senn, D. B.: Exploring the hydrology and biogeochemistry of the dam-impacted Kafue River and Kafue Flats (Zambia), Phys. Chem. Earth, 36, 775–788, doi:10.1016/j.pce.2011.07.049, 2011.
Waterloo, M. J., Oliveira, S. M., Drucker, D. P., Nobre, A. D., Cuartas, L. A., Hodnett, M. G., Langedijk, I., Jans, W. W. P., Tomasella, J., de Araujo, A. C., Pimentel, T. P., and Estrada, J. C. M.: Export of organic carbon in run-off from an Amazonian rain-forest blackwater catchment, Hydrol. Process., 20, 2581–2597, doi:10.1002/hyp.6217, 2006.
Weishaar, J. L., Aiken, G. R., Bergamaschi, B. A., Fram, M. S., Fujii, R., and Mopper, K.: Evaluation of specific ultraviolet ab-sorbance as an indicator of the chemical composition and reactiv-ity of dissolved organic carbon, Environ. Sci. Technol., 37, 4702– 4708, doi:10.1021/es030360x, 2003.
Wiegner, T. N., Tubal, R. L., and MacKenzie, R. A.: Bioavailabil-ity and export of dissolved organic matter from a tropical river during base- and stormflow conditions, Limnol. Oceanogr., 54, 1233–1242, doi:10.4319/lo.2009.54.4.1233, 2009.
Yamashita, Y., Maie, N., Briceno, H., and Jaff´e, R.: Optical char-acterization of dissolved organic matter in tropical rivers of the Guayana Shield, Venezuela, J. Geophys. Res.-Biogeosci., 115, G00f10, doi:10.1029/2009jg000987, 2010a.
Yamashita, Y., Scinto, L. J., Maie, N., and Jaff´e, R.: Dissolved organic matter characteristics across a subtropical wetland’s landscape: Application of optical properties in the assess-ment of environassess-mental dynamics, Ecosystems, 13, 1006–1019, doi:10.1007/s10021-010-9370-1, 2010b.
Ziegler, S. E. and Brisco, S. L.: Relationships between the isotopic composition of dissolved organic carbon and its bioavailabil-ity in contrasting Ozark streams, Hydrobiologia, 513, 153–169, doi:10.1023/B:hydr.0000018180.54292.47, 2004.