Hydrogenase-3 Contributes to Anaerobic Acid Resistance
of
Escherichia coli
Ken Noguchi, Daniel P. Riggins, Khalid C. Eldahan, Ryan D. Kitko, Joan L. Slonczewski*
Department of Biology, Kenyon College, Gambier, Ohio, United States of America
Abstract
Background:Hydrogen production by fermenting bacteria such asEscherichia colioffers a potential source of hydrogen
biofuel. Because H2production involves consumption of 2H+, hydrogenase expression is likely to involve pH response and regulation. Hydrogenase consumption of protons inE. coli has been implicated in acid resistance, the ability to survive exposure to acid levels (pH 2–2.5) that are three pH units lower than the pH limit of growth (pH 5–6). Enhanced survival in acid enables a larger infective inoculum to pass through the stomach and colonize the intestine. Most acid resistance mechanisms have been defined using aerobic cultures, but the use of anaerobic cultures will reveal novel acid resistance mechanisms.
Methods and Principal Findings:We analyzed the pH regulation of bacterial hydrogenases in live cultures ofE. coliK-12
W3110. During anaerobic growth in the range of pH 5 to 6.5,E. coliexpresses three hydrogenase isoenzymes that reversibly oxidize H2to 2H+. Anoxic conditions were used to determine which of the hydrogenase complexes contribute to acid resistance, measured as the survival of cultures grown at pH 5.5 without aeration and exposed for 2 hours at pH 2 or at pH 2.5. Survival of all strains in extreme acid was significantly lower in low oxygen than for aerated cultures. Deletion ofhyc
(Hyd-3) decreased anoxic acid survival 3-fold at pH 2.5, and 20-fold at pH 2, but had no effect on acid survival with aeration. Deletion ofhyb(Hyd-2) did not significantly affect acid survival. The pH-dependence of H2production and consumption was tested using a H2-specific Clark-type electrode. Hyd-3-dependent H2production was increased 70-fold from pH 6.5 to 5.5, whereas Hyd-2-dependent H2consumption was maximal at alkaline pH. H2production, was unaffected by a shift in external or internal pH. H2production was associated withhycEexpression levels as a function of external pH.
Conclusions:Anaerobic growing cultures ofE. coligenerate H2via Hyd-3 at low external pH, and consume H2via Hyd-2 at
high external pH. Hyd-3 proton conversion to H2is required for acid resistance in anaerobic cultures ofE. coli.
Citation:Noguchi K, Riggins DP, Eldahan KC, Kitko RD, Slonczewski JL (2010) Hydrogenase-3 Contributes to Anaerobic Acid Resistance ofEscherichia coli. PLoS ONE 5(4): e10132. doi:10.1371/journal.pone.0010132
Editor:Paul Cobine, Auburn University, United States of America
ReceivedFebruary 5, 2010;AcceptedMarch 23, 2010;PublishedApril 12, 2010
Copyright:ß2010 Noguchi et al. This is an open-access article distributed under the terms of the Creative Commons Attribution License, which permits unrestricted use, distribution, and reproduction in any medium, provided the original author and source are credited.
Funding:This work was supported by grant MCB-0644167 from the National Science Foundation. The funders had no role in study design, data collection and analysis, decision to publish, or preparation of the manuscript.
Competing Interests:The authors have declared that no competing interests exist. * E-mail: slonczewski@kenyon.edu
Introduction
Bacterial hydrogen production by hydrogenase is studied as a promising source of clean alternative energy [1,2]. In the intestinal tract, H2 produced from bacteria fermentation enables methane
production by methanogens [3] and contributes to the growth of pathogens such as Salmonella enterica and Helicobacter pylori [4,5]. Hydrogenase in Escherichia coli has been suggested to decrease cytoplasmic acid stress and contribute to its acid resistance systems [6–9]. Because E. coli need to survive the harshly acidic environment of the stomach to colonize the intestine, acid resistance systems enhance the infective ability of pathogenicE. coli[10–12].
Several mechanisms have been characterized that enhance survival at pH 2.5 and below [13], such as the amino acid-dependent glutamate and arginine decarboxylases [14–16]. Genes encoding these enzymes and transporters are up-regulated during growth in moderate acid [7,17,18]. Most of the above studies ofE. coli acid resistance address aerated cultures. In natural environ-ments such as the gastrointestinal tract, however, enteric bacteria
experience low oxygen. Oxygen limitation and acid stress occur in the microaerobic environment of the stomach [19], which harbors many obligate and facultative anaerobic organisms such as ClostridiumandVeillonellaspecies [20,21]. InSalmonella typhimurium, anoxic conditions are required for expression of the acid-resistance component arginine decarboxylase [22]. Hayes et al. (2006) showed that all four hydrogenase isoenzymes are upregulated by acid under oxygen-limited conditions [7].
The four isoforms of hydrogenase catalyze the reversible oxidation of molecular hydrogen to 2H+
. However, each hydrogenase functions primarily in one direction. Hydrogenase-1 (Hyd-1, encoded byhya) and hydrogenase-2 (Hyd-2, encoded by hyb) are energy-conserving respiratory pathways consuming H2
with Hyd-2 acting as the primary consumption hydrogenase [23–25]. Hydrogenase-3 (Hyd-3) is the primary production hydrogenase [26]; along with formate dehydrogenase (FDH-H), Hyd-3 makes up the formate hydrogen lyase (FHL) complex, which breaks down formate to carbon dioxide and H2[6,27–29].
[26,30,31]. Mutants deleted forhypFmutant lacks all hydrogenase activity [8,32]. AhypFmutant shows decreased acid resistance in partly aerated cultures [7].
Because the function of hydrogenases is intricately connected to metabolic pathways, the pH-dependence of H2consumption must
be measured in vivo. Previous studies of H2 production of
hydrogenase mutants have been based on harvested cell concentrates, often with addition of 100 mM formate to increase FHL activity, although such high formate concentration is incompatible with growth [9,25,33]. Our electrode-based methods were applied to live, growing cultures. Since H2production was
hypothesized as a cellular mechanism for acid resistance, we observed the pH-dependent activity of hydrogenases under the conditions where acid resistance is induced (anaerobic growth at low external pH). We also characterized how pH regulates H2
production and consumption via each hydrogenase complex, determining the significance of each at low and high pH.
Results
H2production as a function of pH
In order to test the role of hydrogenases at low pH, we observed E. coli H2 production across a range of pH values in strains
W3110, JLS0920 (lacks Hyd-1), JLS0921 (lacks Hyd-2), and JLS0922 (lacks Hyd-3). H2levels were measured using a Unisense
electrode, as described under Materials & Methods. Our results using strain W3110 show that H2 production increased as pH
decreased (Fig. 1). In strain JLS0921, lacking the primary consumption hydrogenase (Hyd-2), H2gas was produced without
consumption. In this strain a similar pattern of increasing H2
production with decreasing pH was observed (Fig. 1B), and at each pH H2was produced faster than in the parental strain (Fig. 1A).
By contrast, strain JLS0922, lacking the primary production hydrogenase Hyd-3, showed virtually no H2production at any pH
(Fig. 1C). Strain JLS0920, lacking Hyd-1, showed no difference in H2production from the wild-type (data not shown).
The traces of H2concentration (mM) over time were converted
into production rates by taking the slope from 2–5 minutes (Fig. 2). In strain W3110, H2production rate increased sharply at pH 5.5,
showing a 70-fold increase from external pH 6.5 to 5.5.
Meanwhile, above pH 6.5 H2production was not detected (data
not shown). Overall, conversion of protons to H2by Hyd-3 was
greatly increased at acidic pH.
In order to determine whether the change in H2production was
due to a change in enzymatic activity, W3110 was assayed for H2
production and then shifted to alternate pH values. Cells grown to mid-late log phase at pH 5.5 were assayed for 6 minutes before shifting the external pH to 6.5 and cells grown at pH 6.5 were shifted to external pH 5.5. Neither shift changed the H2
Figure 1. Effect of pH on the H2production by W3110,DhybC, andDhycE.The lines represent traces of H2concentration as a function of time. Before time 0, the cultures were sparged with 100% N2in order to eliminate any residual H2in the culture. Anaerobic cultures of W3110 (A), DhybC(B), andDhycE(C) were grown to log phase at pH 5.5, pH 6, and pH 6.5 and assayed for H2production as stated in the Materials and Methods. Lines are representative samples of n = 3.
doi:10.1371/journal.pone.0010132.g001
Figure 2. Effect of pH on the H2 production rate of W3110,
DhybC,andDhycE.Anaerobic cultures were grown to log phase at pH 5.5 (black bars), 6 (hatched bars), and 6.5 (white bars) and assayed for H2 production as described in the Materials and Methods. H2 production rate was calculated as stated in the Materials and Methods. Error bars represent SEM, n = 3; those that were too small to see clearly were omitted. The experiment was conducted twice.
production (data not shown). Additionally, to assess whether a change in internal pH would affect Hyd-3 activity, benzoate was added to depress cytoplasmic pH. Benzoate is a permeant weak acid that partly equilibrates internal and external pH by dissociating to release protons in the cytoplasm. At external pH 5.5, 5 mM benzoate lowers the cytoplasmic pH from approximately pH 7.5 to pH 6 [34]. Benzoate did not affect H2
production at pH 5.5 or pH 6.5 during the 6 min observation
after addition (data not shown). Neither changes in external pH nor cytoplasmic pH affected H2production, so the change in H2
production was not caused by a change in enzymatic activity.
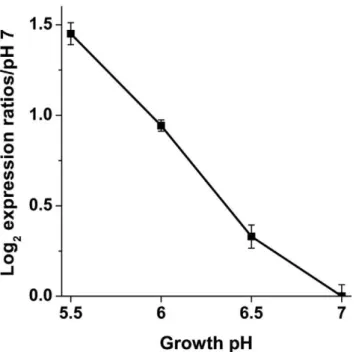
hycEexpression as a function of pH
In order to determine whether the change in H2production was
associated with a change inhyc expression, the mRNA levels of hycE, encoding the large subunit of Hyd-3, were measured in W3110 from external pH 7 to pH 5.5 (Fig. 3). hycE expression increased as the external pH decreased, whereas the activity of Hyd-3 was unchanged with a shift in external or internal pH. Thus the change in H2production more likely arises from the increased
hycexpression rather than a change in enzyme activity.
H2consumption as a function of pH
The pH-dependence of H2consumption has yet to be defined.
We observed H2 consumption in the strains W3110, JLS0920,
JLS0921, and JLS0922, cultured at both low and high pH. H2
levels were measured as described. Our results using W3110 showed that H2 is produced at acidic pH, but at neutral and
alkaline pH, H2 is consumed (Fig. 4). JLS0920, lacking Hyd-1,
showed no difference in H2consumption when compared with the
wild-type (data not shown). In JLS0922, lacking Hyd-3, H2was
consumed without production. At neutral and alkaline pH, H2
production in JLS0922 (Fig. 4B) resembled that observed in the wild-type strain (Fig. 4A), but at pH 5.5 the strain showed only H2
consumption. Even in a solution saturated with 20% H2, only H2
production was observed in JLS0921, lacking Hyd-2 (data not shown). The traces of H2 concentration (mV) over time were
converted into rates taking the slope from 2–5 minutes (Fig. 5). JLS0922 shows less than a 2-fold difference in consumption from pH 8 to 5.5, suggesting that the regulation of H2consumption is
not as strongly pH-dependent as H2production.
Extreme acid survival of hydrogenase mutants
We investigated whetherE. colistrains grown under conditions of high hydrogenase activity would show hydrogenase-dependent acid resistance. For control comparison, bacteria were cultured Figure 3.hycEgene expression in W3110.RNA was isolated from
anaerobic cultures grown to log phase at pH 5.5, 6, 6.5, and 7. Real-Time PCR was used to measure the mRNA levels of hycE, the large subunit of Hyd-3. Expression levels were normalized to the pH 7 control. Error bars represent SEM, n = 3 (RNA from independent cultures). The experiment was conducted twice.
doi:10.1371/journal.pone.0010132.g003
Figure 4. Effect of pH on the H2consumption by W3110 andDhycE.The lines represent traces of H2concentration as a function of time. Before time 0 the cultures were sparged with 20% H2/80% N2in order to saturate the culture with H2. Anaerobic cultures of W3110 (A) andDhycE(B) were grown to log phase at pH 5.5, pH 7, and pH 8 and assayed for H2consumption as stated in the Materials and Methods. A sample of LBK saturated with H2was assayed as a control to assess residual H2loss. Lines are representative samples of n = 3.
doi:10.1371/journal.pone.0010132.g004
aerobically (hydrogenase repressed) to stationary phase at pH 5 and exposed with rotary aeration for 2 h in LBK pH 2 (Fig. 6, white bars). All three hydrogenase mutants, JLS0921, JLS0922, and JLS0925 (lacks all four hydrogenases), showed comparable survival to the wild-type. Similar results were observed with cultures grown aerobically to stationary phase at pH 5.5 (data not shown). Thus, acid survival in aerobic cultures did not require hydrogenase activity.
We then tested the ability of hydrogenase mutants to survive anaerobic acid exposure. Bacteria were grown anaerobically to stationary phase at pH 5.5, and exposed to pH 2.5 (Fig. 6, hatched bars). W3110 and JLS0921 showed comparable survival, but JLS0922 and JLS0925 showed 3-fold decreased acid survival. Survival was also tested at a more extreme acidic condition, pH 2 (black bars). Every strain showed decreased acid survival, but an even larger difference was seen in the acid sensitive strains. JLS0922 (lacking Hyd-3) and JLS0925 (lacking all hydrogenases) showed a 20-fold loss in survival when compared to the wild-type. Thus, Hyd-3 is necessary for extreme acid survival under anoxic conditions, but Hyd-2 is not.
Discussion
E. coli use several mechanisms to resist the harshly acidic conditions of the stomach. A previous report revealed the contribution of hydrogenase to acid resistance in partly aerated cultures [7]. Here we clarify that finding to show that specifically Hyd-3, which is a part of the FHL complex, consumes protons to contribute to acid resistance of anaerobic cultures.
We first defined the pH regulation of both H2consumption and
production in various hydrogenase mutants in order to determine which was more important under acidic conditions. Hydrogen production and consumption were measured in vivo, in growing cultures. At acidic pH, H2 production was dependent only on
Hyd-3, and was increased by the deletion of Hyd-2, whereas H2
consumption was only dependent on Hyd-2.
Both H2 production and consumption rates are commonly
measured under conditions such as cells cultured at pH 6.8 and assayed in the presence of 100 mM sodium formate [25]. Under physiological conditions, intracellular formate concentration reaches only as high as 20 mM [35]. Our results are consistent with the previous finding that Hyd-3 is the main production hydrogenase. We further show that hydrogen production is induced at low pH in the absence of exogenous formate.
The in vitro pH-dependent activity of the consumption hydrogenase, Hyd-2, is maximal at high pH [23]. In the current report, we saturated an anaerobic culture with H2 to directly
measure Hyd-2-dependent H2 consumption. This revealed that
Hyd-2-dependent consumption increased under alkaline condi-tions, reaching a maximum at pH 8. Additionally, at pH 5.5 the wild-type strain showed net H2production despite being in a H2
saturated environment. Because alkaline conditions appear to enhance H2 consumption, it was not expected to contribute to
extreme acid survival.
A previous study using E. coliMC4100 finds less than 2-fold increase in H2production from pH 7.5 to pH 5.5 [26], whereas
we found a 70-fold increase from pH 6.5 to pH 5.5. It is possible that this discrepancy can be attributed to the previous use of 0.2% glucose in the growth media used by Ref. [26], sincehycexpression is repressed by glucose [36].
In order to maximize H2production yield, it is of importance to
understand whether conditions used to induce H2 production,
such as decreasing pH, increase hyc expression or enhance the enzymatic activity. Our results show that a shift from pH 6.5 to 5.5, a shift from pH 5.5 to 6.5, or the addition of 5 mM benzoate did not affect H2 production, whereas expression of the large
Figure 5. Effect of pH on the H2consumption rate of W3110 and DhycE. Anaerobic cultures were grown to log phase under anaerobic conditions at pH 5.5 (black bars), 7 (hatched bars), and 8 (white bars) and assayed for H2 consumption as described in the Materials and Methods. A negative value for H2consumption means H2 is produced. H2 consumption rate was calculated as stated in the Materials and Methods. Error bars represent SEM, n = 3. The experiment was conducted twice.
doi:10.1371/journal.pone.0010132.g005
Figure 6. Effect of aeration on the extreme acid survival of W3110,DhybC,DhycE, andDhypF.The white bars represent cultures grown with aeration to stationary phase in LBK buffered at pH 5 that were diluted 200-fold into LBK pH 2 and exposed for 2 h with aeration at 37uC. The hatched and black bars represent anaerobic cultures grown to stationary phase in LBK buffered at pH 5.5 that were diluted 200-fold into LBK pH 2.5 (hatched) or pH 2 (black) and exposed for 2 h without aeration at 37uC. Aerobic and anaerobic cultures were maintained as stated in the Materials and Methods. Error bars represent SEM, n = 5 or 6.
subunit of Hyd-3 increased as pH decreased from pH 7 to pH 5.5 (Fig. 3). Thus, the observed increase in H2production is likely due
to an increase inhycexpression [7], rather than a direct effect of external or internal pH on Hyd-3 activity.
Extreme-acid survival assays using aerobic cultures showed no hydrogenase-dependent acid resistance (Fig. 6). However, anaer-obic cultures required Hyd-3 for survival at or below pH 2.5. The requirement for Hyd-3 increased as the pH decreased, showing a greater effect at pH 2 when compared to pH 2.5. Acid resistance systems are generally defined using aerobic cultures [7,12,15,37] and Hyd-3 is the first reported mechanism that is necessary for anaerobic but not aerobic cultures.
The low-oxygen requirement for the acid resistance phenotype makes sense because Hyd-3 is only expressed anaerobically, controlled by the transcriptional activator FhlA [36,38]; and under aerobic conditions Hyd-3 is inactive [28]. Nevertheless, other acid resistance systems are known to be co-induced by acid and anaerobiosis yet still show an acid resistance phenotype with aerobic cultures. For instance, arginine decarboxylase, adiA, is expressed when exposed to acid and low oxygen [7,39]. TheadiA system confers aerobic acid resistance [15], although Salmonella typhimurium requires anaerobic growth before extreme-acid expo-sure [22]. It is likely that greater attention to anoxic conditions will reveal new acid resistance components inE. coli.
Materials and Methods
Bacterial strains, media, and growth conditions
E. coliK-12 strain W3110 [40] was used as the wild-type strain in all experiments. Deletion alleles containing a kanamycin resistance insertion (KmR) were transduced from the Keio collection [41] into the wild-type strain by P1 phage transduction (Table 1).
Cells were grown in LBK medium (10 g/L tryptone, 5 g/L yeast extract, and 7.45 g/L KCl) [7,42]. Overnight growth medium was supplemented with kanamycin (25mg/ml) for
mutants. Media were buffered with 100 mM Homopiperazine-N,N’-bis-2-(ethanesulfonic acid) (HOMOPIPES), 2-(N -morpholi-no)ethanesulfonic acid (MES), 3-(N-morpholino)propanesulfonic acid (MOPS), or N-Tris(hydroxymethyl)methyl-3-aminopropane-sulfonic acid (TAPS). The pH of the medium was adjusted as necessary using 5 M HCl or KOH. After growth, the pH of the medium was checked to ensure that pH was maintained within 0.2 units of that of the original uninoculated medium. Mutant and wild-type cells were streaked out on LBK-agar (supplemented with 25mg/ml kanamycin for mutants) and stored at 4uC for up to a
week.
RNA isolation and real-time quantitative PCR
E. coli W3110 cultures were grown to mid-late log phase (OD600= 0.4–0.5) as stated above in closed-cap anaerobic tubes at
pH values from pH 5.5 to pH 7.0. Bacterial RNA from three independent cultures at each condition was stabilized using the cold 10% phenol-ethanol stop solution as previously described [7,43] and isolated using the RNeasy Kit (Qiagen) followed by DNase treatment (Ambion).
Expression ofhycEwas quantified using real-time PCR using an ABI Prism7500 DNA analyzer (Applied Biosystems) as described previously [7]. The forward primer sequence was 59 -GAA-AACGCGATGGGTATTCAG - 39 and the reverse primer sequence was 59 - CAGAATGGCGCGGATCAT - 39. The SYBR Green PCR One-Step Protocol (Applied Biosystems) was used, in which cDNA reverse transcription and PCR amplification occur in the same well. Nucleic acid concentrations were as follows: 0.1 nM forward primer, 0.1 nM reverse primer, and 50 ng target RNA. PCR cycling conditions were as follows: reverse transcription at 48uC for 30 min and 95uC for 10 min, 40 cycles of denaturation at 92uC for 15 s, and extension at 60uC for 1 min. The total RNA in each sample amplified was used as the basis to normalize individual gene expression profiles. Expression levels of the average of three technical replicates of each biological replicate are presented relative to the expression in the pH 7 anaerobic control.
Acid resistance assays
The conditions for testing acid resistance (survival in extreme acid) were based on those described previously, with modifications [7,12]. The percent of surviving cells was assessed using aerobic and anaerobic cultures. To test aerobic cultures, cells were grown to stationary phase without antibiotics (16–18 h, 37uC) in LBK 100 mM HOMOPIPES, pH 5 in culture tubes with a capacity 7.5 times the culture volume. The tubes were rotated vertically to ensure aeration (40 rpm). The overnight cultures were diluted 200-fold into unbuffered LBK at pH 2. Exposure tubes were incubated for 2 h with vertical rotary aeration (40 rpm) at 37uC. The initial cell density during extreme acid exposure was approximately 16109CFU per ml. Following the 2 h exposure,
the cultures were serially diluted and streaked onto LBK-agar plates. The overnight cultures were also serially diluted into LBK 100 mM MOPS, pH 7 and plated, representing the unexposed controls. Plates were incubated overnight at 37uC.
To measure acid survival of anaerobic cultures, cells were grown to stationary phase (16–18 h, 37uC) in LBK 100 mM MES, pH 5.5 in closed screw cap tubes. The tubes were rotated slowly end over end (8 rpm) to ensure that the cells distributed evenly throughout the medium [7,44,45]. The overnight cultures were diluted 200-fold into closed screw cap tubes with unbuffered LBK at pH 2.5 or pH 2. Exposure tubes were incubated for 2 h rotating end over end (8 rpm) at 37uC. The initial cell density during extreme acid exposure was approxi-mately 36108CFU per ml. Following the 2 h exposure, the
cultures were serially diluted and plated. The overnight cultures were also serially diluted into LBK 100 mM MOPS, pH 7 and plated, representing the unexposed controls. Plates were incubated overnight at 37uC.
Survival rates were calculated as follows: the raw data were log10-transformed before taking the mean. The means were
subtracted to get a log10 ratio, which roughly correlates to
percent survival. The ratios are log10-transformed because
survival data represent data points on an exponential death curve, and is thus expected to follow a log-normal distribution. All errors stated are standard error of the mean (SEM). Each experimental condition included six biological replicates from the same overnight culture.
Table 1.E. coliK-12 strains used in this study.
Strain Genotype Source
W3110 K-12 (F2l2) [40]
JLS0920 W3110hyaB::Km This work
JLS0921 W3110hybC::Km This work
JLS0922 W3110hycE::Km This work
JLS0925 W3110hypF::Km This work
doi:10.1371/journal.pone.0010132.t001
H2production and consumption assays
To test H2 production and consumption, cells were grown to
stationary phase (16–18 h, 37uC) in LBK buffered at the assay pH in closed screw-cap tubes rotating slowly (8 rpm) at 37uC. The cultures were diluted 100-fold into closed screw cap tubes with fresh media and grown to mid-late log phase (OD600 0.4–0.5)
rotating slowly (8 rpm) at 37uC. Cells were grown for 4 h (pH 5.5), 3 h (pH 6), 2.75 h (pH 6.5), 2.5 h (pH 7), and 2.5 h (pH 8). All strains grew at the same rate. Once grown to the appropriate OD600, 2 ml of the culture was used to fill a glass chamber (2 ml
capacity). For H2production assays the cultures were sparged with
100% N2for 45 s to purge any existing H2and maintain anoxic
conditions. For H2consumption assays the cultures were sparged
with a 20% H2/80% N2 gas mixture for 90 s to saturate the
solution with H2and maintain anoxic conditions. The chamber
was capped to seal the chamber from ambient air, and placed in a water bath (37uC) with a magnetic stir bar (200 rpm). H2
production and consumption were assayed for 6 minutes using a Clark-type electrode H2micro-sensor system (Unisense; H2
-MR-3306) [46]. Before the start of the assay, the electrode was incubated in LBK saturated with 20% H2/N2 for 1 hour, and
then exposed to LBK saturated with 20% H2/N2 for three 10
minute intervals to ensure a consistent H2reading. Each condition
and strain included three biological replicates from the same overnight culture.
For the external pH shift assays, the conditions were the same as the H2production assays except that the assay was conducted for
12 minutes, and KOH or HCl was added 6 minutes after the start of the assay to change the external pH from 5.5 to 6.5 or from 6.5 to 5.5. For the internal pH shift assays, the cells were again assayed for 12 minutes, and potassium benzoate was added 6 minutes after the start of the assay to expose the cells to a 5 mM final concentration.
The rate of H2 production and consumption was calculated
based on the slope of H2concentration (mV) versus time from 2–5
minutes and normalized to OD600. The first 2 minutes were used
for sensor equilibration. The mV reading was converted tomM of
H2using a conversion factor of 0.0837mM/mV. This factor was
determined using the calibration procedure stated in the Unisense manual: a 2-ml sample of LBK was sparged with 20% H2/N2and
assayed at 37uC with a stir bar (200 rpm). The maximum mV reading was correlated to known values of saturated H2
concentration. All errors stated are standard error of the mean.
Author Contributions
Designed the study: KN. Conducted experiments: KN. Drafted the manuscript: KN. Conducted hydrogenase assays: DPR KCE RDK. Revised the manuscript: RDK JLS. Supervised the entire study: JLS.
References
1. Hansel A, Lindblad P (1998) Towards optimization of cyanobacteria as biotechnologically relevant producers of molecular hydrogen, a clean and renewable energy source. Appl Microbiol Biotechnol 50: 153–160.
2. Valdez-Vazquez I, Poggi-Varaldo HM (2009) Hydrogen production by fermentative consortia. Renewable Sustainable Energy Rev 13: 1000–1013. 3. Moss AR, Jouany J-P, Newbold J (2000) Methane production by ruminants: its
contribution to global warming. Ann Zootech 49: 231–253.
4. Olson JW, Maier RJ (2002) Molecular hydrogen as an energy source of Helicobacter pylori. Science 298: 1788–1790.
5. Maier RJ, Olczak A, Maier S, Soni S, Gunn J (2004) Respiratory hydrogen use by Salmonella enterica serovar Typhimurium is essential for virulence. Infect Immun 72: 6294–6299.
6. Bagramyan K, Trchounian A (2003) Structural and functional features of formate hydrogen lyase, an enzyme of mixed-acid fermentation fromEscherichia coli. Biochemistry (Moscow) 68: 1159–1170.
7. Hayes ET, Wilks JC, Sanfilippo P, Yohannes E, Tate DP, et al. (2006) Oxygen limitation modulates pH regulation of catabolism and hydrogenases, multidrug transporters, and envelope composition inEscherichia coliK-12. BMC Microbiol 6: 89.
8. Lutz S, Jacobi A, Schlensog V, Bo¨hm R, Sawers G, et al. (1991) Molecular characterization of an operon (hyp) necessary for the activity of the three hydrogenase isoenzymes inEscherichia coli. Mol Microbiol 5: 123–135. 9. Yoshida A, Nishimura T, Kawaguchi H, Inui M, Yukawa H (2005)
Enhanced hydrogen production from formic acid by formate hydrogen lyase-overexpressingEscherichia colistrains. Appl Environ Microbiol 71: 6762– 6768.
10. Benjamin MM, Datta AR (1995) Acid tolerance of enterohemorrhagicEscherichia coli. Appl Environ Microbiol 61: 1669–1672.
11. Bergholz TM, Whittam TS (2006) Variation in acid resistance among enterohaemorrhagicEscherichia coliin a simulated gastric environment. J Appl Microbiol 102: 352–362.
12. Gorden J, Small PLC (1993) Acid resistance in enteric bacteria. Infect Immun 61: 364–367.
13. Foster JW (2004)Escherichia coliacid resistance: tales of an amateur acidophile. Nat Rev Microbiol 2: 898–907.
14. Castanie-Cornet M-P, Penfound TA, Smith D, Elliott JF, Foster JW (1999) Control of acid resistance inEscherichia coli. J Bacteriol 181: 3525–3535. 15. Lin J, Lee IS, Frey J, Slonczewski JL, Foster JW (1995) Comparative analysis of
extreme acid survival inSalmonella typhimurium,Shigella flexneri, andEscherichia coli. J Bacteriol 177: 4097–4104.
16. Price SB, Wright JC, DeGraves FJ, Castanie-Cornet M-P, Foster JW (2004) Acid resistance systems required for survival ofEscherichia coliO157:H7 in the bovine gastrointestinal tract and in apple cider are different. Appl Environ Microbiol 70: 4792–4799.
17. Goodson M, Rowbury RJ (1989) Habituation to normally lethal acidity by prior growth ofEscherichia coliat a sub-lethal acid pH value. Lett Appl Microbiol 8: 77–79.
18. Small P, Blankenhorn D, Welty D, Zinser E, Slonczewski JL (1994) Acid and base resistance inEscherichia coliandShigella flexneri: role ofrpoSand growth pH. J Bacteriol 176: 1729–1737.
19. He G, Shankar RA, Chzhan M, Samouilov A, Kuppusamy P, et al. (1999) Noninvasive measurement of anatomic structure and intraluminal oxygenation in the gastrointestinal tract of living mice with spatial and spectral EPR imaging. Proc Natl Acad Sci USA 96: 4586–4591.
20. Moore WEC, Cato EP, Holdeman LV (1969) Anaerobic bacteria of the gastrointestinal flora and their occurrence in clinical infections. J Infect Dis 119: 641–649.
21. Zilberstein B, Quintanilha AG, Santos MAA, Pajecki D, Moura EG, et al. (2007) Digestive tract microbiota in healthy volunteers. Clinics 62: 47–54.
22. Kieboom J, Abee T (2006) Arginine-dependent acid resistance inSalmonella entericaserovar Typhimurium. J Bacteriol 188: 5650–5653.
23. Ballantine SP, Boxer DH (1986) Isolation and characterisation of a soluble active fragment of hydrogenase isoenzyme 2 from the membranes of anaerobically grownEscherichia coli. Eur J Biochem 156: 277–284.
24. Sawers RG, Boxer DH (1986) Purification and properties of membrane-bound hydrogenase isoenzyme 1 from anaerobically grown Escherichia coli K12. Eur J Biochem 156: 265–275.
25. Redwood MD, Mikheenko IP, Sargent F, Macaskie LE (2008) Dissecting the roles of Escherichia coli hydrogenases in biohydrogen production. FEMS Microbiol Lett 278: 48–55.
26. Mnatsakanyan N, Bagramyan K, Trchounian A (2004) Hydrogenase 3 by not hydrogenase 4 is major in hydrogen gas production byEscherichia coliformate hydrogenlyase at acidic pH and in the presence of external formate. Cell Biochem Biophys 41: 357–365.
27. Peck HD, Gest H (1957) Formic dehydrogenase and the hydrogenlyase enzyme complex in coli-aerogenes bacteria. J Bacteriol 73: 706–721.
28. Sawers RG, Ballantine SP, Boxer DH (1985) Differential expression of hydrogenase isoenzyme inEscherichia coliK-12: evidence for a third isoenzyme. J Bacteriol 164: 1324–1331.
29. Knappe J, Schacht J, Mo¨ckel W, Ho¨pner T, Vetter H, et al. (1969) Pyruvate formate-lyase reaction inEscherichia coli: the enzymatic system converting an inactive form of the lyase into the catalytically active enzyme. Eur J Biochem 11: 316–327.
30. Andrews SC, Berks BC, McClay J, Ambler A, Quail MA, et al. (1997) A 12-cistron Escherichia coli operon (hyf) encoding a putative proton-translocating formate hydrogenlyase system. Microbiology 143: 3633–3647.
31. Self WT, Hasona A, Shanmugam KT (2004) Expression and regulation of a silent operon, hyf, coding for hydrogenase 4 isoenzyme in Escherichia coli. J Bacteriol 186: 580–587.
32. Paschos A, Bauer A, Zimmermann A, Zehelein E, Bo¨ck A (2002) HypF, a carbamoyl phosphate-converting enzyme involved in [NiFe] hydrogenase maturation. J Biol Chem 277: 49945–49951.
34. Wilks JC, Slonczewski JL (2007) pH of the cytoplasm and periplasm ofEscherichia coli: rapid measurement by green fluorescent protein fluorimetry. J Bacteriol 189: 5601–5607.
35. Sawers G (1994) The hydrogenases and formate dehydrogenases ofEscherichia coli. Antonie Van Leeuwenhoek 66: 57–88.
36. Rossmann R, Sawers G, Bo¨ck A (1991) Mechanism of regulation of the formate-hydrogenlyase pathway by oxygen, nitrate, and pH: definition of the formate regulon. Mol Microbiol 5: 2807–2814.
37. Mates AK, Sayed AK, Foster JW (2007) Products of theEscherichia coliacid fitness island attenuate metabolite stress at extremely low pH and mediate a cell density-dependent acid resistance. J Bacteriol 189: 2759–2768.
38. Sankar P, Lee JH, Shanmugam KT (1988) Gene-product relationships offhlA andfdvgenes ofEscherichia coli. J Bacteriol 170: 5440–5445.
39. Auger EA, Redding KE, Plumb T, Childs LC, Meng S-Y, et al. (1989) Construction oflacfusions to the inducible arginine- and lysine decarboxylase genes ofEscherichia coliK12. Mol Microbiol 3: 609–620.
40. Smith MW, Neidhardt FC (1983) Proteins induced by anaerobiosis inEscherichia coli. J Bacteriol 154: 336–343.
41. Baba T, Ara T, Hasegawa M, Takai Y, Okumura Y, et al. (2006) Construction of Escherichia coli K-12 in-frame, single-gene knockout mutants: the Keio collection. Mol Syst Biol 2: 2006.0008.
42. Maurer LM, Yohannes E, BonDurant SS, Radmacher MD, Slonczewski JL (2005) pH regulates genes for flagellar motility, catabolism, and oxidative stress inEscherichia coliK-12. J Bacteriol 187: 304–319.
43. Bhagwat AA, Phadke RP, Wheeler D, Kalantre S, Gudipati M, et al. (2003) Computational methods and evaluation of RNA stabilization reagents for genome-wide expression studies. J Microbiol Methods 55: 399–409. 44. Blankenhorn D, Phillips J, Slonczewski JL (1999) Acid- and base-induced
proteins during aerobic and anaerobic growth ofEscherichia colirevealed by two-dimensional gel electrophoresis. J Bacteriol 181: 2209–2216.
45. Yohannes E, Barnhart DM, Slonczewski JL (2004) pH-dependent catabolic protein expression during anaerobic growth ofEscherichia coliK-12. J Bacteriol 186: 192–199.
46. Laurinavichene TV, Tsygankov AA (2001) H2consumption byEscherichia coli
coupled via hydrogenase 1 or hydrogenase 2 to different terminal electron acceptors. FEMS Microbiol Lett 202: 121–124.