American Journal of Engineering Research (AJER)
e-ISSN: 2320-0847 p-ISSN : 2320-0936
Volume-4, Issue-6, pp-137-143
www.ajer.org
Research Paper Open Access
Groundwater Resources Assessment For Joypurhat District
Using Mathematical Modelling Technique
Md. Iquebal Hossain
1, Md. Tarikul Islam
2, Prof. Iqbal Matin
31Executive Engineer,Barind Multipurpose Development Authority,Rajshahi, Bangladesh
2 Senior Specialist,Iirrigation Management Division, Institute of WaterModelling, Dhaka-1206, Bangladesh 3
Professor, Department of Civil Engineering, Rajshahi University of Engineering & Technology, Rajshah, Banladesh
ABSTRACT: In this study potential recharge as well as groundwater availability for 5 Upazillas (Akkelpur,
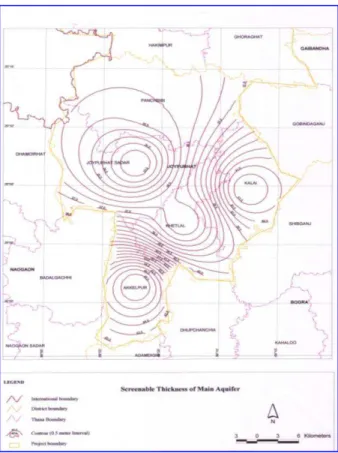
Kalai, Joypurhat Sadar, Khetlal and Panchbibi) of Joypurhat districts has been estimated using MIKE SHE modelling tools. The main aquifers of the study area are dominated by medium sands, medium and coarse sands with little gravels. The top of aquifers ranges from 15 m to 24 m and the screenable thickness of aquifers range from 33 m to 46 m within the depth range from 57 m to 87 m. Heavy abstraction of groundwater for agricultural, industrial and domestic uses results in excessive lowering of water table making the shallow and hand tubewells inoperable in the dry season. The upazilawise potential recharge for the study area was estimated through mathematical model using MIKE SHE modelling tools in an integrated approach. The required data were collected from the different relevant organisations. The potential recharge of the present study varies from 452 mm to 793 mm. Maximum depth to groundwater table in most of the places occurs at the end of April. At this time, groundwater table in most of the part of Kalai, Khetlal, Akkelpur and Panchbibi goes below suction limit causing HTWs and STWs partially/fully in operable.
KEYWORDS:
Groundwater, Specific yield, Recharge, DTW, STWI.
INTRODUCTION
Groundwater is very important for agro-socio-economic development of Bangladesh. Supply of safe drinking water to 97% of the population and attaining self-sufficiency in rice production are the two major successes achieved with the utilization of groundwater. Easy availability, good quality and cheap development technologies make groundwater exploitation very popular all over the country and abstraction has increased manifold over the last 30 years. This increasing trend would remain unchanged for the years to come.
This paper highlights the assessment of potential recharge as well as groundwater availability for 5 Upazillas (Akkelpur, Kalai, Joypurhat Sadar, Khetlal and Panchbibi) of Joypurhat districts using MIKE SHE modelling tools. Drought is one of the major problems of this area where groundwater is the only dependable source of drinking and irrigation purposes. Almost in all of the area, groundwater is being abstracted on an unplanned way and indiscriminately. Surface water sources are very limited for this area. In dry season, most of the hand tube wells (HTW) and shallow tube wells (STW) become inoperable.
The main aquifers of the study area ranges from 15 m to 24 m and the screenable thickness of aquifers range from 33 m to 46 m within the depth range 57 m to 87 m (Figure 1).
The survey indicated the existence of a 40 m thick aquifer at the depths varying from 20 m to 40 m in the study area (Depperman ,1956). Estimated the specific yield for the Bogra district including the area which varies between 8% and 18% (Karim, 1972). They recommended the hydraulic design parameters of aquifers, permeability ranges between 11 m/day to 32 m/day, transmissivity between 800 m2/day to 1350 m2/day and specific yield between 8% to 20%.
However, later on MacDonald (1980) revealed the transmissivity values of the aquifer ranges between 1000 m2/day and 2000 m2/day.
For general planning, a constant storage coefficient value of 13% was suggested in the report for typical water level fluctuations in the range of 5 to 9 m. In Khetal, Joypurhat, Kalai, Panchabibi and Akkelpur upazillas of Joypurhat district transmissivity varies from 1240 m2/day to 1700 m2/day (IWM, 2009).
II.
APPROACH AND METHODOLOGY
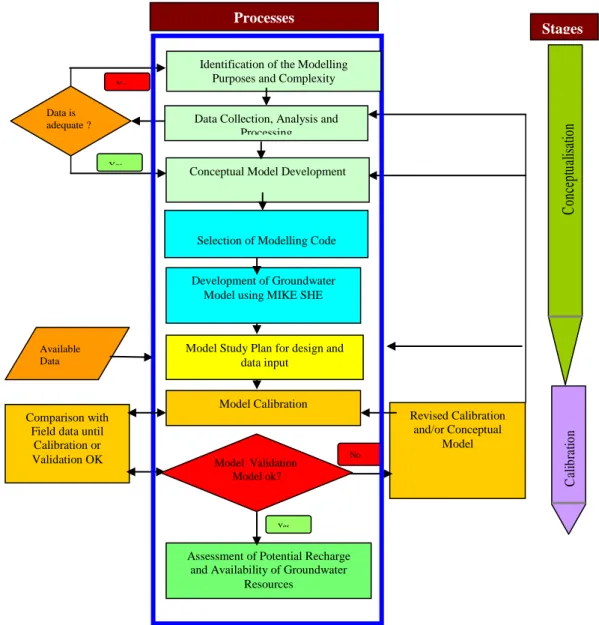
Every modelling study involves the iterative development of a model. Model refinements are based on the availability and quality of data, hydrogeological understanding and modelling study scope. For this study purposes, the general approach has been adopted as shown in the Figure 2
Data collection
The following data were collected from different sources:
Rainfall and Evaporation data for the period of 1975 to 2009 for 9 stations.
Groundwater level data from IWM and BWDB.
Geological data from IWM.
Land use and vegetation data from IWM.
Upazilawise number of DTW and STW from BADC Report.
Model Calibration
Calibration is the process in which the simulated result is matched with the observed data through adjusting the calibration parameter within a realistic limit. A set of 3 observation wells was selected for calibration matching. Due to the huge number of input data, the parameters are also numerous. During the calibration it is therefore important to adjust the parameters within acceptable ranges determined from field measurements, and also to minimize the number of adjustment of parameters. The model has been calibrated for the period 2001 to 2006. During calibration overland leakage co-efficient, soil properties, hydraulic conductivity and storage coefficient have been adjusted. Revised Calibration and/or Conceptual Model Available Data C al ib ra ti o n Stages No
Development of Groundwater Model using MIKE SHE Selection of Modelling Code
C
on
ce
pt
ua
lis
at
io
n
No Model Study Plan for design anddata input
Comparison with Field data until
Calibration or Validation OK
Assessment of Potential Recharge and Availability of Groundwater
Resources Model Validation
Model ok? Yes Data is adequate ? Yes Model Calibration Processes
Identification of the Modelling Purposes and Complexity
Data Collection, Analysis and Processing
Conceptual Model Development
To measure the performance of the model, calibrated water levels were compared with the observed water levels for 3 observation wells. Sample calibration plot is shown in Figure 3. In general, the overall calibration of the present model is acceptable, but there is scope for further improvement. Some of the reasons of deviation between observed and simulated groundwater levels have been identified as follows.
Insufficient irrigation information; the conceptual description of the irrigation abstraction might not be sufficient.
Missing description of pumping systems close to the observation wells.
There are considerable uncertainty in the crop water demand and the actual abstraction in the field.
Model Validation
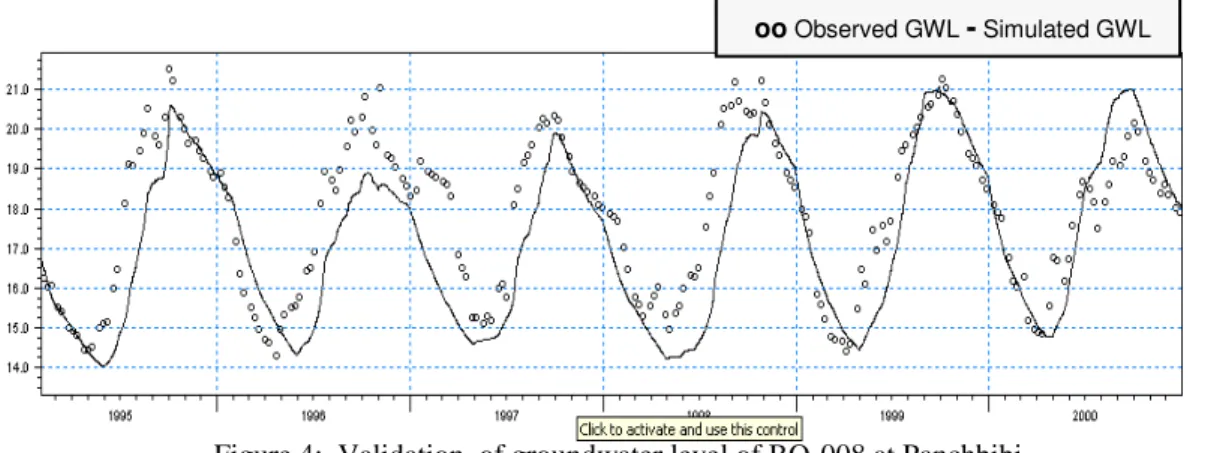
To check whether the calibrated model is an adequate representation of the physical system or not, validation is carried out on the calibrated model. It is customary that the calibrated model should be verified outside the calibration period. As such verification has been done for a period 1995 to 2000. In validation all the calibration parameters were the same as for the calibrated model, only the input parameters were changed.
In general the validation plots reveal a good correlation between the observed and the simulated values as shown in the Figure 4.
Overall validation results show similar trend of groundwater fluctuation and good matching of groundwater levels between observed and simulated values for both of the validation periods. From the results of the model validation, it can be concluded that the parameters used in the calibrated model are acceptable, thus the model can be used for prediction purposes.
Selection of Design Year
Generally, irrigation projects are planned considering average hydrological conditions. In the present study, design year has been selected based on return period of mean annual rainfall of the study area. Observed annual rainfall for a period of 32 years(1975-2006) has been considered for statistical analysis. Data has been
oo Observed GWL -Simulated GWL
Figure 4: Validation of groundwater level of BO-008 at Panchbibi
ooObserved GWL
-
Simulated GWLfitted to Log Normal distribution to find out the average dry year. The statistical software HYMOS 4.0 has been used for this purpose. From the statistical analysis 2002 has been selected as the design year.
Groundwater Resource Assessment
Reliable assessment of groundwater resource is essential for effective irrigation management and preservation of environment. Groundwater resource of the study area has been assessed based on recharge characteristics, potential recharge and safe yield criteria. The starting of December has been chosen for the assessment of groundwater resources. To estimate groundwater resource, the availability of groundwater within the allowable depths are estimated based on available saturated thickness up to these depths multiplied by specific yield of the area: Vw = Ax
h
S
yWhere Vw is the volume of water, h is the saturated thickness within allowable depths and Sy is the specific
yield of the aquifer.
The availability of groundwater resources within the 7 m depths are estimated based on available saturated thickness up to 7 m depths multiplied by specific yield. Upazilawise resources under different yield criteria has been estimated.
III.
RESULTS AND DISCUSSION
3.1 Potential Recharge and Usable Recharge
Upazilawise potential recharge has been estimated from model results simulated for average year (2002). The end of April is the end of irrigation period when the lowest water table generally occurs, after that water table starts rising due to recharge to groundwater from rainfall. The components that influence the groundwater storage after April are mainly rainfall, runoff, overland flow, overland storage, drain to river, evapo-transpiration, boundary inflow and outflow. Potential recharge for the study area has been estimated using the water balance obtained from model simulation. A sample water balance chart for Joypurhat Upazila is shown in Figure 5.
Potential Recharge = 503mm (SZ-Storage change)-51mm (UZ-Storage change)= 452 mm.
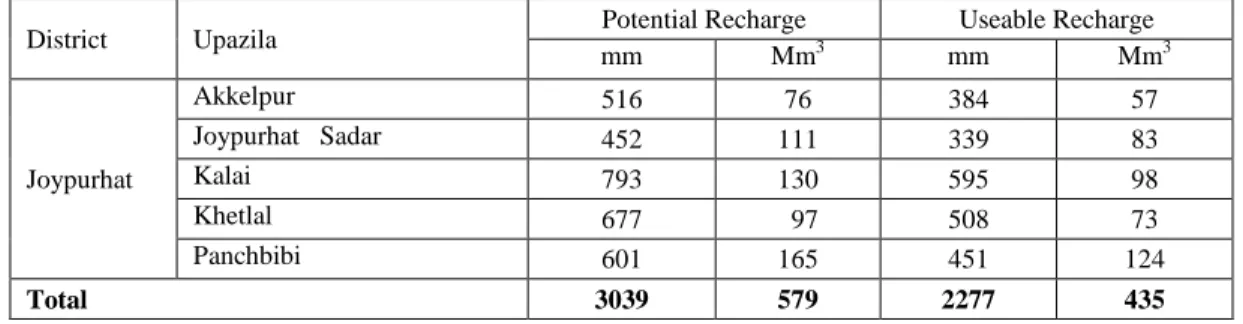
Upazilawise estimated potential recharge has been shown in Table 1. According to the MPO and NWMP guideline, 75% of potential recharge has been taken as usable recharge for development consideration.
It is due to the fact that various uncertainties are inherent in different assumptions for the estimation of potential recharge.
Precipitation 1149
Evapotranspiration 467
Total Error 1
Snow-Storage change
0Canopy-Storage change 0
OL-Storage change 7 UZ-Storage change
-51
102
164 Boundary flow OL->river/MOUSE
95
SZ-Storage change 503
63
76 Boundary flow
568 0Infilt. incl. Evap 0
55 Drain SZ/Boundary 6 31Base flow to River
Table 1: Upazilawise potential recharge of the study area
District Upazila Potential Recharge Useable Recharge
mm Mm3 mm Mm3
Joypurhat
Akkelpur 516 76 384 57
Joypurhat Sadar 452 111 339 83
Kalai 793 130 595 98
Khetlal 677 97 508 73
Panchbibi 601 165 451 124
Total 3039 579 2277 435
The estimated potential recharge has been compared with the potential recharge of MPO, NWMP and IWM study. The comparisons indicate that present study result has good conformity and consistency with those of MPO, NWMP and IWM study. However, there are slight variations in Upazilawise estimation. Comparison of Potential Recharge obtained by the model study and other organization is shown in Table 2.
The potential recharge of the present study varies from 452 mm to 793 mm while the values of MPO study varies from 400 mm to 500 mm and the values of NWMP study varies 552 mm to 772 mm and the values of IWM studies ranges from 453 mm to 799 mm.
Table 2: Comparison of potential recharge
District Upazila Potential Recharge (mm) Estimated by
Present Study MPO NWMP IWM
Joypurhat
Akkelpur 516 425 552 581
Joypurhat Sadar 452 400 558 453
Kalai 793 500 772 799
Khetlal 677 400 746 677
Panchbibi 601 450 636 635
The slight variation of results is due to variation in approaches and parameters used and boundary effect for comparatively small area. Distributed modelling approach and parameters were estimated through carefully data analysis. Furthermore, groundwater reserve has extensively been used over the recent years that create scope for higher recharge.
3.2 Available Groundwater Resources before Irrigation Period
Based on safe yield criteria, Upazila-wise available groundwater resources have been assessed considering the saturated thickness and the values of specific yield from the calibrated model. Upazila-wise available groundwater resources upto 7m from the surface is shown in Table 3.
It has been observed from the table that the potential recharge is lower than the available resource in Joypurhat Sadar. This is due to the fact that, potential recharge of this Upazila is less due to clay formation in upper geological layer. While the potential recharge is higher in other upazilas.
IV.
CONCLUSIONSThe study aims to explore the modern technique for assessment of groundwater resources and its sustainable development. In this connection a dedicated groundwater model for the study area hase been developed using the updated data and information collected from various secondary sources. The model has been calibrated for the period of 2001-2006 and validated for the period of 1995-2000. The calibrated and validated models have been applied for various scenarios. Based on the study findings, conclusions are summarized below:
After developing, satisfactory calibration and validation of the model available groundwater resource for the study area has been determined for three safe yield criteria; (i) maximum groundwater table 7 m from ground surface, (ii) potential recharge and (iii) useable recharge . The usable recharge has been determined considering 75% of potential recharge as suggested by MPO.
Groundwater resources for the entire study area for those yield criteria are found to be 527 Mm3, 579 Mm3 and 435 Mm3 respectively. Whereas the present irrigation requirement is 484 Mm3. This indicates that as a whole, if potential recharge is considered, there is no shortage of water to meet the present water demand.
When usable recharge is considered, little shortage of water is observed in Joypurhat Sadar, Khetlal and Panchbibii Upazila. This is due to the fact that boro coverage is already more than 80% in these Upazilas which implies to higher water requirement.
Maximum depth to groundwater table in most of the places occurs at the end of April. At this time, groundwater table in the most part of Kalai, Khetlal, Akkelpur and Panchbibi goes below suction limit causing HTWs and STWs partially/fully in operable.
Based on the study findings, Irrigation Zoning Map has been prepared. Considering the depth to groundwater table, groundwater zone is divided into STW zone and DTW zone. Kalai, Khetlal, Akkelpur and Panchbibi upazilas are DTW zone and Joypurhat sadar upazila is STW zone. However STW zone is not restricted for STW use only, it is considered as a mixed zone of STW and DTW.
REFERENCES
[1]. Depperman (1965): Geo electric resistivity survey for groundwater development in the northwest regions.
[2]. IWM (2005): Groundwater Management and Zoning Study for repair and Rehabilitation of Deep Tubewell Project in Greater Dinajpur District under Post Drought Agricultural Rehabilitation Programme, Final Report, Volume-II.
[3]. IWM (2009): Groundwater Resource Study and Decision Support System Development of Thakurgaon, Panchagarh, Dinajpur, Joypurhat Districts and also Remaining Districts of Rajshahi Division Through Mathematical Model Study, Volume-II.
[4]. Karim M.A. (1972): Ground Water Potential in Northern Areas of Dinajpur and Rangpur Districts, Bangladesh Water Development Board.
[5]. Mott. Mac Donald and Partners Ltd (1980): Groundwater modelling study for Tubewell project-North Bangladesh.
[6]. Karim M.A. (1984): Upazilawise Groundwater Recharge Conditions of Bangladesh, BangladeshWater Development Board.
[7]. MacDonald (1977): BADC/IDA Tubewell Project, Vol. III, Groundwater, Bangladesh Agricultural Development Corporation.
[8]. Mott. Mac Donald and Partners Ltd (1980): Groundwater modelling study for Tubewell project- North Bangladesh.
[9]. MacDonald (1983): Water Balance Studies Bangladesh, Final Report. [10]. MPO (1986): Technical Report No. 5 on Groundwater.
[11]. WARPO, Sir William Halcrow & Partners Ltd et al. (2000): National Water Management Plan Project Draft Development Strategy, Volume No. 4, Annex C: Land and Water Resources.
[12]. Ministry of Water Resources, GOB.