ANAEROBIC EFFLUENT DISINFECTED WITH OZONE/HYDROGEN PEROXIDE
Efluente Anaeróbio Desinfetado com Ozônio/Peróxido de Hidrogênio
Gustavo Henrique Ribeiro da Silva1, Luiz Antonio Daniel2, Ronan Cleber Contrera3, Harry Bruning4
1
Universidade Estadual Paulista (Unesp), Faculdade de Engenharia Campus de Bauru, Depto. de Eng. Civil, Av. Eng. Luiz E. C. Coube, s/no Vargem Limpa, CEP 17033-360, Bauru, SP, Brazil. Tel.: (14) 3103-6112 Fax (14) 3103-6101
E-mail: gustavoribeiro@feb.unesp.br
2
Universidade de São Paulo (USP-EESC), Departamento de Hidráulica e Saneamento, Av. Trabalhador Sãocarlense, 400, CEP: 13566-490, São Carlos, SP, Brazil. Tel. (16) 3373-9515 Fax (16) 3373-9550
E-mail: ldaniel@sc.usp.br
3
Universidade de São Paulo (USP), Depto. de Eng. Hidráulica e Ambiental (PHD), Escola Politécnica (EP), Avenida Prof. Almeida Prado, 83 trav. 2, Cidade Universitária, CEP: 05508-900, São Paulo, SP, Brazil. Tel. (11) 3091-1897
E-mail: contrera@usp.br
4
Wageningen University and Research Centre, Sub-department of Environmental Technology, P.O. Box 8129 6700 EV, Wageningen, The Netherlands. Tel. (31) 317 48 37 98
E-mail: harry.bruning@wur.nl
ABSTRACT
This research aimed at studying the oxidation process, to verify the effectiveness of coliform inactivation and to evaluate the formation of ozonation disinfection byproducts (DBP) in anoxic sanitary wastewater treated with ozone/hydrogen peroxide applied at doses of 2.6 mg O3 L-1 and 2.0 mg H2O2 L-1 with contact time of 10 min and 8.1 mg O3 L-1 and 8.0 mg H2O2 L-1 with contact time of 20 min. The mean chemical oxygen demand (COD) reductions were 7.50 and 9.40% for applied dosages of 2.5 – 2.8 and 6.4 – 9.4 mg O3 L-1 + 2.0 and 8.0 mg H2O2.L-1, respectively. The Escherichia coli (E. coli) inactivation range was 2.98 – 4.04 log10 and the total coliform inactivation range was 2.77 – 4.01 log10. The aldehydes investigated were formaldehyde, acetaldehyde, glyoxal and methylglyoxal. It was observed only the formation of acetaldehyde that ranged 5.53 to 29.68 µg L-1.
Keywords: Ozone, hydrogen peroxide, disinfection, byproducts, sanitary wastewater, anaerobic effluent.
RESUMO
Esta pesquisa visou estudar o processo de oxidação, verificar a eficácia da inativação de coliformes e avaliar a formação de subprodutos da ozonização em efluente sanitário anóxico tratado com ozônio/peróxido de hidrogênio aplicado em doses de 2.6 mg O3 L
-1
e 2.0 mg H2O2 L-1 com tempo de contato de 10 min e 8,1 mg O3 L-1 e 8,0 mg H2O2 L-1 com tempo de contato de 20 min. As reduções médias da demanda química de oxigênio (DQO) foram 7,50 e 9,40% para dosagens aplicadas de 2,5 – 2,8 e 6,4 – 9,4 mg O3 L
-1
+ 2,0 e 8,0 mg.H2O2.L-1, respectivamente. O intervalo de inativação de Escherichia coli (E. coli) foi 2,98 – 4,04 log10 e o intervalo de inativação de coliformes totais foi 2,77 – 4,01 log10. Os aldeídos investigados foram o formaldeído, acetaldeído, glioxal e metilglioxal. Foi observada apenas a formação de acetaldeído que variou de 5,53 até 29,68 µg L-1.
Palavras-Chaves: Ozônio, peróxido de hidrogênio, desinfecção, subprodutos, esgoto sanitárior, efluente anaeróbio.
1
1––INTRODUCTION
For solving the increasing problem on scarcity of water sources and wastewater pollution by micropollutants, certain combinations of advanced oxidation technologies (AOP) have been proposed with a view to increasing the capacity to treat refractory pollutants or to achieve a deeper degree of mineralization (Esplugas et al., 2002). Among others, Fenton, photo-Fenton, photocatalysis on TiO2,
ultraviolet-based oxidation processes (H2O2/UV and
O3/UV), the ozone-based O3/HO− and O3/H2O2 have been
reported by different authors (Gogate & Pandit, 2004; Ikehata et al., 2006). All of these processes involve the generation of hydroxyl radicals, a highly reactive and unselective species, in sufficient amounts to oxidize the organics in wastewater. O3/H2O2 belongs to the group of
chemical AOP and produces HO radicals. The use of the O3/H2O2 system was shown to ensure a high degree of
mineralization and have emerged as one of the main technologies. However, these oxidation processes have a double-edged sword; that is a high potential for the removal of harmful compounds and a potential for formation of undesirable byproducts.
Due to their advantages, the combined use of ozone (O3), hydrogen peroxide and ultraviolet (UV), and to
facilitate the complete degradation of contaminants are receiving increasing interest in recent researches (Glaze et al., 1987; Peyton and Glaze, 1988; Legrini et al., 1993; Teo et al., 2003; Ishida et al., 2008).
wastewater disinfection, have received increased attention and should be better studied.
For the removal of organic compounds in wastewater, ozone based advanced oxidation processes (AOP) are much more efficient than ozone alone. The addition of H2O2 accelerates the decomposition of ozone due to the
increased rate of hydroxyl radical generation (Brunet et al., 1984; Glaze et al., 1987, Kusic et al., 2008)
Although ozone has become a popular and successful disinfectant for drinking water, it has not been widely used for wastewater disinfection due to the operation and maintenance problems associated with first generation systems, its high costs, and the high ozone demand of many effluents (Xu et al., 2002; Gehr et al., 2003).
There are three important limitations in ozonation application: low solubility in water, the necessity of production at the point of use with a relatively low efficiency, and at a relatively high cost and the formation of byproducts.
Aldehydes, formed as a result of the oxidation of organic matter in wastewater, due to their health effects, represent one of the main ozonation DBP, although they are not currently regulated.
Some researchers have shown that the aldehydes production increases with the increasing of ozone dosage and contact time (Glaze et al., 1989; Yamada & Somiya, 1989); whereas the others reported that a further increase of ozonation time would reduce the aldehydes formation (Gracia et al., 1996; Ko et al., 1998, Silva 2010).
However, compared to chlorine, which has been much more widely studied, there is little information about the DBP that ozonation and peroxone process produces.
Due to their health effects, aldehydes, formed as a result of the oxidation of organic matter in wastewater, represent one of the main ozonation DBP. The formation of aldehydes during ozonation is well established (Langlais et al., 1991; Melin & Odegaard, 2000; Huang et al., 2005), and the main aldehydes formed are formaldehyde (H2CO),
acetaldehyde (C2H4O), glyoxal (C2H2O2) and
methylglyoxal (C3H4O2), all of which are potentially
carcinogenic and mutagenic. These compounds have been observed to cause tumors in experimental animals (Bull & Koppfler, 1991).
According to the World Health Organization (WHO) guidelines, the maximum acceptable level of formaldehyde in drinking water is 900.00 µg L-1 (IPCS, 2002). In Japan, the acceptable limit for formaldehyde is 80.00 μg L-1 (Sugaya et al., 2001); in Poland, the limit is 50.00 μg L-1 (Nawrocki & Bilozor, 1997); and in Australia, it is 500.00
μg L-1 (Australian Drinking Water Guidelines 6, 2004). The goals of this research were to study the DBP formed during ozone/hydrogen peroxide application of anaerobic wastewater treatment, to verify the oxidation processes that contribute to disinfection, and to verify the inactivation of indicator microorganisms.
2 – MATERIALS AND METHODS
All equipment and consumables were provided by the Sub-department of Environmental Technology – Wageningen
University and more details about type of effluent and materials used are described below.
2.1 Wastewater source
Wastewater samples were taken from a secondary effluent of a WWTP/Bennekom – The Netherlands. The WWTP/Bennekom was designed to treat an average flow of 3600 m3 d-1 and to remove not only organic compounds but also the N- and P-components. Therefore the plant consists of an anaerobic tank with a total volume of 850 m3 and an aerobic/anoxic tank of 4850 m3. The aerobic/anoxic compartment is a long stretched rectangular tank with 5 aerators. The activated sludge just after the aerator is, of course, aerobic and the activated sludge before the next aerator has (in this case) become anoxic.
After the mixing tank the activated sludge flows through the anaerobic tank and after that through the aerobic/anoxic tank. At the end of the aerobic/anoxic tank a part of the activated sludge goes to the secondary settler and a large part is recirculated to the inlet of the aerobic/anoxic tank where it is mixed with the activated sludge from the anaerobic tank. The “recirculation sludge flow” is about 15 times the wastewater flow.
2.2 O3/H2O2 experiments
The O3/H2O2 experiments were performed on a
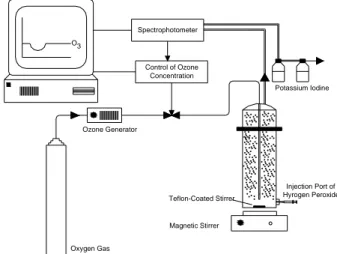
bench-scale experimental unit at the temperature 20 - 30°C, which consists of an ozone gas generator, monitoring devices, ozonation column that consist of all inert material, bubble diffuser placed at the bottom and KI absorption bottles (to capture ozone that did not react to the process), computer, spectrophotometer and a syringe to introduce the hydrogen peroxide (Figure 1).
The ozonation experiments used a 2.90 liters bubble diffuser column (0.1 m diameter) that was used as the ozonation reactor. The feed gas was introduced to the wastewater through an injector and mixed with the wastewater with a magnetic stirrer. The bubbles diameter observed ranged from 0.78 to 0.87 mm. The ozone influent flow was set at 2.4 L h-1.
O3
Control of Ozone Concentration
Ozone Generator
Potassium Iodine Spectrophotometer
Oxygen Gas
Magnetic Stirrer Teflon-Coated Stirrer
Injection Port of Hyrogen Peroxide
Forty liters of effluent was collect to carry out the experiments weekly. The collection was performed between the mixing tank and the anaerobic tank. The samples were then homogenized and filtered (due to the presence of solids) using a Schleicher & Schuell filter (385 mm of diameter, level 2V, 1202-385). After the filtration process the effluent was used in the experiments.
The average doses of ozone applied were 2.6 mg O3
L-1 and 2.0 mg H2O2 L-1(Experiment 1) and 8.9 mg O3 L-1
and 8.0 mg H2O2 L-1 (Experiment 2) and the gas/liquid
contact were of 10 and 20 min, respectively. The experiments were repeated five times with the same sample and it was realized two experiments with different characteristics of influent. For the first experiment the hydrogen peroxide was added in three different times (2 min and 30 seconds, 5 min and 7 minutes and 30 seconds). In the second the hydrogen peroxide was also added in three different times (5 min and 30 seconds, 10 min and 15 minutes and 30 seconds)
Ozone was generated from oxygen (95 – 98% purity-Hoekloos-NL), with a generator provided by Sorbios (GSG 001). The amount of ozone produced was controlled by changing the power input into the generator. The ozone gas concentration in the influent and effluent was measured by a Varian UV-VIS Cary 1 Bio Spectrophotometer.
2.2 Analytical Methods
The influent and effluent gas concentrations of ozone were measured at 258 nm by a Varian UV-VIS Cary 1 Bio Spectrophotometer. Residual ozone concentration in wastewater was analysed by Dr. Lange Kit n. LCK 310 (DPD Method).
COD and pH were monitored before and after the application of ozone/hydrogen peroxide (APHA, 2005).
The method used for the determination of carbonyls using O (2, 3, 4, 5, 6 – pentafluorobenzyl) hydroxylamine hydrochloride (PFBOA.HCl) as a derivatizing agent was originally described by Yamada & Somiya (1989) and was improved by Glaze et al. (1989). This method is recommended by the US Environmental Protection Agency (method 554.1) for analysis of carbonyl compounds in water. The PFBOA and analytical standards (aldehydes) were purchased from Aldrich-Chemie (Steinheim, Germany). PFBOA was prepared gravimetrically as an aqueous solution in organic-free water. Approximately 135 mg of formaldehyde (37% solution in water), 50 mg acetaldehyde, 125 mg of glyoxal (40% solution in water), and 125 mg of methylglyoxal (40% solution in water) were dissolved in 50 mL of water to make a 1000 ppm stock solution of all components. The stock solution was diluted with water to prepare standard solutions. Hexane (n-hexane for HPLC Carlo Erba) was used as a solvent for extraction. The derivatization method forms the corresponding oximes, which were analyzed by a HP 5890 gas chromatograph equipped with an electron capture detector and an HP-5 column (30 m × 0.32 mm i.d. × 0.25 μm). The method detection limit was 0.38 μg L-1.
Total coliform and E. coli were chosen as standard fecal indicators for this study because they are usually
regulated for wastewater discharge or reuse. The microbiological methods used were based on APHA (2005) with additional dilution of the samples to appropriate levels.
To assess whether significant differences exist in the mean values presented for pH, COD, the concentrations of formaldehyde, acetaldehyde, glyoxal, methylglyoxal, and inactivation efficiencies for total coliform and E. coli, the statistical “two-sample mean comparison”method was used (Miller and Miller, 1993).
3 – RESULTS AND DISCUSSION
The following are the results of ozone and hydrogen peroxide mass transfer, pH, COD, Total Coliform and E. coli and Ozonation DBP for the anaerobic effluent treated with ozone/hydrogen peroxide.
3.1 Ozone / Hydrogen Peroxide
The ozone mass transfer efficiency, amount of off-gas, dissolved ozone residual and consumed ozone were averaged for quintuplicate experiments of each dose and contact time and are shown in Table 1.
The mean mass transfer efficiencies in the column were 62% for 2.5 – 2.8 mg L-1 (10 min of contact time) and 69 % for 6.7 – 9.3 mg L-1 (20 min of contact time).
It was not possible to verify the influence of contact time, since, for the configurations studied, the load of ozone ranged from 0.725 to 1.363 mg O3 min-1.
In their study, Xu et al. (2002) obtained transfer efficiencies between 30 and 55% for applied doses between 1.0 and 50.0 mg L-1, which are lower than those presented in this study. The higher mass transfer obtained in the present research may have been due to the operational parameters employed as well as temperature differences.
Although higher temperatures have a negative effect on the solubility of ozone, this effect is broadly offset by the increased reactivity of ozone with organic matter and water, which favors its absorption (Wickramanayake et al., 1984; Rennecker et al., 1998). The present research was carried out at room temperature (20 – 30 ºC).
Table 1: Ozone mass transfer for applied dosages of 2.5 – 2.8 and 6.4 – 9.4 mg O3 L-1 and contact times of 10 and
20 min.
Experiment 1 2
Mean Ozone Applied (mg L-1) 2.6 2.6 9.3 6.7 Contact Time (min) 10 10 20 20
Off-Gas(mg L-1) 0.8 0.8 3.2 1.4 Final Dissolved Ozone Residual a
(mg L-1) 0.2 0.2 0.3 0.3
Consumed Ozone (mg L-1) 1.6 1.6 5.8 5.0 Transferred Ozone (%) 6.2 62 62 75
a
Milligrams of ozone that did not react per liter of effluent inside the column.
experiments of each dose and contact time and are shown in Table 2.
The mean mass transfer efficiencies in the column were 85% for 2.5 – 2.8 mg L-1 (10 min of contact time) and 68% for 6.7 – 9.3 mg L-1 (20 min of contact time).
Table 2: Hydrogen Peroxide mass transfer for applied dosages of 2.0 and 8.0 mg H2O2 L-1 and contact times of
10 and 20 min.
Experiment 1 2
Mean H2O2 Applied (mg L-1) 2.0 2.0 8.0 8.0 Contact Time (min) 10 10 20 20 Final Dissolved H2O2 Residual a
(mg L-1) 0.3 0.3 2.4 2.6
Consumed H2O2 (mg L-1) 1.7 1.7 5.6 5.4 Transferred H2O2(%) 85 85 70 68
a Milligrams of hydrogen peroxide that did not react per liter of effluent inside the column.
3.2 pH
The mean pH values obtained for the ozonated and non-ozonated effluents and for the different doses and contact times applied are presented in Table 3.
Table 3:Influent and effluent mean pH values for applied dosages of 2.5 – 2.8 and 6.4 – 9.4 mg O3 L-1 + 2.0 and
8.0 mg H2O2 L-1
Dosage Assay 1 2
2.5 - 2.8 mg.O3 L-1 + 2.0 mg.H2O2.L-1
Influent 7.30 7.38
Effluent 7.33 7.37
6.4 - 9.4 mg.O3 L -1
+ 8.0 mg.H2O2.L-1
Influent 7.69 7.41
Effluent 7.57 7.36
The small differences observed in the mean pH for influent and effluent values was not statistically significant (P = 0.05).
3.3 Chemical oxygen demand (COD)
The mean CODs obtained for the experiments that were applied O3/H2O2 are presented in Table 4.
Table 4: Mean COD values for applied dosages of 2.5 – 2.8 and 6.4 – 9.4 mg O3 L-1 + 2.0 and 8.0 mg H2O2 L-1
Mean O3+H2O2
Consumed (mgL-1)
Contact Time (min)
COD (mg L-1) Influent Effluent
1.6 + 1.7 10.0 74.0 64.0
1.6 + 1.7 10.0 78.0 69.0
5.8 + 5.6 20.0 102.0 93.2
5.0 + 5.4 20.0 87.0 77.2
Silva et al. (2011) observed in their research disinfecting anoxic effluent with ozone mean COD removal of 7.5% for a dose of 2.4 – 3.3 mg.O3.L-1, and 9.4
% for a dose of 6.8 – 9.0 mg.O3.L-1. The slight increase
observed in the present study in the mean COD removal comparing with the values observed by Silva et al. (2011) applying only ozone was statistically significant (P = 0.05).
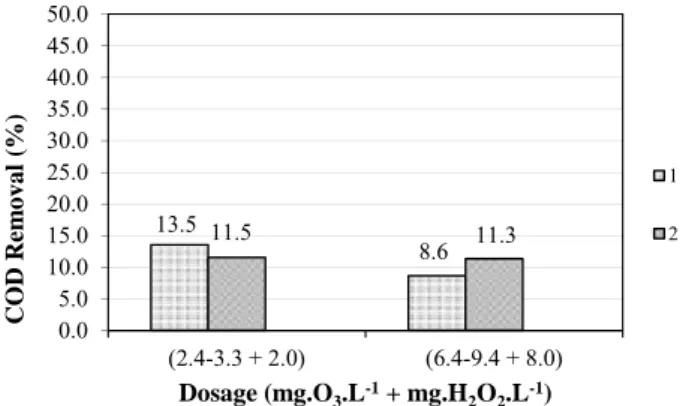
The mean COD removal percentages for applied dosages of 2.5 – 2.8 and 6.4 – 9.4 mg O3 L-1 + 2.0 and 8.0
mg H2O2 L-1 are presented in Figure 2.
13.5
8.6
11.5 11.3
0.0 5.0 10.0 15.0 20.0 25.0 30.0 35.0 40.0 45.0 50.0
(2.4-3.3 + 2.0) (6.4-9.4 + 8.0)
CO
D Re
m
o
va
l
(%
)
Dosage (mg.O3.L-1+ mg.H2O2.L-1)
1
2
Figure 2: Mean COD removal for applied doses of 2.5 – 2.8 and 6.4 – 9.4 mg.O3 L-1 + 2.0 and 8.0 mg.H2O2.L-1
The results of the current study do not agree with the results of Wu et al. (1999) and Silva et al. (2010). Wu et al. (1999) demonstrated the effects of stripping (using nitrogen) and oxidation (using oxygen and ozone-enriched oxygen) for removing odors from swine manure slurry. The authors demonstrated that stripping was always less efficient than oxidation for the removal of odoriferous compounds (zero to 40%) and that oxidation by ozone was always more efficient (80 to 100%). Oxidation by oxygen removed 10 to 50% of the odoriferous compounds.
Silva et al. (2010) applied only ozone for wastewater disinfection observed mean removal of 37, 46, 40 % for a dose of 5.0, 8.0 and 10.0 mg.O3.L-1, but this removal of
COD may have been caused not only by the oxidation of organic matter due to ozonation but also by the stripping of some gases (for example, methane).
3.4 Total Coliform and E. coli
Total coliform and E. coli inactivation efficiencies achieved using ozone as a disinfectant for the WWTP/Bennekom effluent are presented in Table 5.
Literature data have reported that ozone disinfection efficiency has little dependence on the pH range of domestic effluents, which is between 6.0 and 8.0 (Langlais et al., 1991; Silva et al., 2010). All but one of the samples had pH measurements within this range (6.0 – 8.0) and, therefore, there was no pH influence on the inactivation of total coliform and E. coli.
For mean O3 + H2O2 consumed of 1.6 + 1.7mgL-1, the
Table 5: Total coliform and E. coli inactivation as a function of contact time and effective consumed ozone/hydrogen peroxide concentration in the effluent
Mean O3 + H2O2 Consumed (mg L-1)
Contact Time (min)
Inactivation (log10) Total Coliform E. Coli
1.6 + 1.7 10.0 3.00 3.06
1.6 + 1.7 10.0 3.12 3.23
5.8 + 5.6 20.0 3.71 3.81
5.0 + 5.4 20.0 3.89 4.00
Inactivation: log10 (N/N0); N: number of microorganisms at time t; N0: number of microorganisms in the instant at time t = 0.
It is not possible to evaluate the inactivation power of hydrogen peroxide, when it was applied with the ozone, because when applied only to ozone the inactivation of E. coli and total coliform was lower, but the consumed dosage was also lower. However, the increasing of consumed dosage would not be able to achieve the inactivation values detected on peroxone experiments; this indicates that hydrogen peroxide was a favorable factor to greater inactivation obtained.
In the present study, the bacterial standards established by WHO Guidelines of < 1000 E. coli / 100 mL were achieved for all samples investigated for dosages applied 6.8 - 9.0 mg L-1.
Statistical analysis affirms that the applied dosage did have a meaningful effect on the inactivation of total coliform and E. coli because a higher applied dosage did significantly influence the efficiency of total coliform and E. coli inactivation.
Xu et al. (2002), Paraskeva and Graham (2005) and Silva et al. (2010) disinfected secondary and tertiary effluents and did not observe a considerable difference in E. coli disinfection for contact times between 2 and 20 min.
Finch and Smith (1989) considered the non-dependency of total coliform and E. coli inactivation on the applied contact time to be a result of the fast reaction kinetics of these microorganisms with ozone. In their study it was also observed no significant differences for contact times between 1 and 22 min.
According to Silva et al. (2010), this behavior suggests that disinfection reactors should be projected with only one contact chamber with a minimum size for mass transference to take place. Under these conditions, complete mix reactors would be the best options to guarantee that all of the mass in the effluent contacts the disinfecting gas in a homogeneous manner.
3.5 Ozonation DBP
The observed concentrations of formaldehyde, acetaldehyde, glyoxal and methylglyoxal for the ozonation experiments with 2.4 - 3.3 mg O3 L-1 and 10 min contact
time; and 6.8 – 9.0 mg O3 L-1 and 20 min contact time can be
seen in Table 6.
Table 6:Mean formaldehyde, acetaldehyde, glyoxal and methylglyoxal values for applied dosages of 2.4 – 3.3 and
6.8 – 9.0 mg O3 L-1
Dosage Aldehydes (μg L-1
)
2.5 – 2.8 mg O3 L-1 + 2.0 mg H2O2 L
-1
Formaldehyde nd Acetaldehyde 5.53
Glyoxal nd
Methylglyoxal nd
6.4 – 9.4 mg O3 L-1 + 8.0 mg H2O2 L-1
Formaldehyde nd Acetaldehyde 29.68
Glyoxal nd
Methylglyoxal nd nd: not detected
The statistical test revealed that the mean values of acetaldehyde in experiments change significantly (P = 0.05) when the mean consumed ozone was increased (1.18 to 4.74 mg L-1). There was an increase in the formation of acetaldehyde (5.4 times higher).
There was not formation of formaldehyde, glyoxal and methylglyoxal. The current study contradicts the studies of Wert et al. (2007), where ozone was applied to a tertiary effluent and also contradicts the studies of Nawrocki et al. (2003), who ozonated natural water and model water and obtained a higher formaldehyde formation predominance, whereas this did not happen in the present study. This behavior can most likely be explained by the characteristics of the wastewater. The results of the current study agree with the results of Silva et al. (2010), who ozonated anaerobic effluent from an Upflow Anaerobic Sludge Blanket (UASB) from a WWTP at the University of Sao Paulo – Campus Sao Carlos – Brazil, and observed predominant acetaldehyde formation.
The DBP formation was not influenced by pH values, because they did not vary greatly and the values were not high. According to Singer (1990) and Nawrocki and Kalkowska (1998), high pH levels inhibit the formation of aldehydes. However, there is still some controversy about this behavior. Weinberg and Glaze (1996) suggested that hydroxyl radicals can oxidize some of the aldehydes at high pH values.
The formaldehyde results are below the permissible levels (900.00, 500.00, 80.00, 50.00 μg L-1) presented in the WHO guidelines (IPCS, 2002), the Australian Drinking Water Guidelines 6 (2004), the Japanese Guidelines (Sugaya et al., 2001) and the Polish Health Ministry (Nawrocki and Biłozor, 1997).
4 – CONCLUSIONS
found in this research are below the permissible levels of formaldehyde given in the WHO guidelines (900.00 μg L-1).
ACKNOWLEDGEMENTS
The authors gratefully acknowledge the Conselho Nacional de Desenvolvimento Cientifico e Tecnologico (CNPq) for a doctorate scholarship, Fundacao de Amparo a Pesquisa do Estado de Sao Paulo (FAPESP) for the research process n. 2005/02782-0 and n. 2011/10816-2, the post-graduation program in Hydraulics and Sanitation, EESC-USP, Wageningen University – Sub-department of Environmental Technology and UNESP – Universidade Estadual de Bauru, Bauru College of Engineering- Civil Engineering Department.
REFERENCES
APHA, AWWA, WEF. Standard Methods for the
Examination of Water and Wastewater. American
Public Health Association, American Water Works Association, and Water Environment Federation, Washington, DC, 2005.
Australian drinking water guidelines 6. Australian Government National Health and Medical Research
Council, Natural Resource Management Ministerial
Council, 2004.
Brunet, R., M. M. Bourbigot, and M. Dore. Oxidation of organic compounds through the combination ozone-hydrogen peroxide. Ozone Science & Engineering, 6, p.163-182, 1984.
Bull, R. J.; Koppfler, F. C. Health Effects of Disinfectants by-Products, Am. Water Works Association Research
Foundation Report. Denver, Co: Am. Water Works
Association, 1991.
Esplugas, S.; Giménez, J.; Contreras, S.; Pascual, E.; Rodríguez, M. Comparison of different advanced oxidation processes for phenol degradation. Water Research, 36, p.1034-1042, 2002.
Finch, G. R.; Smith, D. W. Ozone dose-response of Echerichia coli in activated sludge effluent. Water Research, 23, p.1017-1025, 1989.
Gehr R., Wagner, M., Veerasubramanian, P., Payment, P. Disinfection efficiency of peracetic acid, UV and ozone after enhanced primary treatment of municipal wastewater.
Water Research, 37, p. 4573-4586, 2003.
Glaze, W. H.; Kang, J. W.; Chapin, D. H.The chemistry of water treatment processes involving ozone, hydrogen peroxide and ultraviolet radiation. Ozone Science & Engineering, 9(4), p. 335-352, 1987.
Glaze, W. H.; Koga, M.; Cancilla, D.; Wang, K.; Mcguire, M. J.; Liang, S.; Davis, M. K.; Tate, C. H.; Aieta, E. M. Evaluation of ozonation by-products from two California surface Waters.Journal AWWA, 81(8), p. 66-73, 1989. Gracia, R.; Aragues, J. L.; Ovelleiro, J. L. Study of the catalytic ozonation of humic substances in water and their ozonation byproducts. Ozone Science & Engineering. 18, p. 195-208, 1996.
Gogate, P. R.; Pandit, A. B. A review of imperative technologies for wastewater treatment. II. Hybrid methods.
Advanced Environmental Research. 8, p. 553-597, 2004.
Huang, W. J.; Fang, G.C.; Wang, C. C. The determination and fate of disinfection by-products from ozonation of polluted raw water. Science Total Environmental, 345, p. 261-272, 2005.
Ikehata, K.; Naghashkar, N. J.; El-Din, M. G. Degradation of aqueous pharmaceuticals by ozonation and advanced ozonation processes: a review, Ozone Science & Engineering, 28, p. 353-414, 2006.
IPCS, Formaldehyde. Geneva, World Health
Organization, International Programme on Chemical
Safety Concise International Chemical Assessment Document 40, 2002.
Ishida, C.; Salveson, A.; Robinson, K.; Bowman, R.; Snyder, S. Ozone disinfection with the HiPOXTM reactor:streamlining an “old technology” for wastewater reuse. Water Science and Technology, 58 (9), p. 1765-1774, 2008.
Ko, Y. W.; Chiang, P. C.; Chang, E. E.Ozonation of p -hydroxybenzoic acid solution. Ozone Science &
Engineering. 20, p. 343-360, 1998.
Kusic H.; Koprivanac, N.; Bozic, A. L. Minimization of organic pollutant content inaqueous solution by means of AOPs: UV- and ozone-based technologies. Chemical Engineering Journal, 123, p. 127-137, 2008.
Langlais, B.; Reckhow, D. A.; Brink, D. R. Ozone in
Water Treatment: Application And Engineering.
Chelsea, Michigan, 1991, 569 p.
Legrini, O.; Oliveiros, E.; Braun, A. Photochemical processes for water treatment. Chemical Review, 93, p. 671-698, 1993. Melin, E. S.; Odegaard, H. The effect of Biofilter Loading Rate on the Removal of Organic By-products. Water Research, 34, p. 4464-4476, 2000.
Miller, J. C.; Miller, J. N. Statistic for analytical chemistry, 3rd edition. Ellis Horwood PTR Printice Hall, 1993, 233 p.
Nawrocki J.; Biłozor, S. Brominated oxidation by-products in drinking water treatment. Journal Water SRT – Aqua 46, p. 304, 1997.
Nawrocki, J.; Kalkowska, I. Effect of pH and hydrogen peroxide on aldehyde formation in the ozonation process. Jounal Water SRT – Aqua 47, p. 50-56, 1998.
Nawrocki, J. S; Stanislawiak, U. R.; Dabrowska, A.; Bilozor S.; Ilecki, W. Influence of Ozonation Conditions on Aldehydes and Carboxylic Acid Formation. Ozone Science & Engineering, 25, p. 53-62, 2003.
Paraskeva, P.; Graham, N. J. D. Treatment of a secondary municipal effluent by ozone, UV and microfiltration: microbial reduction and effect on effluent quality. Desalination 186, p. 47– 56, 2005.
Peyton, G. R.; Glaze, W. H. Destruction of pollutants in water with ozone in combination with ultraviolet radiation.
Environmental Science and Technology. 22, p. 761-767, 1988. Rennecker, J.; Marinãs, B. J.; Owens, J. H.; Rice, E. W. Inactivation of Cryptosporidium parvum oocist with ozone.
Water Research, 33, p. 2481-2488, 1998.
Silva, G. H. R.; Daniel, L. A.; Bruning, H; Rulkens, W. H. Study of Anaerobic Effluent Disinfected with Ozone. In: 2nd North American Conference on Ozone, Ultraviolet & Advanced Oxidation Technologies. Toronto, 2011.
Singer, P. C. Assessing ozonation research needs in water treatment. JournalAWWA, 82 (10), p. 78-91, 1990.
Sugaya, N.; Nakagawa, T.; Sakurai, K.; Morita, M.; Onodera, S. Analysis of Aldehydes in Water by Head Space-GC/MS. Jounal of Health Science, 47, p. 21-27, 2001.
Teo, K. C.; Yang, C.; Xie, R. J.; Goh, N. K.; Chia, L. S. Destruction of organic pollutants in water using ozone, UV and their combination. Water Science and Technology, 47, p. 191-196, 2003.
Weinberg, H. S.; Glaze, W. H. An overview of ozonation and disinfection by-products. In: Minear RA, Amy GL, eds,
Disinfection by-products in Water Treatment. The Chemistry of Their Formation and Control. CRC Lewis Publications, Boca Raton, 1996.
Wert, E. C.; Rosario-Ortiza, F. L.; Druryb, D. D.; Snydera, S. A. Formation of oxidation byproducts from ozonation of wastewater.
Water Research, 41, p. 1481-1490, 2007.
Wu, J. J.; Park, S.; Hengemuehle, S. M.; Yokoyama M. T.; Person, H. L.; Gerrish, J. B.; Masten, S. J. The use of ozone to reduce the concentration of malodorous metabolites in swine manure slurry. Jounal of Agriculture Engineering Research, 72, p. 317-327, 1999.
Wickramanayake, G. B.; Rubin, A. J.; Sproul, O. J. Inactivation of Naegleria and Giardia Cysts in Water by Ozonation. Journal of Water Pollution Control Federation, 56, p. 983-988, 1984. Xu, P.; Janex M. L.; Savoye, P.; Cockx, A.; Lazarova, V. Wastewater disinfection by ozone: main parameters for process design. Water Research, 36, p. 1043-1055, 2002.
Yang, C.; Xu, Y. R.; Teo, K. C.; Goh, N. K.; Chia, L. S.; Xie, R. J. Destruction of organic pollutants in reusable wastewater using advanced oxidation technology. Chemosphere, 59, p. 441-445, 2005.