DWESD
8, 21–51, 2015Conversion of organic micropollutants with
limited bromate formation
A. H. Knol et al.
Title Page
Abstract Introduction
Conclusions References
Tables Figures
◭ ◮
◭ ◮
Back Close
Full Screen / Esc
Printer-friendly Version
Interactive Discussion
Discussion
P
a
per
|
Discussion
P
a
per
|
Discussion
P
a
per
|
Discussion
P
a
per
|
Drink. Water Eng. Sci. Discuss., 8, 21–51, 2015 www.drink-water-eng-sci-discuss.net/8/21/2015/ doi:10.5194/dwesd-8-21-2015
© Author(s) 2015. CC Attribution 3.0 License.
This discussion paper is/has been under review for the journal Drinking Water Engineering and Science (DWES). Please refer to the corresponding final paper in DWES if available.
Conversion of organic micropollutants
with limited bromate formation during the
Peroxone process in drinking water
treatment
A. H. Knol1, K. Lekkerkerker-Teunissen1, C. J. Houtman2, J. Scheideler3, A. Ried3, and J. C. van Dijk4
1
Dunea N.V., P.O. Box 756, 2700 AT Zoetermeer, the Netherlands
2
Het Waterlaboratorium, P.O. Box 734, 2003 RS Haarlem, the Netherlands
3
Xylem, Boschstrasse 4–14, 32051 Herford, Germany
4
TUDelft, Stevinweg 1, 2628 CN Delft, the Netherlands
Received: 12 January 2015 – Accepted: 18 February 2015 – Published: 24 March 2015
Correspondence to: A. H. Knol ([email protected])
DWESD
8, 21–51, 2015Conversion of organic micropollutants with
limited bromate formation
A. H. Knol et al.
Title Page
Abstract Introduction
Conclusions References
Tables Figures
◭ ◮
◭ ◮
Back Close
Full Screen / Esc
Printer-friendly Version
Interactive Discussion
Discussion
P
a
per
|
Discussion
P
a
per
|
Discussion
P
a
per
|
Discussion
P
a
per
|
Abstract
Advanced oxidation with O3/H2O2 (peroxone) is conducted on pilot plant scale on
pre-treated Meuse river water to investigate the conversion of organic micropollutants (OMPs) and the formation of bromate. Fourteen selected model compounds are dosed
to the pre-treated river water on a regular basis to assess the efficiency of the peroxone
5
process and to establish the influence of the water matrix.
The height of the ozone dose is the main factor in the conversion of the model com-pounds. The conversion of OMPs can be increased by further increasing the ozone dose, however, the ozone dose is limited concerning the bromate formation. The
hy-drogen peroxide dosage has only a minor effect on the conversion, but it limits the
10
bromate formation effectively. In terms of limited chemical consumption, maximal
con-version and adherence to the strict Dutch guideline for bromate in drinking water, a
practical full-scale setting is 6 mg L−1hydrogen peroxide and 1.5 mg L−1ozone. During
the investigation period, the average conversion of the model compounds was 78.9 %. The conversion of OMPs is higher at higher water temperatures and lower
concen-15
trations of DOC and bicarbonate. The bromate formation also is higher at higher water temperature and lower bicarbonate concentration and proportional with the bromide
concentration, above a threshold of about 32 µg L−1bromide, below which no bromate
is formed. The peroxone process can be controlled on basis of the (derived) parame-ters water temperature, bicarbonate and DOC.
20
1 Introduction
All over the world surface water is to some extend contaminated with organic micro pol-lutants (OMPs). It is expected that concentrations of OMPs will increase, due to growth and aging of populations and global warming. In areas with a shortage of groundwa-ter, drinking water companies use the available surface water as source for drinking
25
treat-DWESD
8, 21–51, 2015Conversion of organic micropollutants with
limited bromate formation
A. H. Knol et al.
Title Page
Abstract Introduction
Conclusions References
Tables Figures
◭ ◮
◭ ◮
Back Close
Full Screen / Esc
Printer-friendly Version
Interactive Discussion
Discussion
P
a
per
|
Discussion
P
a
per
|
Discussion
P
a
per
|
Discussion
P
a
per
|
ment technologies, such as coagulation, filtration and activated carbon filtration, are not adequate in removing OMPs from the surface water. The combination of the in-creasing concentrations of OMPs in surface waters and the inadequate removal of the more polar OMPs with conventional treatment processes, necessitate research on an additional barrier against OMPs.
5
Drinking water company Dunea, in the western part of the Netherlands, recognizes the threat of OMPs in their source the Afgedamde Maas (Enclosed Meuse), a side branch of the Meuse River, although at the moment the drinking water quality still com-plies fully to the standards of the Dutch Drinking Water Law, including the standards for OMPs. Mainly the managed aquifer recharge (MAR) by dune filtration and the dosing
10
of powdered activated carbon (PAC) are the current barriers against these substances. Only nonpolar OMPs are well removed by MAR and PAC. Polar OMPs are less well adsorbed and/or converted (IJpelaar, 2008). OMPs with biological activity, such as pharmaceuticals and pesticides are of concern to drinking water utilities, because
of their possible long term effects, the possibility of mixture effects and the sensitivity
15
for customer perception. Pharmaceuticals and pesticides are main contaminants
de-tected structurally in the Dutch Meuse River (Houtman et al., 2010). However, the effect
on human health at low concentrations at present is judged negligible (Schriks et al., 2010; Houtman et al., 2014).
Membrane filtration and advanced oxidation (AOP) are the two common technologies
20
to reduce concentrations of OMPs in pretreated surface water. After careful consider-ation, Dunea chose advanced oxidation as most optimal technique (Abrahamse et al., 2007) and carried out research with these technology. When AOP is installed before MAR, it is expected that this two processes will provide a synergistic hybrid system (Lekkerkerker-Teunissen et al., 2012).
25
In comparison with other AOP technologies, the O3/H2O2 (or peroxone) process,
is known as very energy efficient. The two mechanisms to convert OMPs are direct
oxidation by ozone and oxidation by in-situ produced hydroxyl radicals (·OH). The
DWESD
8, 21–51, 2015Conversion of organic micropollutants with
limited bromate formation
A. H. Knol et al.
Title Page
Abstract Introduction
Conclusions References
Tables Figures
◭ ◮
◭ ◮
Back Close
Full Screen / Esc
Printer-friendly Version
Interactive Discussion
Discussion
P
a
per
|
Discussion
P
a
per
|
Discussion
P
a
per
|
Discussion
P
a
per
|
and typically in the range ofk=1.0 till 106M−1s−1 (Gottschalk et al., 2010). The
re-action rate of hydroxyl radicals is much higher and typically in the range of k=108
till 1010M−1s−1. Although the reaction rate of ozone is much slower compared with
those of hydroxyl radicals, direct oxidation by ozone cannot be neglected when apply-ing peroxone (von Gunten, 2003a). Decomposition of ozone is accelerated by addition
5
of hydrogen peroxide with a reaction rate ofk=1.1×10⁵M−1s−1.
The efficiency of peroxone in converting OMPs largely depends on the water quality
matrix. Ozone and hydroxyl radicals not only react with OMPs, but also with scavengers as natural organic matter (NOM, mainly humic substances) and bicarbonate (von Gun-ten, 2003a). Besides that, the water temperature of the Meuse River yearly varies
10
between close to zero to around 25◦C, which influences dissociation coefficients and
hydraulic conditions (as mixing energy) in the reactor.
A reaction that is of particular importance is the reaction of ozone with bromide into bromate, since bromate is a suspected carcinogen (Kurokawa et al., 1982). The WHO,
EPA and European Drinking Water Directive established a guideline of 10 µg L−1
bro-15
mate . There are also lower guidelines, e.g. in Australia, which uses 2 µg L−1. Two
guidelines are mentioned in the Dutch Drinking Water Act: in case of disinfection with
ozone, the appointed guideline is 5 µg L−1 as a 90 % percentile value with a
maxi-mum of 10 µg L−1. If ozone is applied for oxidation, the bromate guideline is 1 µg L−1,
which means that applying peroxone in the Netherlands can be seen as an ultimate
20
challenge. Nevertheless, the negligible risk level (in the Netherlands defined as the concentration at which one additional case of cancer would occur in one million lifelong
exposed people; 10−6) is even lower and calculated to be 0.2–0.6 µg L−1, depending of
the method of interpretation (WHO, 2005). This negligible risk level is used to establish
a Company bromate standard of 0.5 µg L−1on average with a maximum of 1.0 µg L−1.
25
Also taking into account the concentration levelling MAR after applying peroxone, the
bromate concentration in drinking water will not exceed 0.5 µg L−1applying this
DWESD
8, 21–51, 2015Conversion of organic micropollutants with
limited bromate formation
A. H. Knol et al.
Title Page
Abstract Introduction
Conclusions References
Tables Figures
◭ ◮
◭ ◮
Back Close
Full Screen / Esc
Printer-friendly Version
Interactive Discussion
Discussion
P
a
per
|
Discussion
P
a
per
|
Discussion
P
a
per
|
Discussion
P
a
per
|
of ozone and increasing the ratio between the hydrogen peroxide and ozone doses (von Gunten, 2003b).
Bromate formation is affected by the varying water matrix parameters pH, water
temperature, bromide and bicarbonate. Two other parameters, dissolved organic car-bon (DOC) and ammonia, appeared to be not of relevance for the water matrix of the
5
pre-treated enclosed Meuse. According to Croué et al. (1996) and Amy et al. (1993) bromate is formed proportionally when the ratio of ozone dose and DOC is
exceed-ing 0.4 mg O3/mg C and maximal contact times are applied. The ratio applied in this
project is significantly lower than 0.4. The role of ammonia (ammonia can depress the bromate formation) could be neglected, because only in a short period (weeks) the
10
concentration was higher than the detection limit of 0.02 mg N L−1, which is too low for
limiting bromate formation.
The goal of this research was to optimise the use of peroxone, restricted by a
bro-mate target value of 0.5 µg L−1, considering the maximum ozone concentration that
can be applied, as well as the minimum ozone/hydrogen peroxide ratio and the
corre-15
sponding conversion of OMPs. The influence of the water matrix, the ozone dose and the hydrogen peroxide concentration on the bromate formation and the conversion of OMPS were investigated in an on-site pilot plant set-up, with batch experiments and long term duration experiments.
2 Materials and methods 20
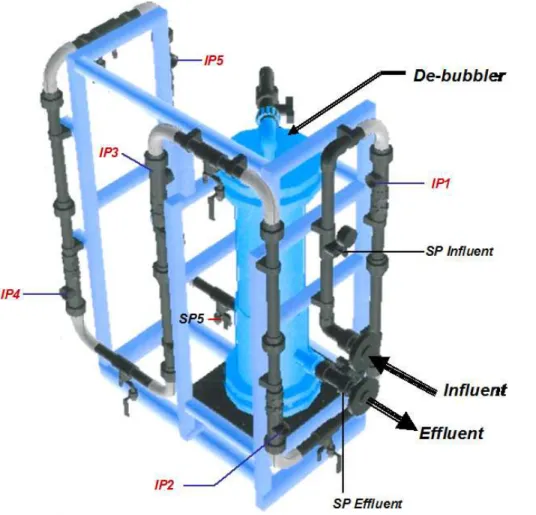
2.1 Peroxone process installation
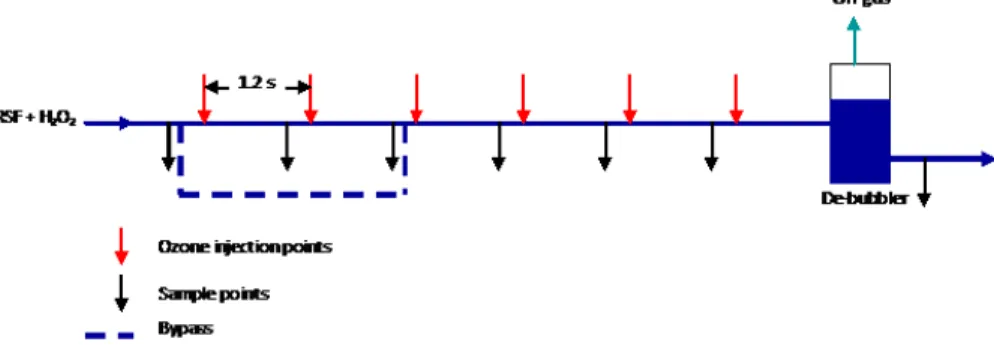
The pilot plant existed of an ozone loop reactor and an ozone generator, from Xylem Wedeco. The loop reactor consisted of sequential injection points, sample points and a degassing contact chamber. A schematic view of the loop reactor is plotted in Fig. 1. The ozone generator had a capacity between 3.5 and 100 g ozone per hour,
pro-25
DWESD
8, 21–51, 2015Conversion of organic micropollutants with
limited bromate formation
A. H. Knol et al.
Title Page
Abstract Introduction
Conclusions References
Tables Figures
◭ ◮
◭ ◮
Back Close
Full Screen / Esc
Printer-friendly Version
Interactive Discussion
Discussion
P
a
per
|
Discussion
P
a
per
|
Discussion
P
a
per
|
Discussion
P
a
per
|
(10 % stock solution) was dosed in the influent water before it entered the loop reactor. Model compounds were dosed before the dosage of hydrogen peroxide. Directly after each dosing point, a static mixer was installed in the pipe. The water velocity in the loop
reactor was 1.44 m s−1at design capacity of 5.0 m3h−1.
The loop reactor was equipped with a multi ozone dosing system. The ozone was
5
dosed in parts by dividing the gas flow over a number of (maximal 6) injection points (IPs). A static mixer was installed after each injection point. The pressure drop between two IPs was 1.85 mwc at design capacity. The retention time between the injection points was 1.2 s. Between the IPs, sample points (SPs) were installed, see Fig. 2.
The treated water flowed out in a degasser, in which the offgas (oxygen and
undis-10
solved ozone) and water were separated. The residence time in this contact chamber
was about 25 s. The off gas passed a column in which possible residual ozone was
catalytically degraded into oxygen and discharged outside the building by a ventilator.
The treated water was collected in a 10 m3storage tank and treated by additional AOP
before discharge.
15
The ozone content was measured in the feed gas and in the offgas by an BMT964
ozone analyser. In this way the efficiency of the ozone introduction and reaction is
determined. Although six injection points were available in the loop reactor, most of the time only four were used (IPs 3, 4, 5 and 6) to limit pressure drop, by bypassing the first two IPs.
20
2.2 Influent water
The influent water was pre-treated surface water. The source of this water was a dead-end tributary from the Meuse River. In this tributary, with a residence time of several weeks, coagulation was applied. At the intake the water passed micro-strains (mess width 35 µm). Afterwards dual media rapid sand filtration was applied. The quality of the
25
DWESD
8, 21–51, 2015Conversion of organic micropollutants with
limited bromate formation
A. H. Knol et al.
Title Page
Abstract Introduction
Conclusions References
Tables Figures
◭ ◮
◭ ◮
Back Close
Full Screen / Esc
Printer-friendly Version
Interactive Discussion
Discussion
P
a
per
|
Discussion
P
a
per
|
Discussion
P
a
per
|
Discussion
P
a
per
|
2.3 Experiments
Regarding the varying matrix of the rapid sand filtrate, investigation over a longer pe-riod was required to establish the formation of bromate and conversion of the model compounds. The influence of the varying parameters on the peroxone process was investigated on a regular basis with standard experiments, in which eight hydrogen
5
peroxide/ozone settings were used, see Table 2. In this way, design settings were
established to apply the peroxone process.
In addition to the standard experiments, spike experiments were performed to inves-tigate the role of bromide in bromate formation.
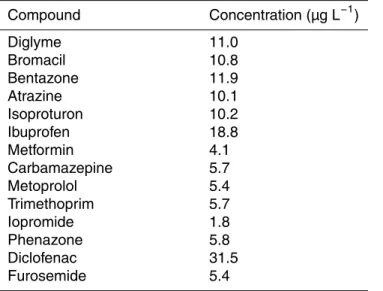
2.4 Investigated compounds 10
A set of 14 compounds were dosed to the RSF to investigate the conversion of model compounds by peroxone, see Table 3.
The model compounds were selected based on their different sensitivity for direct
oxidation by ozone and hydroxyl radicals and their representatively for different kind of
organic pollutants in river water.
15
The model compounds were spiked in concentrations from 5 till 30 µg L−1,
depend-ing on the detection limit of the compound, and at least 95 times the detection limit. The actual concentration of the model compounds was measured before RSF entered the loop reactor. The concentration of DOC was only slightly increased by spiking, by
about 0.1 mg C L−1. The DOC concentration of RSF varied over the year from 3.5–
20
5.5 mg C L−1.
2.5 Chemical and physical analyses
per-DWESD
8, 21–51, 2015Conversion of organic micropollutants with
limited bromate formation
A. H. Knol et al.
Title Page
Abstract Introduction
Conclusions References
Tables Figures
◭ ◮
◭ ◮
Back Close
Full Screen / Esc
Printer-friendly Version
Interactive Discussion
Discussion
P
a
per
|
Discussion
P
a
per
|
Discussion
P
a
per
|
Discussion
P
a
per
|
oxide with titanium(IV)oxysulphate solution, following DIN 38409 H15. The water tem-perature was measured with a PT 100 element in the main influent.
Analysis of the model compounds was performed with fast analysis methods
spe-cially developed for this pilot plant research, i.e. they were (1) suitable to efficiently
analyse the large number of samples that were generated in the experiments and (2)
5
had large quantification ranges to enable determination of the removal rate of each model compound under the varying process conditions (Lekkerkerker-Teunissen et al., 2012). The methods used an Ultra Performance Liquid Chromatograph (UPLC, Waters Acquity), equipped with a quaternary pump and combined with a Quattro Xevo triple quadrupole Mass Selective Detector (Waters Micromass) with electro spray
10
ionization. Fifty µL volumes of samples were injected without prior sample
prepara-tion. Compounds were measured in three separate runs, slightly differing in eluent
composition and gradients. The first run analysed (quantification ranges given
be-tween parentheses) atrazine (0.05–25 µg L−1), bentazone (0.10–25 µg L−1), bromacil
(0.05–25 µg L−1), diglyme (0.15–25 µg L−1), ibuprofen (1.5–250 µg L−1) and
isoprotur-15
one (0.05–25 µg L−1), all in positive ion mode, except ibuprofen which was
mea-sured in negative ion mode. The second run analyzed diclofenac (0.15–150 µg L−1),
furosemide (0.025–25 µg L−1), metformin (0.005–5 µg L−1) and phenazone (0.005–
5 µg L−1), of which the first two were measured in negative ion mode and metformin
and phenazone in positive ion mode. The third run measured carbamazepine (0.005–
20
5 µg L−1), iopromide (0.025–25 µg L−1), metoprolol (0.005–5 µg L−1) and trimethoprim
(0.005–5 µg L−1), all in positive ion mode. Quantification was performed using external
calibration series of seven concentrations.
Bicarbonate concentrations were determined via titration of hypochloric acid (0.1 N increments) using methyl orange as indicator.
25
Nitrate concentrations were determined with continuous flow analysis (Skalar
San++). Concentrations of ammonium and nitrite were determined with an automated
TOC-DWESD
8, 21–51, 2015Conversion of organic micropollutants with
limited bromate formation
A. H. Knol et al.
Title Page
Abstract Introduction
Conclusions References
Tables Figures
◭ ◮
◭ ◮
Back Close
Full Screen / Esc
Printer-friendly Version
Interactive Discussion
Discussion
P
a
per
|
Discussion
P
a
per
|
Discussion
P
a
per
|
Discussion
P
a
per
|
VCPH). A sample was acidified to a pH of 2–3 with hypochloric acid and the inorganic
carbon was subsequently eliminated with purging gas (O2). The remaining total carbon
C was measured and the result is generally referred to as TOC.
UV transmission was measured spectrophotometrically at a wavelength range of 254 nm.
5
Bromate was analysed using ion exchange chromatography followed by conductivity detection (Dionex IonPac AS9SC). The measured bromate concentration was con-firmed using a two point calibrated UV absorption measurement at a wavelength of
200 nm. The reporting limit of bromate was 0.5 µg L−1, although values higher than
the detection limit (0.1 µg L−1) were also evaluated to assess the bromate formation,
10
because the reporting limit was equal to the Company standard for bromate.
3 Results and discussion
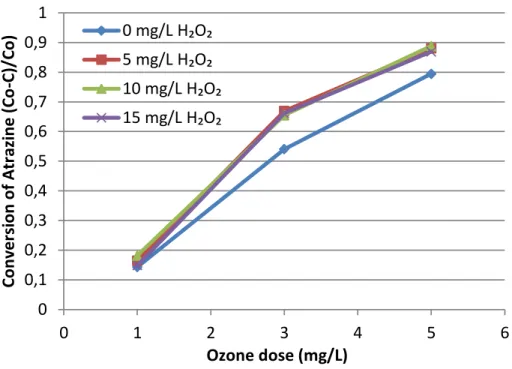
3.1 Proof of principle
Atrazine was used to investigate the sensitivity for the peroxone process. The conver-sion increased with the ozone dose, see Fig. 3.
15
At a dose of 5 mg L−1 ozone, about 80 % of atrazine was converted. By adding
5 mg L−1hydrogen peroxide, the conversion reached almost 90 %. Increase of the
hy-drogen peroxide dose above 5 mg L−1did not influence the conversion.
The energy consumption necessary to produce 5 g ozone to treat 1 m3water
(result-ing in 80 % conversion of atrazine) was about 0.045 kWh. To achieve a similar atrazine
20
conversion with a comparable pretreated surface water by applying UV/H2O2, the
en-ergy consumption is at least ten times higher (Lekkerkerker-Teunissen et al., 2013),
which demonstrates the energy efficiency of the peroxone process.
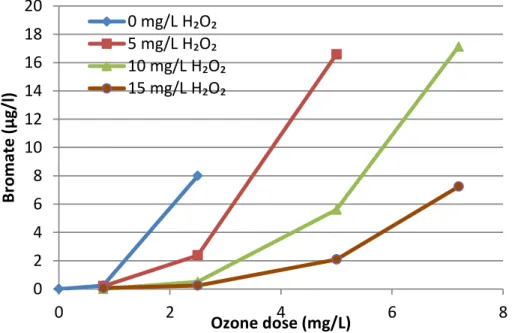
Bromate formation also increased with the ozone dose, see Fig. 4. However, by adding hydrogen peroxide, bromate formation was limited and the limitation was more
25
DWESD
8, 21–51, 2015Conversion of organic micropollutants with
limited bromate formation
A. H. Knol et al.
Title Page
Abstract Introduction
Conclusions References
Tables Figures
◭ ◮
◭ ◮
Back Close
Full Screen / Esc
Printer-friendly Version
Interactive Discussion
Discussion
P
a
per
|
Discussion
P
a
per
|
Discussion
P
a
per
|
Discussion
P
a
per
|
that bromate formation can be limited by a fast decomposition of ozone and a high ratio between the hydrogen peroxide and ozone doses (von Gunten, 2003b).
From Figs. 3 and 4 can be concluded, that the ozone dose is the main factor in converting atrazine and that the hydrogen peroxide dose is the main factor in limiting
the bromate formation. Almost 90 % of atrazine was converted with 5 mg L−1 ozone
5
and at least 10 mg L−1 hydrogen peroxide, without exceeding the WHO guideline for
bromate of 10 µg L−1. However, it is concluded that even 15 mg L−1 hydrogen peroxide
is not enough to comply with the Company guideline for bromate at an ozone dose of 5 mg L−1.
3.2 Bromate formation 10
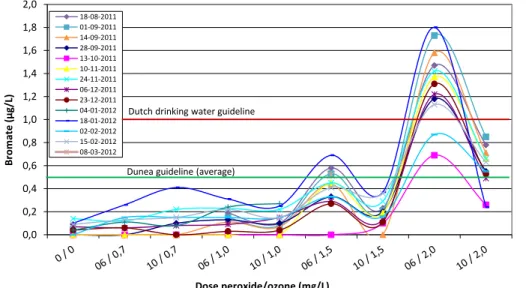
In the period August 2011 up to and including March 2012, every other week peroxone was investigated with standard experiments. The bromate concentrations are shown in
Fig. 5. Because the pilot plant settings were similar during the experiments, differences
in bromate formation were caused by variations in the water matrix.
As seen before (Knol, 2000), the influent water can contain low background
con-15
centrations of bromate. Figure 5 shows the bromate concentrations formed at different
ozone/peroxide settings for the standard experiments over the test year. The curves
show similar shapes, only the bromate values differs at the same settings. The bromate
formation increased with increasing ozone dose and was reduced by increasing the hy-drogen peroxide dose at a given ozone dose. Minimum bromate formation occurred in
20
winter season, maximum bromate formation in summer season.
Only the peroxone settings with the high ozone dose of 2.0 mg L−1, with either 6 or
10 mg L−1peroxide, did not comply to the Company bromate guideline (average value
of 0.5 µg L−1 with a maximum of 1.0 µg L−1). Minimal dose of 6 mg L−1 hydrogen
per-oxide combined with ozone doses up to 1.0 mg L−1 limited the bromate concentration
25
without exception below 0.5 µg L−1. The bromate concentrations at setting 6/1.5
DWESD
8, 21–51, 2015Conversion of organic micropollutants with
limited bromate formation
A. H. Knol et al.
Title Page
Abstract Introduction
Conclusions References
Tables Figures
◭ ◮
◭ ◮
Back Close
Full Screen / Esc
Printer-friendly Version
Interactive Discussion
Discussion
P
a
per
|
Discussion
P
a
per
|
Discussion
P
a
per
|
Discussion
P
a
per
|
Thus a safe optimal setting concerning the bromate formation was found as 6 mg L−1
hydrogen peroxide and 1.5 mg L−1ozone.
3.3 Influence water matrix on bromate formation
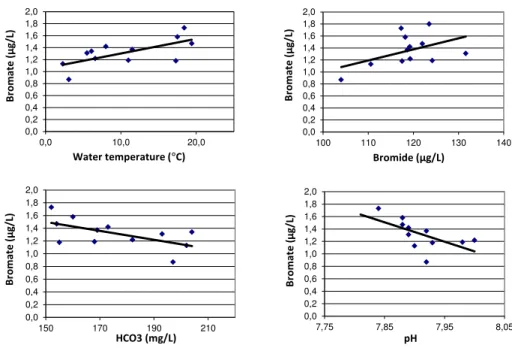
To appoint the responsible parameter(s) for the variation in bromate concentration, water temperature, bromide, bicarbonate and pH are plotted against bromate of setting
5
6/2.0 from August 2011 up till and including March 2012, Fig. 6.
The correlations in Fig. 6 are not strong, but certainly trends are visible: the bromate concentration increased with increasing water temperature and bromide concentration and decreasing bicarbonate concentration and pH.
Increase of bromate concentrations with increasing water temperature was expected
10
(Croué et al., 1996; von Gunten, 2003b). Croué reported an increase of 10 % per 10◦C,
von Gunten even about 20 % per 10◦C. The variation measured in this study was
be-tween 17 and 34 % which was found in line with previous research, regarding the 17◦C
temperature difference between the measured minimum and maximum temperature
during the standard experiments. A correlation between bromate and bromide was not
15
very obvious, although the dependency of the bromide concentration is known and
ex-pected at bromide concentrations higher than 20 µg L−1(Gottschalk et al., 2010). It is
possible that more parameters were involved than bromide alone. The bromate concen-tration decreased with increasing bicarbonate concenconcen-tration. Bicarbonate is a known scavenger of hydroxyl radicals, so probably less radicals are available to react with
20
bromide. Decreasing bromate formation with increasing pH is not in line with theory (von Gunten, 2003b). At higher pH, more hypobromite ions are present, which means a higher probability of bromate formation. However, the variation in pH during the stan-dard experiments was small with a bandwidth of 0.19 units (7.81–8.00) and this shift in pH of 0.19 units only increased the hypobromite concentration with approximately
25
DWESD
8, 21–51, 2015Conversion of organic micropollutants with
limited bromate formation
A. H. Knol et al.
Title Page
Abstract Introduction
Conclusions References
Tables Figures
◭ ◮
◭ ◮
Back Close
Full Screen / Esc
Printer-friendly Version
Interactive Discussion
Discussion
P
a
per
|
Discussion
P
a
per
|
Discussion
P
a
per
|
Discussion
P
a
per
|
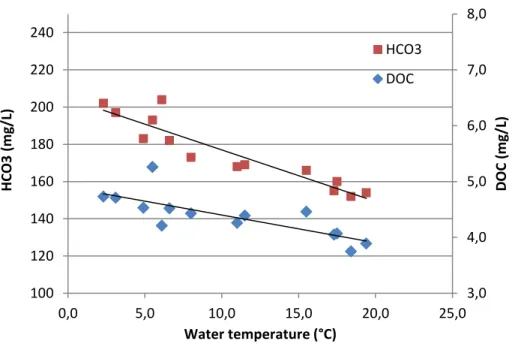
To which extent each parameter influenced the bromate formation was difficult to
address, because the water matrix changed continuously. For sure, the water temper-ature and the bicarbonate concentration strengthen each other. With increasing water temperature, the bicarbonate concentration decreased, Fig. 7, both resulting in an in-creased bromate formation.
5
For a better insight in the role of bromide in the bromate formation, concerning the forecasted increase in concentration in the Meuse River in global warming scenarios, this parameter is independently changed by spiking in RSF. The actual bromide
con-centration in RSF of 130 µg L−1is increased to 270 and 560 µg L−1, Fig. 8.
Bromate formation strongly increased with increasing bromide concentration.
Con-10
cerning the enclosed Meuse, it is therefore of importance to limit industrial spills and discharges of bromide in the main stream of the River Meuse, which are held account-able for about two-thirds of the bromide load in the Meuse (Volz, 2013). Based on the
equation in Fig. 8, a provisional bromide threshold of 32 µg L−1 (0.24/0.0075) can be
calculated, under which bromate formation is negligible. This value compares to the
15
earlier mentioned 20 µg L−1as reported by Gottschalk et al. (2010).
3.4 Conversion of organic micropollutants
The average conversion of the fourteen model compounds at the four different ozone
dosages (0.7 to 2.0 mg L−1) and at a peroxide concentration of 6 mg L−1 is shown in
Fig. 9. Conversions varied enormously between compounds. Eliminations between
20
less than 10 to over 95 % were observed. Reactivity of organic compounds towards ozone is strongly dependent on the molecular structure of compounds. Electron rich
moieties such as aromatic rings and C=C double bonds are main reaction sites at
which ozone attacks (Sonntag et al., 2012; Ternes et al., 2002). This structure depen-dency is clearly reflected in the results of the model compounds.
25
DWESD
8, 21–51, 2015Conversion of organic micropollutants with
limited bromate formation
A. H. Knol et al.
Title Page
Abstract Introduction
Conclusions References
Tables Figures
◭ ◮
◭ ◮
Back Close
Full Screen / Esc
Printer-friendly Version
Interactive Discussion
Discussion
P
a
per
|
Discussion
P
a
per
|
Discussion
P
a
per
|
Discussion
P
a
per
|
published by Acero et al. (2001) who found that compounds without aromatic and dou-ble bond structures, like MTBE, are poorly oxidizadou-ble by ozone alone. Iopromide, an X-ray contrast agent, in fact contains one aromatic ring. However, this ring is substituted at all six C positions (a.o. with three jodine atoms) and therefore not easily oxidized.
Higher conversions, between 38 and 68 % at 0.7 mg L−1ozone and between 85 and
5
99 % at 2.0 mg L−1ozone, were obtained for ibuprofen to phenazone. These five
com-pounds all possess one aromatic ring that is not substituted with halogens at which ozone can attack.
Furosemide, converted for about 95 % at all tested ozone doses, has one aromatic
ring in its structure, together with two C=C double bonds. In addition, furosemide has
10
an aromatic amine-N, which also acts as electron rich reaction site for ozone (Lee et al., 2014).
Highest conversions (≥97 %) were observed for diclofenac, trimethoprim and
carba-mazepine, due to the presence of two oxidizable aromatic rings in their structures. For diclofenac and carbamazepine, this is in line with Ternes et al. (2002).
15
The high conversion of bromacil is surprising regarding the fact that this herbicide does not have aromatic rings in its structure. It however does possess a bromine
sub-stituted C=C bond. Bromacil is oxidized directly by the attack of ozone on this C=C
bond and the consecutive loss of bromine (Hapeman et al., 1997). This reaction is energetically favorable due to the fact that bromine acts as a very good leaving group
20
and renders the conversion rate of bromacil comparable to that of the easily oxidizable model compounds with aromatic rings.
Besides at a peroxide concentration of 6 mg L−1 the conversion of the model
com-pounds was also assessed at 10 mg L−1peroxide. The influence of an increased
hydro-gen peroxide concentration at the same ozone dose on the conversion was however
25
found to be small. In fact, in all cases the average conversion was equal or lower, with
a maximum of 4 % decrease at a dose of 1.5 mg L−1 ozone. This is in line with
find-ings published previously for bromacil (Hapeman et al., 1997) and for compounds in
DWESD
8, 21–51, 2015Conversion of organic micropollutants with
limited bromate formation
A. H. Knol et al.
Title Page
Abstract Introduction
Conclusions References
Tables Figures
◭ ◮
◭ ◮
Back Close
Full Screen / Esc
Printer-friendly Version
Interactive Discussion
Discussion
P
a
per
|
Discussion
P
a
per
|
Discussion
P
a
per
|
Discussion
P
a
per
|
Two mechanisms could have been responsible for this phenomenon. Firstly, decom-position of the ozone will be accelerated at a higher hydrogen peroxide dosage, which is a disadvantage for compounds that are sensitive for direct oxidation by ozone, and, secondly, excessive peroxide itself can act as a scavenger for hydroxyl radicals. Prob-ably both mechanisms play a role, depending on the specific compound.
5
In general, the conversion of the model compounds was higher with higher ozone dosage. The conversion of the easy oxidizable compounds furosemide, diclophenac, bromocil, trimethoprim and carbamazepine already was maximal at the lowest dosage
of 0.7 mg L−1. The conversion of the remaining compounds improved considerably by
enhancing the ozone dosage to 2.0 mg L−1. Although from the perspective of
microp-10
ollutant conversion a dosage of 2 mg L−1 would therefore be optimal, the bromate
for-mation at this setting exceeded the Dunea guideline. The setting of 6/1.5 combined
acceptable bromate formation with an average conversion of the model compounds of
78.9 % (σ24.8 %).
The standard experiments showed that the peroxone process efficiently degrades
or-15
ganic micropollutants with aromatic rings and/or unsaturated C-C bonds in their molec-ular structures. As many OMPs contain these features, the peroxone process might be a useful technique in the purification of drinking water.
However, it should be noted that the peroxone process, like all advanced oxidation processes, does not provide a full solution for the problem of OMPs in water sources. In
20
the first place, this study showed that the achieved elimination is lower for compounds lacking electron rich moieties that can be oxidized by ozone. Secondly, oxidation by the peroxone process generally leads to the formation of degradation products instead of to full mineralisation of OMPS, e.g. Escher et al. (2009) and Sonntag et al. (2012). Like the OMPs originally present, the generated products may have unwanted toxic
25
properties.
DWESD
8, 21–51, 2015Conversion of organic micropollutants with
limited bromate formation
A. H. Knol et al.
Title Page
Abstract Introduction
Conclusions References
Tables Figures
◭ ◮
◭ ◮
Back Close
Full Screen / Esc
Printer-friendly Version
Interactive Discussion
Discussion
P
a
per
|
Discussion
P
a
per
|
Discussion
P
a
per
|
Discussion
P
a
per
|
in this case followed by biological degradation during MAR and adsorption during PAC filtration.
3.5 Influence of the water matrix on OMP conversion
Using the collected data of the standard experiments, the relevant water quality param-eters of RSF are plotted against the conversion of the model compounds for which the
5
observed conversion was less than 90 % (Fig. 10).
As expected, the conversion of the model compounds – with the exception of met-formin which was hardly converted at all – increased with increasing water tempera-ture and decreasing concentrations of DOC and bicarbonate. The concentrations of bicarbonate and DOC and the water temperature fluctuate seasonally (Fig. 7. All three
10
parameters could be (partly) responsible for the varying conversion of the five model compounds), for sure these three parameters strengthen each other. However, as we did not have test conditions in which only one of the parameters could be varied, it is not possible to distinguish causation and co-correlation.
The fact that bromate formation and OMP conversion appears to be dependent on
15
water temperature, bicarbonate and/or DOC concentration has as practical
implica-tion that in summer seasons the ozone dose strictly needs to be limited to 1.5 mg L−1
whereas in winter season a higher ozone dose is allowed to achieve the optimum OMP conversion with acceptable bromate formation. In this way the bromate formation and the conversion of OMPs are levelled over the year. Controlling peroxone on basis of
20
the (derived) parameters water temperature, bicarbonate and DOC and monitoring of bromate formation is feasible.
4 Conclusions
The peroxone process efficiently degrades organic micropollutants with aromatic rings
and/or unsaturated C-C bonds in their molecular structures. As many OMPs contain
DWESD
8, 21–51, 2015Conversion of organic micropollutants with
limited bromate formation
A. H. Knol et al.
Title Page
Abstract Introduction
Conclusions References
Tables Figures
◭ ◮
◭ ◮
Back Close
Full Screen / Esc
Printer-friendly Version
Interactive Discussion
Discussion
P
a
per
|
Discussion
P
a
per
|
Discussion
P
a
per
|
Discussion
P
a
per
|
these features, the peroxone process might be a useful technique in the purification of contaminated surface water. In drinking water treatment the dosage of ozone, and with that the conversion of OMPs, is limited due to the bromate formation. Neverthe-less, even in the Netherlands with the most strict guideline for bromate, an average
conversion of 14 model compounds of well over 70 % is achieved with 6 mg L−1
hydro-5
gen peroxide and 1.5 mg L−1 ozone. The applied ozone dose is the main factor in the
conversion of the model compounds. The hydrogen peroxide dosage has only a minor
effect on the conversion, but limits the bromate formation effectively.
The peroxone process can be controlled on basis of the (derived) parameters water temperature, bicarbonate and DOC. Analyses of bromate then can be used to adjust
10
the process.
Acknowledgements. The authors would like to thank the staffof treatment location Bergam-bacht for their technical support.
References
Abrahamse, A. J., IJpelaar, G. F., and Knol, A. H.: Project Uitbreiding Zuivering DZH, optionele
15
technieken en locatie keuze, KWR, Dunea, 2007.
Acero, J. L., Haderlein, S. B., Schmidt, T. C., Suter, M. J. F., and von Gunten, U.: MTBE oxidation by conventional ozonation and the combination ozone/hydrogen peroxide: efficiency of the processes and bromate formation, Environ. Sci. Technol., 35, 4252–4259, 2001.
Amy, G., SiddiQui, M., Ozekin, K., and Westerhoff, P.: Treshold levels for bromate formation in
20
drinking water, in: Proc. ISWA/AIDE International Workshop Bromate and water treatment, Paris, 22–24 November 1993, 169–180, 1993.
Croué, J. P., Koudjonou, B. K., and Legube, B.: Parameters affecting the formation of bromate ion during ozonation, Ozone Science and Engineering, 18, 1–18, 1996.
Escher, B. I., Bramaz, N., and Ort, C.: JEM spotlight: monitoring the treatment efficiency of
25
DWESD
8, 21–51, 2015Conversion of organic micropollutants with
limited bromate formation
A. H. Knol et al.
Title Page
Abstract Introduction
Conclusions References
Tables Figures
◭ ◮
◭ ◮
Back Close
Full Screen / Esc
Printer-friendly Version
Interactive Discussion
Discussion
P
a
per
|
Discussion
P
a
per
|
Discussion
P
a
per
|
Discussion
P
a
per
|
Gottschalk, C., Libra, J. A., and Saupe, A.: Ozonation of Water and Waste Water, a Practical Guide to Understanding Ozone and its Application, 2nd edn., 2010.
Hapeman, C. J., Anderson, B. G., Torrents, A., and Acher, A. J.: Mechanistic investigations concerning the aqueous ozonolysis of bromacil, J. Agr. Food Chem., 45, 1006–1011, 1997. Houtman, C. J.: Emerging contaminants in surface waters and their relevance for the production
5
of drinking water in Europe, Journal of Integrative Environmental Sciences, 1–25, 2010. Houtman, C. J., Kroesbergen, J., Lekkerkerker-Teunissen, K., and van der Hoek J. P.: Human
health risk assessment of the mixture of pharmaceuticals in Dutch drinking water and its sources based on frequent monitoring data, Sci. Total Environ., 496, 54–62, 2014.
IJpelaar, G.: Robuustheid van de Zuivering bij DZH, Management Samenvatting Prioritaire
Stof-10
fen 2005–2007, 2008.
Knol, A. H.: Gedrag van Bromaat in de Zuivering van Maas Tot Drinkwater, Duinwaterbedrijf Zuid-Holland, 2000.
Kurokawa, Y., Hayashi, Y., Maekawa, A., Takahashi, M., and Kokubo, T.: Induction of renal cell tumors in F-344 rats by oral administration of potassium bromate, A Food Additive. Gann,
15
73, 335–338, 1982.
Lee, Y., Kovalova, L., McArdell, C. S., and von Gunten, U.: Prediction of micropollutant elimina-tion during ozonaelimina-tion of a hospital wastewater effluent, Water Res., 64, 134–148, 2014. Lekkerkerker-Teunissen, K., Knol, A. H., Scheideler, J., Ried, A., Verberk, J. Q. J. C., and van
Dijk, J. C.: Serial ozone-AOP and UV-AOP for synergistic and effective organic
micropollu-20
tant treatment and bromate formation control, submitted to Sep. Purif. Technol., 100, 22–29, 2012.
Lekkerkerker-Teunissen, K., Knol, A. H., Derks, J. G., Heringa, M. B., Houtman, C. J., Hofman-Caris, C. H. M., Beerendonk, E. F., Reus, A., Verberk, J. Q. J. C., and van Dijk, J. C.: Pilot plant results with three different types of lamps for advanced oxidation, Ozone Science and
25
Engineering, 35, 38–48, 2013.
Schriks, M., Heringa, M. B., van der Kooij, M. M. E., de Voogt, P., and van Wezel, A. P.: Tox-icological relevance of emerging contaminants for drinking water quality, Water Res., 44, 461–476, 2010.
Sonntag, C. and von Gunten, U.: Chemistry of Ozone in Water and Wastewater Treatment:
30
DWESD
8, 21–51, 2015Conversion of organic micropollutants with
limited bromate formation
A. H. Knol et al.
Title Page
Abstract Introduction
Conclusions References
Tables Figures
◭ ◮
◭ ◮
Back Close
Full Screen / Esc
Printer-friendly Version
Interactive Discussion
Discussion
P
a
per
|
Discussion
P
a
per
|
Discussion
P
a
per
|
Discussion
P
a
per
|
Ternes, T. A., Meisenheimer, M., McDowell, D., Sacher, F., Brauch, H. J., Haist-Gulde, B., Preuss, G,. Wilme, U., and Zulei-Seibert, N.: Removal of pharmaceuticals during drinking water treatment, Environ. Sci. Technol., 36, 3855–3863, 2002.
Volz, J.: Bromidebronnen in Het Stroomgebied van de Maas, Een Kwalitatieve en Kwantitatieve Verkenning, 21 Maart 2013.
5
von Gunten, U.: Ozonation of drinking water: Part I. Oxidation kinetics and product formation, Water Res., 37, 1443–1467, 2003a.
von Gunten, U.: Ozonation of drinking water: Part II. Disinfection and by-product formation in presence of bromide, iodide and chlorine, Water Res., 37, 1469–1487, 2003b.
WHO: Bromate in Drinking Water, Background Document for Development of WHO Guidelines
10
DWESD
8, 21–51, 2015Conversion of organic micropollutants with
limited bromate formation
A. H. Knol et al.
Title Page
Abstract Introduction
Conclusions References
Tables Figures
◭ ◮
◭ ◮
Back Close
Full Screen / Esc
Printer-friendly Version
Interactive Discussion
Discussion
P
a
per
|
Discussion
P
a
per
|
Discussion
P
a
per
|
Discussion
P
a
per
|
Table 1.Minimum, maximum and average values of relevant parameters from RSF.
parameter unit minimum average maximum
Temperature ◦
C 1.5 12.3 20.8
pH – 7.81 7.97 8.11
Ammonia mg NH+4L−1 <0.02 <0.02 0.09
DOC mg L−1 3.38 4.26 5.26
Bromide µg L−1 104 119 136
Bicarbonate mg L−1
DWESD
8, 21–51, 2015Conversion of organic micropollutants with
limited bromate formation
A. H. Knol et al.
Title Page
Abstract Introduction
Conclusions References
Tables Figures
◭ ◮
◭ ◮
Back Close
Full Screen / Esc
Printer-friendly Version
Interactive Discussion
Discussion
P
a
per
|
Discussion
P
a
per
|
Discussion
P
a
per
|
Discussion
P
a
per
|
Table 2.Settings of the standard experiments.
parameter unit settings
Capacity m3h−1
5.0
Doses peroxide/ozone mg L−1/mg L−1 6/0.7; 10/0.7; 6/1.0; 10/1.0; 6/1.5; 10/1.5; 6/2.0; 10/2.0
Dosing ozone points – IP 3, 4, 5, 6 Dose rate model
compounds solution
DWESD
8, 21–51, 2015Conversion of organic micropollutants with
limited bromate formation
A. H. Knol et al.
Title Page
Abstract Introduction
Conclusions References
Tables Figures
◭ ◮
◭ ◮
Back Close
Full Screen / Esc
Printer-friendly Version
Interactive Discussion
Discussion
P
a
per
|
Discussion
P
a
per
|
Discussion
P
a
per
|
Discussion
P
a
per
|
Table 3.Average concentration of spiked model compounds in RSF.
Compound Concentration (µg L−1
)
Diglyme 11.0
Bromacil 10.8
Bentazone 11.9
Atrazine 10.1
Isoproturon 10.2
Ibuprofen 18.8
Metformin 4.1
Carbamazepine 5.7
Metoprolol 5.4
Trimethoprim 5.7
Iopromide 1.8
Phenazone 5.8
Diclofenac 31.5
DWESD
8, 21–51, 2015Conversion of organic micropollutants with
limited bromate formation
A. H. Knol et al.
Title Page
Abstract Introduction
Conclusions References
Tables Figures
◭ ◮
◭ ◮
Back Close
Full Screen / Esc
Printer-friendly Version
Interactive Discussion
Discussion
P
a
per
|
Discussion
P
a
per
|
Discussion
P
a
per
|
Discussion
P
a
per
|
0 0,1 0,2 0,3 0,4 0,5 0,6 0,7 0,8 0,9 1
0 1 2 3 4 5 6
Co
n
v
e
rsi
o
n
o
f A
tr
azi
n
e
(
Co
-C)/
Co
)
Ozone dose (mg/L)
mg/L H₂O₂ 5 mg/L H₂O₂ mg/L H₂O₂ 5 mg/L H₂O₂
DWESD
8, 21–51, 2015Conversion of organic micropollutants with
limited bromate formation
A. H. Knol et al.
Title Page
Abstract Introduction
Conclusions References
Tables Figures
◭ ◮
◭ ◮
Back Close
Full Screen / Esc
Printer-friendly Version
Interactive Discussion
Discussion
P
a
per
|
Discussion
P
a
per
|
Discussion
P
a
per
|
Discussion
P
a
per
|
0 2 4 6 8 10 12 14 16 18 20
0 2 4 6 8
B
ro
m
ate
(µ
g
/l
)
Ozone dose (mg/L)
mg/L H₂O₂ 5 mg/L H₂O₂ mg/L H₂O₂ 5 mg/L H₂O₂
DWESD
8, 21–51, 2015Conversion of organic micropollutants with
limited bromate formation
A. H. Knol et al.
Title Page
Abstract Introduction
Conclusions References
Tables Figures
◭ ◮
◭ ◮
Back Close
Full Screen / Esc
Printer-friendly Version
Interactive Discussion
Discussion
P
a
per
|
Discussion
P
a
per
|
Discussion
P
a
per
|
Discussion
P
a
per
|
0,0 0,2 0,4 0,6 0,8 1,0 1,2 1,4 1,6 1,8 2,0
B
ro
m
ate
(µ
g
/L)
Dose peroxide/ozone (mg/L) 18-08-2011
01-09-2011 14-09-2011 28-09-2011 13-10-2011 10-11-2011 24-11-2011 06-12-2011 23-12-2011 04-01-2012 18-01-2012 02-02-2012 15-02-2012 08-03-2012
Dunea guideline (average) Dutch drinking water guideline
DWESD
8, 21–51, 2015Conversion of organic micropollutants with
limited bromate formation
A. H. Knol et al.
Title Page Abstract Introduction Conclusions References Tables Figures ◭ ◮ ◭ ◮ Back Close
Full Screen / Esc
Printer-friendly Version Interactive Discussion Discussion P a per | Discussion P a per | Discussion P a per | Discussion P a per | 0,0 0,2 0,4 0,6 0,8 1,0 1,2 1,4 1,6 1,8 2,0
0,0 10,0 20,0
B ro m ate ( μ g /L)
Water temperature (°C)
0,0 0,2 0,4 0,6 0,8 1,0 1,2 1,4 1,6 1,8 2,0
100 110 120 130 140
B ro m ate ( μ g /L)
Bromide (μg/L)
0,0 0,2 0,4 0,6 0,8 1,0 1,2 1,4 1,6 1,8 2,0
150 170 190 210
B ro m ate ( μ g /L) HCO3 (mg/L) 0,0 0,2 0,4 0,6 0,8 1,0 1,2 1,4 1,6 1,8 2,0
7,75 7,85 7,95 8,05
B ro m at e ( μ g/ L) pH
DWESD
8, 21–51, 2015Conversion of organic micropollutants with
limited bromate formation
A. H. Knol et al.
Title Page
Abstract Introduction
Conclusions References
Tables Figures
◭ ◮
◭ ◮
Back Close
Full Screen / Esc
Printer-friendly Version
Interactive Discussion
Discussion
P
a
per
|
Discussion
P
a
per
|
Discussion
P
a
per
|
Discussion
P
a
per
|
3,0 4,0 5,0 6,0 7,0 8,0
100 120 140 160 180 200 220 240
0,0 5,0 10,0 15,0 20,0 25,0
D
OC
(m
g
/L)
H
CO3
(m
g
/L)
Water temperature (°C)
HCO3
DOC
DWESD
8, 21–51, 2015Conversion of organic micropollutants with
limited bromate formation
A. H. Knol et al.
Title Page
Abstract Introduction
Conclusions References
Tables Figures
◭ ◮
◭ ◮
Back Close
Full Screen / Esc
Printer-friendly Version
Interactive Discussion
Discussion
P
a
per
|
Discussion
P
a
per
|
Discussion
P
a
per
|
Discussion
P
a
per
|
y = 0,0075x - 0,24 R² = 0,9976
0,0
0,5
1,0
1,5
2,0
2,5
3,0
3,5
4,0
4,5
0
100
200
300
400
500
600
B
ro
m
ate
(
μ
g
/L)
Bromide (
μ
g/L)
Figure 8.Bromate formation as function of bromide concentration at setting 6/1.5 (water tem-perature 1.6◦
C, bicarbonate 201 mg L−1
DWESD
8, 21–51, 2015Conversion of organic micropollutants with
limited bromate formation
A. H. Knol et al.
Title Page
Abstract Introduction
Conclusions References
Tables Figures
◭ ◮
◭ ◮
Back Close
Full Screen / Esc
Printer-friendly Version
Interactive Discussion
Discussion
P
a
per
|
Discussion
P
a
per
|
Discussion
P
a
per
|
Discussion
P
a
per
|
0 10 20 30 40 50 60 70 80 90 100
A
v
e
rag
e
c
o
n
v
e
rsi
o
n
(%
)
6 / 0,7
6 / 1,0
6 / 1,5
6 / 2,0 H2O2 / O3
DWESD
8, 21–51, 2015Conversion of organic micropollutants with
limited bromate formation
A. H. Knol et al.
Title Page Abstract Introduction Conclusions References Tables Figures ◭ ◮ ◭ ◮ Back Close
Full Screen / Esc
Printer-friendly Version Interactive Discussion Discussion P a per | Discussion P a per | Discussion P a per | Discussion P a per | 0 10 20 30 40 50 60 70 80 90 100
0,0 5,0 10,0 15,0 20,0
C o n ve rsio n ( % )
Water temperature (°C)
0 10 20 30 40 50 60 70 80 90 100
3,5 4 4,5 5 5,5
Co n v e rsi o n ( % )
DOC (mg/L C)
0 10 20 30 40 50 60 70 80 90 100
150 170 190
Co n v e rsi o n ( % )
Hydrogen carbonate (mg/L)