GEOGRAPHICAL STRATIFICATION BY SOCIO-ECONOMIC STATUS: METHODOLOGY FROM A HOUSEHOLD SURVEY WITH ELDERLY PEOPLE IN S. PAULO, BRAZIL
Luiz Roberto Ramos* Samuel Goihman**
RAMOS, L.R. & GOIHMAN, S. Geographical stratification by socio-economic status: methodology from a household survey with elderly people in S. Paulo, Brazil. Rev. Saúde públ., S. Paulo, 23: 478-92,1989.
ABSTRACT: Considering that in most developing countries there are still no comprehensive lists of addresses for a given geographical area, there has always been a problem in drawing samples from the community, ensuring randomisation in the selection of the subjects. This article discusses the geographical stratification by socio-economic status used to draw a multistage random sample from a community-based elderly population living in a city like S. Paulo - Brazil. Particular attention is given to the fact that the proportion of elderly people in the total population of a certain area appeared to be a good discriminatory variable for such stratification. The validity of the stratification method is analysed in the light of the socio-economic results obtained in the survey.
KEYWORDS: Urban population. Aged. Sampling. Studies. Methods. Socio-economic factors.
*Setor de Geriatria e Gerontologia da Escola Paulista de Medicina - Rua Botucatu, 740 - 04023 - São Paulo, SP - Brasil; Cooordenação do Programa de Saúde do Idoso da Secretaria de Estado da Saúde de São Paulo Av. Dr. Arnaldo, 351 -01246 - São Paulo, SP - Brasil.
**Centro de Informação em Saúde da Secretaria de Estado da Saúde de São Paulo - Av. Dr. Arnaldo, 351 - 01246 - São Paulo, SP - Brasil; Centro de Informática em Saúde da Escola Paulista de Medicina - Rua Botucatu, 740 - 04023 - São Paulo, SP - Brasil.
INTRODUCTION
In 1984, a household survey was conducted in the City of S. Paulo (Brazil), aiming at an assessment of health status and social support of elderly people living in the community (Ramos, 1987). It was the first population-based study of elderly people in the country which used a multi-dimensional functional assessment question-naire to produce a general profile of the elderly living in an urban centre like S. Paulo. The study required a community sample to be stratified ac-cording to the socio-economic status of the res-pondent, as the main hypothesis was that socio-economic differences account for most of the variation in terms of physical and mental health status, social support, and perceived well-being in old age.
Thus, there was the need for a systematisa-tion of the urban space to enable a correct inter-pretation of people's living conditions to be ma-de. It was necessary to identify inner areas, within
the urban area of S. Paulo, inhabited predomi-nantly by people of the same socio-economic sta-tus.
some of the data collected in the study are analy-sed on the light of the socio-economic stratifica-tion in order to discuss the validity of the metho-dology used.
Characteristics of the city of S. Paulo
The city of S. Paulo is a constantly growing urban centre which bloomed with the growth of the coffee business early this century. Since the 1940s, however, it has become the main industrial center of the country, in which 11 % of the econo-mically active population of the country is con-centrated and accounts for more than 35% of the Gross National Product (IBGE5, 1984). Such a concentration of wealth and manpower has made S. Paulo one of the main 'receiving' areas in the country for the internal migration flows from the North and North-Eastern regions. As a conse-quence the population of the city of S. Paulo has increased exponentially. A comparatively small city in 1920, with little more than five hundred thousand people, it has become the largest city of the country and the fifth largest city in the world. Nowadays the city of S. Paulo has a dense population of more than 12 million people living in an area of 1493 sq.Km (SEADE6,1987). It is also the city in Brazil where the ageing process is most advanced, considering the mortality and fer-tility rates that determine the demographic tran-sition (Ramos et al,11,1987; Kalache et al.8,1987; Veras et al.14,1987). Almost 6% of the popula-tion is aged 65 and over, despite the influx of young migrants, and in some areas of the city this proportion rises to 10%. What seems most im-portant, however, when thinking about sampling for a household survey like the one proposed above, is the duality presented by S. Paulo's po-pulation. On the one hand there is a population living in the centre of the city, which enjoys com-paratively good health and reasonable standards of living - a result to be expected in the light of the economic growth associated with industrial development. On the other hand, in the periphe-ral areas, the majority of the population are very poor, recently settled, living in rudimentary slums, without sanitation, and usually far from the nearest health or social facility. This latter situation seems to be the inevitable outcome of the present mode of production that has promo-ted industrial development at the cost of keeping the majority of the population below the poverty level.
Indicators for the Socio-Economic Stratifica-tion of the PopulaStratifica-tion
Monteiro et al.9 (1980), some variables conside-red alone have shown a very poor discriminative power. That was the case, for instance, for the variable water supply, which has recently became available to almost every neighbourhood, and thus lost its power as a socio-economic indicator. Bearing this previous stratification in mind, it was necessary to update the indicators through the 1980 census, using only those that have shown good discriminatory power, such as family inco-me and availability of sewers. Census data for the city of S. Paulo identified the district of S. Paulo and its 48 sub-districts, but not the other 7 dis-tricts comprising the city, as shown in Figure 1. For that reason the study covered the district and not the whole city of S. Paulo.
Family Income and Availability of Sewers The 1980 Census figures give data on the average family income and the percentage of hou-seholds with sewers in each of the sub-districts of the district of S. Paulo. Both the average family income and the percentage of households with
sewers, varied greatly from one Sub-district to another. For instance, in the richest sub-district the average family income was 18.5 times the minimum salary (MS)* (US$ 1,410), whereas in the poorest it was less than 4 times the MS (US$ 295) (Table 1). In terms of the coverage of the sewage system the situation was even more une-ven, the affluent sub-districts giving more than 97% of the houses as served by the system, whe-reas at the poorest end of the spectrum, there were sub-districts in which less than 20% of the households were provided with sewers (Table 2). Considering that the highest income group defi-ned in the census was an open ended group (20 or more MS), it was decided to use the median ins-tead of the mean to indicate the average family income in each sub-district. The sub-districts we-re, then, ranked by the median family income (from the highest income to the lowest) and by the availability of sewers (from the highest per-centage of households with sewers to the lowest). The sub-district representing the median value was used to calculate terciles, thus dividing the 48 sub-districts into 3 groups (with 16 sub-districts
each). The geographical areas representing the 3 strata following both, the values for family inco-me and availability of sewers per sub-district (Fi-gures 2 and 3 respectively) showed a very similar picture to the one obtained in the previous study metioned above - three adjacent and concentric areas.
Proportion of Elderly Residents as a Stratifica-tion Variable
area had experienced a socio-economic decline in which case the proportion of elderly tended to be below the average for the city. In most peripheral areas the proportion of elderly people in the total population was substantially below the average. An important finding, however, was the strong association between the proportion of elderly people in the total population and the socio-eco-nomic indicators previously used to stratify the city in homogeneous areas. The sub-districts with the highest proportions of elderly in the total population were in most cases the ones with the highest average incomes. The variable propor-tion of elderly in the total populapropor-tion had, in fact, shown a direct and highly significant statistical correlation with both variables, family income and availability of sewers (elderly/income rs= 0.83 and elderly/sewers rs= 0.81). Such correla-tions suggested a new stratification of the
popu-lation using the proportion of elderly people as one of the stratification variables.
Table 3 shows the ranking of the 48 sub-dis-tricts, according to the percentage of elderly in the total population. The three groups (16 sub-districts each), representing populations with high, median and low proportion of elderly in the total population, had adjacent and concentric areas as described above. The geographical divi-sion, as seen in Figure 4, closely resembled the previous ones which used income and sewers as indicators. The proportion of elderly people in-creased from the periphery to the centre, along with the average family income and the availabi-lity of sewers. The elderly themselves seemed, in fact, to be a reasonably good indicator of the socio-economic situation of a particular popula-tion. In some central sub-districts, where the so-cio-economic situation has deteriorated in the last decades, the proportion of elderly people was much lower than one would have expected consi-dering, for instance, the good availability of sani-tation in these areas. That seemed to indicate that the proportion of elderly people in the total po-pulation can be a more dynamic indicator than sewers, because the elderly are likely to migrate when the socio-economic situation worsen, whe reas the sewers, once they are introduced need only maintenance and therefore their distribu-tion remains the same.
Differential Ageing in S. Paulo's Sub-districts The study of the functional status of an elderly urban population requires a broader un-derstanding of the dynamics of the segregation of the urban space. A detailed analysis of the popu-lation changes in each of the 48 sub-districts of S. Paulo was undertaken for sampling purposes, in the period between the censuses of 1970 and 1980. Table 4, shows the variations of the total and elderly populations in each sub-district of S. Paulo over the decade.
and the poorer, and less urbanised areas, fewer elderly people.
An interesting finding was that the differen-ces in the rates of increase for both the elderly and the total populations, in the period, reflected differences in the development of the sub-dis-tricts. For the purpose of understanding these differences on the light of the socio-economic differences and how they affect the elderly popu-lation, four sub-districts are taken as examples and analysed in more detail.
Sub-district of "Sé" (see Table 4, n. 5)
Situated in the old center of S. Paulo, this used to be a wealthy residential sub-district until the 1940s. Since then, "Sé" has become a poor commercial sub-district. In 1980, the average household income was US$ 508 per month (see Table 1), but the infra-structure of sanitation built in the past remained good - 89.5% of the households had sewers (see Table 2). It had a very low population growth in the decade from 1970 to 1980 - the total population increased only 7.6%, without any substantial increase in the el-derly population (6.9%) suggesting that elel-derly people probably migrated as the standards of li-ving deteriorated. Nevertheless the proportion of elderly (10.4%) remained well above the average for the city (6.5%).
Sub-district of "Aclimação" (see Table 4, n. 8)
This is also situated in the central area but has always been a wealthy residential sub-district. In 1980, both the average household income (US$ 784 per month) and the availability of se-wers (92.5%) were high (see Tables 1 and 2). It showed a lower than average increase in the el-derly and total popultions (30.1% and 12.8% res-pectively), although the former had a higher rate of increase, suggesting that the elderly have re-mained in this location. The proportion of elderly people in "Aclimação" was, in fact, one of the highest among the sub-districts (11.9%).
Sub-district "Ibirapuera" (see Table 4 n. 34)
Situated in the immediate outskirts of the central area of the city, this has become a wealthy residential sub-district. The average household income, in 1980, was US$ 1,060 per month (see Table 1). Yet, it is also a newly developed area, in
comparison with the old central part of the city, and had a relatively low availability of sewers (83.7%) (see Table 2). It showed the same avera-ge increase as the total population (43%), but a well above average increase in the elderly popu-lation (70%). This suggests that it was one of the receiving areas for the elderly migrating from the deteriorated areas of the center. The proportion of elderly people (7.2%) was above the average (6.5%).
Sub-district "Capela do Socorro" (see Table 4 n.52)
Situated in the peripheral area of the city, this is a very poor area. The average household income was only US$ 309 per month, in 1980 (see Table 1), and sanitary conditions were very poor - only 29% of the households were served by sewers in 1980 (see Table 2). In fact, this has been one of the main receiving areas for migrants arri-ving in S. Paulo, displaying an 'explosive' growth rate in its total population (225% in 10 years). In this particularly poor area, the proportion of el-derly in the total population was one of the lowest in the city at 2.9%.
Defining the Homogeneous Areas
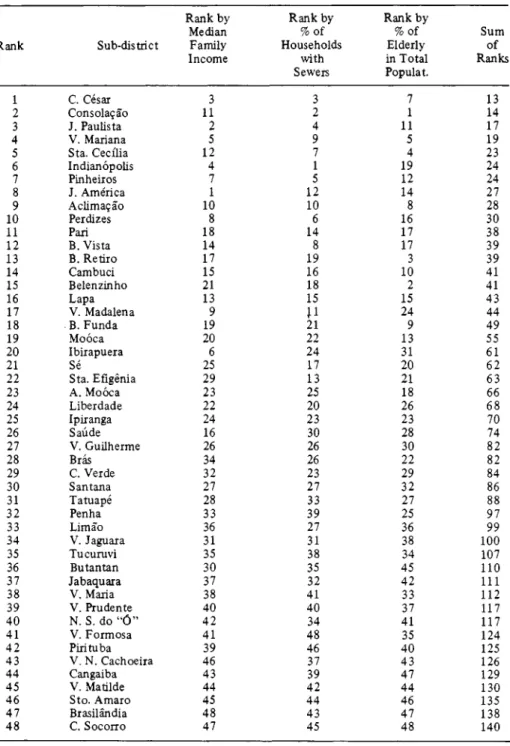
In the light of the inter-relationship be-tween income, sanitation and the age structure of the populations, the district of S. Paulo was stra-tified by means of the simultaneous use of the three variables for the purpose of grouping the 48 sub-districts into three different socio-economic strata. They were placed in order according to the sum of sub-district's ranking in family income, availability of sewers and proportion of elderly (Table 5). The final geographical division, in 3 areas, again very much resembles the previous ones, as shown in Figure 5. Each area had the following characteristics:
1) Central area A with high income (US$ 1409 - US$ 526), good availability of sewers (97.2% - 87.8%), and high proportion of people aged 65 and over (8.91% - 6.62%);
2) Intermediate area B with median income (US$ 1,063 - US$ 410), fair availability of sewers (92.1% - 62.3%), and median proportion of peo-ple aged 65 and over (8.06% - 4.54%);
(78.0% - 19.7%), and low proportion of people aged 65 and over (4.12% - 1.7%).
Table 6 shows that the three strata (homo-geneous areas) had rather different population sizes - area A with 17%, area B with 27% and area C with 56% of the total population of the district
produced a small stratum of high income house-holds with almost the same number of elderly as the large stratum of low income households.
Selecting the Sampling Areas
Having divided the city into three areas, the idea was to select one sub-district of each as a sampling area, representing the whole stratum. With three sub-districts, one could assume that the spectrum of socio-economic variation in the universe of the elderly living in S. Paulo was represented in the sample.
different from those in more residential areas. In this regard, a minimum of 70% of residential area in the sub-district was set as a selecting criterion for selection. From the 30 sub-districts already selected, based on the previous criteria, only 23 remained. Due to economic constraints, not all of the selected sub-districts were suitable for the survey, some had large populations of elderly and would inevitably demand a large sample if it was to be representative of the sub-district. Bearing this in mind, another exclusion criteria was intro-duced: the size of the elderly population. If the sub-district had more than 6,000 elderly people, it was excluded because the sampling fraction would be unattainable with the resources availa-ble. Of the 23 sub-districts still in the selection process, only 11 met this requirement.
Finally, it was decided that in all those sub-districts so far selected there was to be a visual inspection to determine which of them showed fewer socio-economic contrasts, eg. slums in the middle of a wealthy area, or a wealthy household estate in a poor area. Although these paradoxical clusters of households might not influence the average income of the sub-district, it could bias the analysis if randomly selected in the final sam-ple of households. Such a criterion was applied by two independent observers who met afterwards to decide which was the sub-district in each area to be included in the sample, from among those already selected by the previous criteria.
Therefore, instead of making a random se-lection of one sub-district in each area, the selec-tion was made based on a set of criteria as follows: Inclusion Criteria
a) To be one of the top 10 sub-districts in group A of the ranking, or
b) To be one of the 5 sub-districts either above or below the median in group B, or
c) To be one of the bottom 10 sub-districts in group C of the ranking.
Exclusion Criteria
a) If less than 70% of the households in the sub-district were residential units or,
b) If more than 6,000 people were aged 65 or over, thus exceeding the available resources if a representative sample were to be drawn, or
c) If the sub-district had obvious socio-eco-nomic contrasts at the visual inspection.
Eventually, "Aclimação" was the
sub-dis-trict selected as representative of the wealthy po-pulation living in the central area, with a high proportion of people aged 65 or over. "Vila Gui-lherme" was the one selected in the intermediate group and "Brasilândia" became the repre-sentative of the very poor and peripheral popula-tion (sited in the northern part of the city), with a low proportion of elderly people.
Sampling Design
Although the sample was not going to re-present the whole city, one of the basic aims was to design a simple and sound methodology of sampling that would enable future expansion of the survey without losing comparability. It see-med more appropriate to use the methodology of the one household survey in the country regularly undertaken on a national basis (the equivalent of the GHS in Great Britain) - the "Pesquisa Nacio-nal por Amostra de Domicílios" (PNAD) (IB-GE4 , 1981) - as a starting point. Since 1976 the PNAD (introduced in 1967) has achieved natio-nal coverage and developed a fixed questionnaire format. The National Institute of Geography and Statistics Foundation (IBGE), responsible for the censuses in Brazil (as well as the PNAD), have adopted a methodology that was developed in the 50's in the USA for continuous household surveys (US13, 1958). Such a methodology was, in the 60's, adapted to the reality of the Latin-American context by a joint effort of the United States Agency for International Development (USAID) and the Inter-American Statistical Institute (IA-SI) in an attempt to produce adequate data for comparisons among these countries.
Brazil had participated in the early experi-ments of this methodology which became known as the Atlantida Plan (US Bureau of Census12, 1966). The name is related to a hypothetical country having the same basic characteristics as any Latin-American country in which a national household survey is planned, all the calculations concerning the sampling are performed, results are produced and the analysis is made.
Multistage Random Sample
Although the present study demanded only a regional survey the Atlantida Plan methodology was still useful as a background. Each sub-district was considered a Primary Sampling Unit (US Bureau of Census12,1966) from which to draw a fixed proportion of clusters (10%) - these clus-ters being the same as were used by the census, with a fairly standard size of about 300 house-holds. Such clusters were selected by a proportio-nate random sample - based on the number of households - from a list of clusters in each sub-district. Having selected the clusters, the sample of elderly people was randomly selected from a constructed list of elderly people living in each selected cluster. Every household in the selected clusters was enumerated by age and sex* . From a list of people aged 65 or over, stratified by sex, and with a known address, a random sample was ta-ken, again using a fixed proportion (30%). The overall sampling fraction for every sub-district was 3/100 (Chart). As the survey aimed at a des-criptive profile of the elderly living in different
socio-economic environments, the choice of a sampling fraction was very much based on the availability of resources, with a view to achiering a reasonable Standard Error.
DISCUSSION
A sample of 303 elderly people selected by the methodology described above was intervie-wed at home by trained interviews. The instru-ment used was the BOMFAQ - Brazilian version of the OARS Multidimensional Functional As-sessemnt Questionnaire - and covered five basic dimensions: socio-economic status, physical health, mental health, independence in the acti-vities of daily living, and social integration. A full description of results are presented elsewhere (Ramos10, 1987). For the purpose of analysing the validity of the methodology used, the most important finding of the survey concerned the significant differences found between the elderly living in the poor sub-district ("Brasilândia") and the wealthy sub-district ("Aclimação"). The stra-tification process using the sub-districts as socio-economic strata successfully selected totally dif-ferent populations as regards the socio-economic
status of the elderly. The average per capita inco-me was as low as US$ 32 per month in "Brasilân-dia", actually eight times lower than in "Aclima-ção" - US$ 233 per month. In "Brasilândia", in fact, none of the households had an average per capita income of more than US$ 100 per month, compared with 25% of the households in "Vila Guilherme" and 52% in "Aclimação"as shown in Table 7 (p< 0.00001).
In "Brasilândia", for instance, the typical elderly person was a migrant from a rural area, illiterate and living in the place of the interview for less than ten years. The tendency in "Brasilân-dia" was for the elderly to be black, widowed, with a large family, living in very poor housing condi-tions with no sewers, with at least three other people in the household including children and
grand-children.
In contrast, the typical elderly person in "Aclimação" had an urban background, had at least a high-school degree and had lived in the place of the interview for more than ten years.
He or she tended to be white, married, with a relatively small family, living in good housing conditions with sewers, and sharing the dwelling with no more than one other person, usually the spouse (Ramos10,1987).
educational level, migration history, and housing conditions of the person's life. Public health po-licies can, thus, be directed towards target areas, which will demand specific policies which take the idiosyncrasies of each area into consideration. Moreover, such stratification overcomes the pro-blems of classifying the elderly by socio-economic status using their occupation or income, conside-ring that elderly people are no longer economi-cally productive. From the epidemiological standpoint the results of this survey indicate that any relevant analysis of the well-being of the el-derly has to consider as the main independent variable their socio-economic status.
Interestingly enough, the elderly themselves seemed a good indicator of the socio-economic status of the population, as the proportion of elderly in the total population showed a good correlation with the median family income and availability of sanitation in the area. Such a strong association suggests that the socio-economic
stratification can be further simplified by using the elderly themselves as an indicator. Areas with a high proportion of elderly people, for instance, are likely to be areas where the majority of the population, at least the elderly population, have high incomes, good housing conditions and good education and basic amenities. Whether this stra-tification holds true for other cities and indeed other countries is a matter that deserves further investigation.
ACKNOWLEDGEMENTS
To Alexandre Kalache (London Univer-sity), to Gerda Fillenbaum (Duke UniverUniver-sity), and to Jenny Roberts (London University) for their thoughtful comments on early versions of this article. To the 'Conselho Nacional de Desen-volvimento Científico e Tecnológico - CNPq, the 'Fundação de Amparo à Pesquisa do Estado de São Paulo' - FAPESP, and the British Council for the financial support received.
RAMOS, L.R. & GOIHMAN, S. Estratificação geográfica por nível sócio-econômico: metodologia utilizada em um inquérito domiciliar com idosos residentes em São Paulo, Brasil. Rev. Saúde públ., S. Paulo, 23: 478-92,1989.
RESUMO: Em países como o Brasil é sempre problemático conseguir-se uma amostra populacional randomisada e representativa dada a inexistência de um catálogo atualizado e global da população residente na comunidade. Discute-se a metodologia de estratificação geográfica por nível sócio-econômico utilizada para conseguir uma amostra randomisada em múltiplos estágios de uma população de idosos residentes na cidade de São Paulo. O estudo aponta para o fato de a proporção de idosos na população total de uma determinada área da cidade ter se mostrado uma variável com poder discriminante do nível sócio-econômico da população. Discute-se a validade do método de estratificação a partir dos dados coletados no inquérito.
DESCRITORES: População urbana. Idosos. Amostragem. Métodos. Fatores sócio-econômicos.
REFERENCES
1. FUNDAÇÃO IBGE. Censo demográfico: São Paulo. Rio de Janeiro, 1973. v.1, t.18, pt. 3. (8° Recenseamento Geral do Brasil, 1970).
2. FUNDAÇÃO IBGE. Censo demográfico. Dados distritais: São Paulo. Rio de Janeiro, 1982. v.1, t.3, n.17. (9° Recenseamento Geral do Brasil, 1980).
3. FUNDAÇÃO IBGE. Censo demográfico. Famílias e domicílios: SãoPaulo. Rio de Janeiro, 1983.v.1, t.6,n.19. (9° Recenseamento Geral do Brasil, 1980).
4. FUNDAÇÃO IBGE. Metodologia da Pesquisa Nacional por Amostra de Domicílios (PNAD) na década de 70. Rio
de Janeiro, 1981.
5. FUNDAÇÃO IBGE. Indicadores sociais: tabelas selecionadas. Rio de Janeiro, 1984. v.2.
6. FUNDAÇÃO SEADE. Anuário Estatístico do Estado de São Paulo: 1983. São Paulo, 1987.
7. GOVERNO DO ESTADO DE SÃO PAULO. Áreas homogêneas: Município de São Paulo. São Paulo, 1976. (Estudos e Pesquisas 14).
8. KALACHE, A.; VERAS, R.P.; RAMOS, L.R. O envelhecimento da população mundial: um desafio novo. Rev. Saúde públ., S. Paulo, 21:200-10,1987.
10. RAMOS, L.R. Growing old in São Paulo, Brazil: assessment of health status and social support of elderly people from different socio-economic strata living in the community. London, 1987. [PhD Dissertation-London School of Hygiene and Tropical Medicine. University of London].
11. RAMOS, L.R.; VERAS, R.P.; KALACHE, A. Envelhecimento populacional: uma realidade brasileira. Rev. Saúde públ., S. Paulo, 21:211-24,1987.
12. US BUREAU OF THE CENSUS. Atlantida: a case study in household sample surveys - unit IV sample design. Washington, D.C., 1966. (Series ISPO 1, № 1-E). 13. US NATIONAL HEALTH SURVEY AND THE
BUREAU OF CENSUS. The statistical design of the
health household-interview survey. Washington, D.C.,
1958.
14. V E R A S , R.P.; RAMOS, L.R.; KALACHE, A. C r e s c i m e n t o da população idosa no Brasil: transformações e conseqüências na sociedade. Rev. Saúdepúbl., S. Paulo, 21:225-33,1987.