Patterns in Abundance, Cell Size and Pigment
Content of Aerobic Anoxygenic Phototrophic
Bacteria along Environmental Gradients in
Northern Lakes
Lisa Fauteux1, Matthew T. Cottrell2, David L. Kirchman2, Carles M. Borrego3, Maria Carolina Garcia-Chaves1, Paul A. del Giorgio1*
1Groupe de Recherche Interuniversitaire en Limnologie (GRIL), Département des sciences biologiques, Université du QuébecàMontréal, CP 8888, Montréal, Québec, Canada,2School of Marine Science and Policy, University of Delaware, 700 Pilottown Rd., Lewes, DE 19958, United States of America,3Group of Molecular Microbial Ecology, Institute of Aquatic Ecology, University of Girona, Campus de Montilivi, E-17071, Girona, Spain
* del_giorgio.paul@uqam.ca
Abstract
There is now evidence that aerobic anoxygenic phototrophic (AAP) bacteria are widespread across aquatic systems, yet the factors that determine their abundance and activity are still not well understood, particularly in freshwaters. Here we describe the patterns in AAP abundance, cell size and pigment content across wide environmental gradients in 43 temperate and boreal lakes of Québec. AAP bacterial abundance varied from 1.51 to 5.49 x 10⁵cells mL-1, repre-senting<1 to 37% of total bacterial abundance. AAP bacteria were present year-round, includ-ing the ice-cover period, but their abundance relative to total bacterial abundance was significantly lower in winter than in summer (2.6% and 7.7%, respectively). AAP bacterial cells were on average two-fold larger than the average bacterial cell size, thus AAP cells made a greater relative contribution to biomass than to abundance. Bacteriochlorophylla(BChla) con-centration varied widely across lakes, and was not related to AAP bacterial abundance, sug-gesting a large intrinsic variability in the cellular pigment content. Absolute and relative AAP bacterial abundance increased with dissolved organic carbon (DOC), whereas cell-specific BChlacontent was negatively related to chlorophylla(Chla). As a result, both the contribution of AAP bacteria to total prokaryotic abundance, and the cell-specific BChlapigment content were positively correlated with the DOC:Chlaratio, both peaking in highly colored, low-chloro-phyll lakes. Our results suggest that photoheterotrophy might represent a significant ecological advantage in highly colored, low-chlorophyll lakes, where DOC pool is chemically and structur-ally more complex.
OPEN ACCESS
Citation:Fauteux L, Cottrell MT, Kirchman DL, Borrego CM, Garcia-Chaves MC, del Giorgio PA (2015) Patterns in Abundance, Cell Size and Pigment Content of Aerobic Anoxygenic Phototrophic Bacteria along Environmental Gradients in Northern Lakes. PLoS ONE 10(4): e0124035. doi:10.1371/journal. pone.0124035
Academic Editor:Jack Anthony Gilbert, Argonne National Laboratory, UNITED STATES
Received:January 29, 2013
Accepted:March 10, 2015
Published:April 30, 2015
Copyright:© 2015 Fauteux et al. This is an open access article distributed under the terms of the Creative Commons Attribution License, which permits unrestricted use, distribution, and reproduction in any medium, provided the original author and source are credited.
Funding:The research was supported by grants from the National Science and Engineering Research Council of Canada to Paul del Giorgio, and a US National Science Foundation grant DEB-0814918 to Matthew Cottrell. The funders had no role in study design, data collection and analysis, decision to publish, or preparation of the manuscript.
Introduction
Aerobic anoxygenic phototrophic bacteria are members of Proteobacteria that synthesize bacteriochlorophylla(BChla), which is incorporated into a functional photosynthetic system and allows them to carry out anoxygenic photosynthesis only under aerobic conditions. The photo-induced cyclic electron transport results in the production of energy, but AAP bacteria do not possess the key enzymes needed for CO2fixation in the Calvin cycle, thus they are inca-pable of growing without a source of organic carbon [1]. Light therefore provides an energy supplement to their mainly chemotrophic metabolism, allowing them to function as photohe-terotrophs [2,3]. Accumulated evidence suggests that AAP bacteria, as a group, are a diverse, dynamic and likely globally significant component of aquatic microbial communities [4–6].
AAP bacteria inhabit a wide range of aquatic systems; their abundance and distribution have been explored in open-ocean [7–11], coastal and estuarine habitats [12–14] as well as in lakes [15–18] and rivers [19]. The contribution of AAP bacteria to total bacterial abundance has been shown to be in the range of 1 to 11% in marine systems [9,12,20] and to vary consid-erably more, between 1 to 30%, across freshwater ecosystems [15,22]. Factors such as associa-tion to particles [14], temperature [13,18,22], light availability [12,18,23], phosphorous [16], chlorophylla(Chla) [20,21] and dissolved organic carbon (DOC) [15,18] have been identified as the environmental drivers that best explain this variation, but the role of these drivers is still not well understood. AAP abundance has been shown to increase with Chla, total phosphorous (TP) content or with DOC concentration in a handful of marine and freshwater surveys [16,18,20,21,24]. The positive trend observed between AAP abundance and trophic status [16,20] does not support the hypothesis, initially held by some studies [15,25], that the ability of these bacteria to use light should be especially advantageous in nutrient-poor environments. Moreover, the negative relationship between AAP abundance and water transparency observed in some marine and freshwater studies [18,23] and the lack of a light enhancement on AAP ac-tivity in short incubations in artic and estuarine waters experiments [6,26] seems to be in con-flict with the potential ecological advantage that photoheterotrophy might confer to this group. AAP bacteria are likely reacting to several superimposed gradients, and are probably regulated by multiple factors, thus the question regarding the environmental conditions that explain AAP abundance and performance remains to be solved.
The greater heterogeneity of freshwater systems relative to marine environments offers an opportunity to address the role of most of the identified drivers of AAP abundance and distri-bution, but particularly to study the effects of the overlapping gradients of DOC, nutrients and light on this group of photoheterotrophic bacteria. In lakes, the composition of DOC varies in quantity and quality depending on the balance between local primary production and the input of organic compounds from terrestrial sources [27,28]. Lakes exhibit a large gradient of DOC that differentially combines a highly labile pool of low molecular weight compounds of algal and terrestrial origin with a more refractory pool of heavy and highly coloured sub-stances mostly of terrestrial origin [29]. Interestingly, this highly coloured pool of DOC has an impact on the aquatic light climate [30], which in turn shapes the environmental conditions for the photoheterotrophic organisms. Besides this spatial DOC heterogeneity, lakes in cold temperate regions develop ice and snow cover in winter, a condition that further modifies the availability of light and results in another ecologically interesting scenario for the regulation of AAP bacteria.
to maximize both trophic (in terms of phosphorous and chlorophylla) and dissolved organic carbon (DOC) gradients. We further assessed the presence of AAP bacteria in winter under ice-cover and along depth profiles in stratified lakes, to explore the possible interaction between resources and light availability.
Materials and Methods
Sites and sampling
This study targeted lakes in three distinct regions of northern Québec: The Eastmain River re-gion of boreal Québec (52°14’N, 75°W), which contains an extensive freshwater network cover-ing over 20% of the landscape. This region is characterized by mature evergreen forest
dominated by black spruce (Picea mariana). The Laurentian region is located in the Canadian Shield, north of Montréal (45°59’N, 74°01’W), dominated by granitic bedrock and mostly cov-ered by mixed forest (>95%). The Eastern-Townships region is located east of Montréal (45° 24’N, 72°12’W) in the St-Lawrence Lowlands, dominated by sedimentary geology that results in a higher average pH and alkalinity lakes [31].
In all, 43 lakes were sampled, 17 in the boreal region (S1 Table), 13 in the Eastern Town-ships (S2 Table), and 13 in the Laurentians (S3 Table). Of these, 26 were sampled only once, whereas 17 were visited on more than one occasion. Thirteen out of these 17 lakes were sam-pled three to six times, including at least one under-ice sample. No specific permissions were required for sampling the lakes, all of which have public access. The field studies did not in-volve endangered or protected species, or vertebrates.
Sampling was always conducted over the deepest part of the lakes and at each sampling lo-cation, we carried out a complete vertical profile of temperature, oxygen, and conductivity, using a 600 XLM-M probe (YSI) and we measured Secchi disk depth. The water samples were only collected from fully aerobic layers, always at one-meter depth for surface samples and ad-ditionally deeper when metalimnia were sampled, using a peristaltic pump. During the ice-cover period, sampling was carried out through a hole made through the ice. In all cases, the samples were collected into 18-L carboys and processed in the lab within 4 to 6 hours.
Abundance and size of AAP bacteria
For a subset of 13 samples, we prepared replicate filters to compare the variation in average counts between two fields from the same filter with the variation between fields from the two replicate filters. The average coefficient of variation between fields within a sample was similar to the average for fields from replicate filters (33.3 ± 8.4% and 28.9 ± 3.6%, respectively).
Pigment analysis
Water samples (from 1 to 18L, depending on the lake and sample type) were filtered through 47mm-diameter GF-F glass microfiber filters (Whatman) and stored at -80°C until processing. This filter has a nominal pore size of 0.7μm, but our previous experience has shown that it ef-fectively retains smaller particles, especially when large volumes of water are passed and the fil-ter tends to clog. All further manipulations were carried out at room temperature and under dim light to prevent photo-oxidation of labile pigments. Filters were thawed and cut into small pieces using sterile scissors. Pigments were extracted in acetone:methanol (7:2 vol:vol, Scharlau HPLC Grade) after a mild sonication for 30s at 4°C using a B-Braun Labsonic 2000 disruptor. Extracts were stored overnight at -30°C, then clarified by vacuum filtration. Eluents from this first extraction were collected in light-protected sterile Falcon tubes and the remaining filter fiber matrix was re-used for two additional extraction steps to ensure complete pigment recov-ery. Sample eluents were then combined and stored at -30°C until analysis by reversed-phase HPLC, according to Borrego and Garcia-Gil [34]. This method takes longer (60 min) than other chromatographic programs commonly used to detect BChlafrom AAP bacteria [35][36], but it offers a better resolution on the separation of other algal and bacterial pigments that can interfere in the identification of BChla(e.g. bacteriochlorophylls and carotenoids from anoxy-genic photosynthetic bacteria that can be present in deep, anoxic water layers of some lakes). BChla, Chlaand chlorophyllb(Chlb) peaks were identified from their retention times and ab-sorption spectra using the online diode array detector, coupled to the chromatographic system. Peak areas were recorded at 771nm (BChla), 432nm (Chla) and 465nm (Chlb) and converted to concentrations after calibration using pigment standards and appropriate extinction coeffi-cients [37].
Chemical analysis
Total phosphorus (TP) was measured using the molybdenum-blue method, after potassium persulfate digestion. DOC was measured on a TOC1010 total carbon analyzer (OI Analytical) using a high-temperature sodium persulfate oxidation method. For Chladeterminations, we filtered one liter of water on 47mm-diameter GF-F glass microfiber filters (Whatman), ex-tracted the filter in hot ethanol, stored it overnight at 4°C, then determined the absorbance of the extract at 665nm and 750nm, using a UV/Vis UltroSpec 2100 spectrophotometer (Bio-chrom Ltd.). We have used this estimate for all subsequent analyses, but note that there was good agreement between the spectrophotometric and the HPLC-based chlorophyll estimate described in the previous section.
Statistical Analysis
Results
Our measurements include both seasonal sampling from several lakes, as well as single-point summer sampling for a wider range of lakes (seeS1–S3Tables for detailed information). We used only the summer (June to September) data to assess large-scale spatial patterns across lakes; these data span a broad range of environmental gradients. Chlaand TP concentrations varied 100-fold among those lakes (0.8 to 55.4μg L-1, and 3.6 to 177μg L-1, respectively), whereas DOC varied 6-fold (2.3 to 12.8 mg L-1).
Even though all the lakes sampled were thermally stratified in summer and winter, the verti-cal profiles of dissolved oxygen confirmed the fully aerobic conditions of 41 out of the 43 lakes sampled. Croche and Bran-de Scie were the only two lakes with a well-developed anaerobic hy-polimnion. These two lakes typically had high thermal stability during stratification (Schmidt stability index of 72 and 30 J m-2respectively) [38], which prevented any significant mixing of aerobic and anaerobic layers, reducing the possibility of having anaerobic prokaryotes in the oxygenated epilimnetic and metalimnetic layers. We can therefore safely assume that the mi-croscopic enumeration of bacteria and the extracted BChlaoriginate from AAP bacteria.
Magnitude of AAP bacterial abundance, cell size and total biovolume
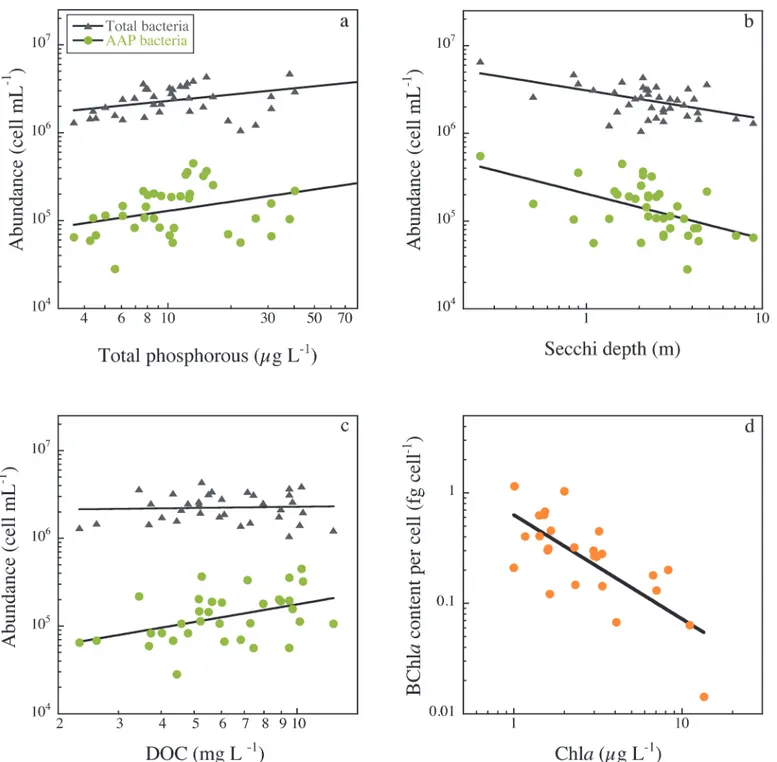
AAP bacteria were detected in all the 140 samples (seeS4 Tablefor detailed abundance data) and their abundance spanned two orders of magnitude, from 1.51x10³to 5.49x10⁵cells mL-1 (mean 1.21x10⁵± 9.1x10³cells mL-1); the resulting proportion of AAP bacteria varied from 0.07% to 37.3% (mean 5.40 ± 4%). AAP bacterial abundance increased with total prokaryotic abundance (Fig 1A), but the relative proportion of AAP bacteria was not correlated with total prokaryotic abundance. Total bacterial cell size varied four-fold across all samples, from 0.01 to 0.04μm3(mean 0.02 ± 0.0005μm3), whereas AAP bacterial cell size varied twenty-fold, from 0.01 to 0.21μm3(mean 0.04 ± 0.004μm3), and both were positively related (Fig 1B). The log-slope of this relationship was 1.64, which suggests that AAP bacterial cell size is considerably more variable than the average bacterial size over the range of lakes. Moreover, AAP bacterial cells were on average two-fold larger than average bacterial cells (Studentt-testn= 140, p<0.0001). The total bacterial biovolume, calculated as the product of cell size and abun-dance, varied 30-fold (5 to 178 x 103μm3mL-1), whereas the total biovolume of AAP bacteria varied 10-fold (0.2 to 22 x 103μm3mL-1). Since AAP bacterial cells where significantly larger, their average contribution to total bacterial biovolume was significantly higher (mean 9.5% ± 0.8) than their average contribution to total abundance (Studentt-test, n = 140,p<0.0001)
(Fig 1C).
Bacteriochlorophyll
a
concentrations
BChlaconcentrations varied from 11 to 47 ng L-1in the surface waters of the lakes sampled over the open water season, and from 5 to 47 ng L-1along depth profiles. Contrary to previous results [25], there was no relationship between AAP abundance, determined using IR micros-copy, and the concentration of BChla, measured by HPLC. There was a four-fold range in BChlaconcentration for any given AAP cell abundance (S1 Fig).
Temporal variability
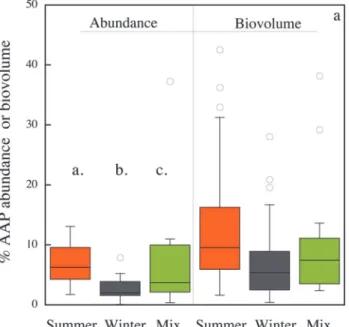
little across seasons, whereas AAP bacterial abundance clearly declined in winter, and thus there were significant seasonal differences in the contribution of AAP bacteria to total abun-dance (ANOVA,n= 99,p<0.0001;Fig 2A). The relative contribution of AAP bacteria was lowest in winter (mean 2.6 ± 0.3%), highest in summer (mean 7.7 ± 0.8%), and intermediate during spring and autumn mixing (mean 5.2 ± 0.9%). AAP bacterial abundance did not corre-late with water temperature, yet the proportion of AAP bacteria significantly increased with water temperature (Table 1). AAP bacteria contributed to total volume more than they contrib-uted to abundance (Fig 2A). The average bacterial cell size remained relatively constant, and was not significantly different among seasons (overall mean 0.02 ± 0.007μm3,Fig 2B), whereas the average AAP bacterial cell size varied significantly among seasons (ANOVA, n = 82, p<0.005). On average the cell size of AAP bacteria was lowest in winter. Within each period, AAP bacteria were always significantly larger than the average bacteria (Fig 2B). AAP bacterial cell size decreased with increasing water temperature (Table 1).
Depth-related variability
The vertical profiles in four of the temperate lakes (lakes Croche, Connely, Bowker, and Brand-de-Scie), sampled in July 2008 during summer stratification, revealed relatively constant total bacterial abundance at all depths, and increasing AAP bacterial abundance with depth. AAP bacterial abundance was on average highest in the metalimnion; overall, the contribution of AAP bacteria to total bacterial abundance increased with depth (Fig 3). In several vertical pro-files we analyzed the abundance of AAP but also BChlaconcentration (ng L-1), the pigment content per cell (fg BChlacell-1), and the pigment density per cell (fg BChlaμm-3). The average BChlaconcentration (Epi: 25.3 ± 5.9 and Meta: 26.9 ± 2.5 ng BChlaL-1) and the pigment con-tent per cell (Epi: 0.43 ± 0.1 and Meta: 0.8 ± 0.6 fg BChlacell-1) in the metalimnion were not different from the concentration in the epilimnion. However, there was a greater difference be-tween depths in the pigment density per cell (Fig 3). AAP bacterial cells in the epilimnion con-tained almost two-fold more BChla(14.9 fg BChlaμm-3) than those in the metalimnion (8.9 fg BChlaμm-3). Metalimnetic AAP bacteria were on average larger, albeit not significantly (data not shown), and thus some of the differences in pigment density were the result of increases in cell volume without concomitant increases in pigment content.
Spatial variability among lakes
Since not all lakes had similar temporal coverage, we used the summer data from the 43 lakes to assess patterns in total bacteria and AAP bacteria variables along environmental gradients. Total bacterial and AAP abundance increased with total phosphorous (Fig 4A) and Chla
(Table 1), and both were negatively correlated with Secchi disk depth (Fig 4BandTable 1).
AAP bacterial abundance was significantly positively related to DOC, whereas total bacterial abundance did not vary with DOC (Fig 4CandTable 1). As a result, the contribution of AAP bacteria to total abundance was positively related to DOC (Table 1). Interestingly, the average size of AAP bacteria also tended to increase with DOC concentration, and consequently AAP bacterial biovolume also tended to significantly increase with DOC (Table 1). BChla concentra-tion was not significantly correlated to Chlaand remained relatively constant across the Fig 1. Relationship between total prokaryote abundance and (a) AAP bacterial abundance and (b) cell size. (c) Contribution of AAP bacteria to total abundance (%AAP) versus their contribution to total bacterial biovolume (%BV).The line in (a) and (b) is the least-square regression, and details of the regression models are given inTable 1. The line in (c) is the 1:1 line. Data have been log-transformed, and the plots comprise all data collected between July 2007 and October 2008.
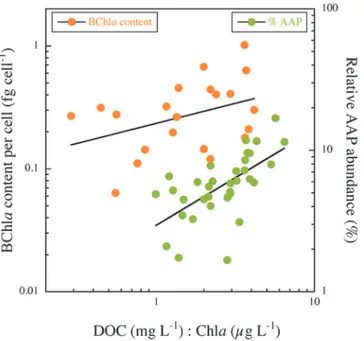
trophic gradient (data not shown). The cell-specific BChlacontent, however, decreased expo-nentially across the Chlagradient (Fig 4DandTable 1). The best individual predictor of both relative AAP bacterial abundance and of the cell-specific BChlacontent was the ratio of DOC to Chla(Fig 5andTable 1). The highest relative abundance of AAP bacteria and the highest cell-specific BChlacontents occurred in lakes having both the highest DOC and lowest Chla concentrations (Table 1).
Fig 2. Seasonal patterns in the contribution of AAP bacteria to (a) total bacterial abundance and to biovolume, and (b) in the average cell size of AAP and total bacteria.The box-and-whisker plots show the average, 75% quartiles and extremes values, and stars indicate significant differences (p<0.05).
Discussion
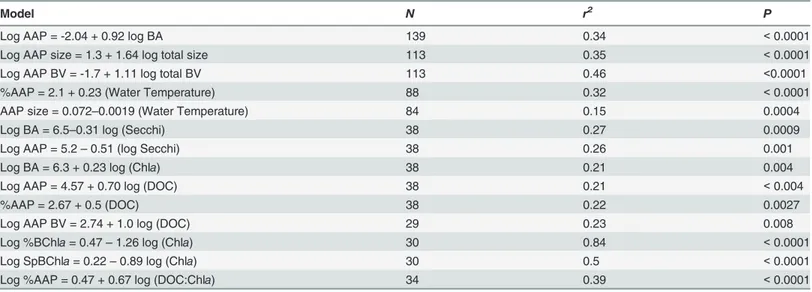
We detected AAP bacteria in samples from all 43 lakes studied, thus confirming the widespread presence of this group in northern lakes having different biological, chemical and physical fea-tures. We found that the relative contribution of AAP bacteria to total prokaryotic abundance ranged from less than 1% to 37%, which is well within the range previously reported for lakes [15,16,18,21]. AAP bacteria clearly tracked total cell abundance, both across systems, and with-in systems over time. The covariation of AAP and total bacterial abundance is implicit with-in sever-al previous studies [13,24,39] but has seldom been actually quantified [20][40]. This pattern of Table 1. Regression models relating AAP bacteria variables to total bacteria or describing the cross-lake patterns in AAP bacteria and total bacte-ria as a function of environmental vabacte-riables.
Model N r2 P
Log AAP = -2.04 + 0.92 log BA 139 0.34 <0.0001
Log AAP size = 1.3 + 1.64 log total size 113 0.35 <0.0001
Log AAP BV = -1.7 + 1.11 log total BV 113 0.46 <0.0001
%AAP = 2.1 + 0.23 (Water Temperature) 88 0.32 <0.0001
AAP size = 0.072–0.0019 (Water Temperature) 84 0.15 0.0004
Log BA = 6.5–0.31 log (Secchi) 38 0.27 0.0009
Log AAP = 5.2–0.51 (log Secchi) 38 0.26 0.001
Log BA = 6.3 + 0.23 log (Chla) 38 0.21 0.004
Log AAP = 4.57 + 0.70 log (DOC) 38 0.21 <0.004
%AAP = 2.67 + 0.5 (DOC) 38 0.22 0.0027
Log AAP BV = 2.74 + 1.0 log (DOC) 29 0.23 0.008
Log %BChla= 0.47–1.26 log (Chla) 30 0.84 <0.0001
Log SpBChla= 0.22–0.89 log (Chla) 30 0.5 <0.0001
Log %AAP = 0.47 + 0.67 log (DOC:Chla) 34 0.39 <0.0001
AAP: Aerobic anoxygenic phototrophic bacterial abundance; BA: Total bacterial abundance; Total size: Total prokaryotic cell size; BV: total biovolume; SpBChla: Pigment content per cell; %BChla: relative contribution of BChlato total pigments; Secchi: Secchi disc depth; DOC: Dissolved organic carbon.
doi:10.1371/journal.pone.0124035.t001
Fig 3. The average and distribution of the relative abundance of AAP bacteria (%AAP), and of the pigment content per cell volume (fg BChlaμm-3) in the epilimnion and in the metalimion of selected lakes.The box-and-whisker plots show the average, 75% quartiles and extremes values in the epilimnetic and metalimnetic layers during lake summer stratification.
covariation would suggest that AAP bacteria respond to the same basic environmental drivers and are subject to a similar overall regulation as the bulk of the bacterial community. However, AAP bacteria do appear to be more dynamic than the community as a whole, which was re-vealed by a larger spatial and temporal variability in cell abundance and cell size relative to the total bacterial community.
Fig 4. The relationship of total bacterial abundance (triangles) and AAP bacterial abundance (circles) with total phosphorous concentration (a), Secchi depth (b), and DOC concentration (c). BChlacontents per cell as a function of mean lake chlorophyll concentration (d). Data have been log-transformed, the line is the least-square regression, and details of the regression models are given inTable 1.
There was significant seasonal variability in both the absolute and the relative abundance of AAP bacteria. A clear seasonal pattern observed in these lakes was a steep decline in absolute and relative abundance of AAP bacteria in winter during ice cover. Few studies have explored the seasonal dynamics of AAP bacteria, especially under the ice, and these are in general agree-ment with our current results. For example, Mašinet al. previously reported seasonal variations in the abundance of AAP bacteria in two European lakes [15]. These authors observed maxi-mum AAP numbers in summer and minimaxi-mum values in winter, although not necessarily under ice cover. Similarly, AAP bacterial abundance was observed to decrease from summer to winter in coastal waters of the West Antarctic Peninsula [26], in the Northwestern Mediterra-nean Sea [12], as well as in Arctic waters [41]. Our results together with previous observations indicate that winter conditions are either unfavourable for the growth of AAP bacteria, and/or that AAP bacteria may persist in the system but may regulate their light harvesting pigment content and therefore go undetected by epifluorescence microscopy.
Despite the clear AAP abundance decline observed in winter, AAP cells containing BChla were still detectable under the ice in these northern lakes, as was previously reported for the Arc-tic Ocean [41]. Recently, Kirchman and Hanson [42] estimated the energy yields and costs asso-ciated to photoheterotrophy in AAP bacteria. According with their calculations, light intensities greater than 400μmol photons m−2s−1are required for phototrophy to yield sufficient energy to
meet the maintenance cost of an AAP cell. Therefore, the presence of the photosynthetic appara-tus probably offers only a small metabolic advantage under the low light intensities characteristic of ice-covered surface waters. This issue is closely related to the strategies of pigment production and regulation in AAP bacteria. The lack of relationship between AAP abundance and BChla concentration (S1 Fig) implies that the concentration of pigment per cell varies greatly and that a higher number of AAP is not necessarily translated into a higher concentration of total pig-ment. In this regard, we found that pigment density (as fg BChlaμm-3) was on average lower in the metalimnion, in agreement with previous studies that have reported a decline in AAP Fig 5. The contribution of AAP bacteria to total bacterial abundance (%AAP, squares) and the BChla
content per cell (circles) as function of the DOC to Chla(DOC:Chla) ratio.The data have been log-transformed, the line is the least-square regression, and details of the regression models are given inTable 1.
pigment content per cell with depth [9,32]. This pattern could reflect a lower dependence of AAP bacteria on phototrophy as light is attenuated, and the existence of a threshold of light in-tensity for the expression of phototrophy, although we are still far from understanding the role of phototrophy in the ecology and bioenergetics of AAP bacteria.
Light availability has been proposed as the main driver of the temporal variation in relative AAP bacterial abundance. Shorter days and low light intensity have been previously suggested as drivers of the changes in abundance of this photoheterotrophic group of bacteria during winter [12,26]. The role of light in governing AAP abundance and activity, however, is still un-clear [40,43]. Our results together with another previous freshwater study [18] evidenced a negative relationship of AAP abundance and water transparency, which is contrary to the hy-pothesized positive effect of light. Our results are in agreement with two recent studies that quantified the single cell activity of AAP bacteria (using micro-autoradiography) which re-ported no light enhancement of AAP growth [6,26]. We might therefore hypothesize that whereas light-derived energy may have little direct effect on growth, it might nevertheless play a role in sustaining other aspects of cell energy metabolism.
We have shown that the AAP bacterial abundance and biomass increased with phosphorous concentration and overall system productivity. In addition, specific BChlacontent decreased exponentially from oligotrophic to eutrophic conditions, which would suggest that the hetero-trophic metabolism of AAP bacteria, which is linked to DOC consumption, is favoured in the most productive systems, as has been previously shown [20]. We also found that the relative contribution of AAP bacteria to total prokaryotic abundance did not reach its maximum in the most oligotrophic lakes, but rather followed a gradient in the DOC:Chlaratio, peaking in high DOC, low chlorophyll lakes. Interestingly, we found that the BChlacontent per cell clearly fol-lowed the same gradient, also peaking in dystrophic lakes. These results suggest that it is in high DOC, low chlorophyll lakes where AAP phototrophy is mostly expressed.
We have further shown that lake AAP bacteria are significantly larger than the average bac-terial cells in these communities, as was noted before for marine systems [9,26,33]. One of the consequences of the larger size of AAP bacteria is that their contribution to total bacterial bio-mass is almost two-fold higher than their contribution to abundance (overall average of 10% and 6%, respectively). Furthermore, cell size provides valuable insight into the trophic signifi-cance of AAP bacteria. A larger size renders AAP cells more vulnerable to grazers [49,50]. If AAP bacteria are more intensely grazed than the bulk bacterial community, their production will be then preferentially transferred to higher trophic levels. The only study so far to have ex-plored the top-down control of AAP abundance, showed that AAP bacteria were subjected to high grazing pressure, and this process was responsible for the low densities of this fast-grow-ing group [4]. In addition to being larger than the average bacterial cells, AAP cells appear to be more dynamic in terms of size: we observed that AAP cell size varied twenty-fold across all lake samples whereas total bacterial cell size varied only four-fold; previous studies have also reported large variations in AAP cell size [26,51]. We hypothesize that shifts in top-down pres-sure on AAP bacteria probably contribute to the variation in their cell size.
Linked to the issue of the potential ecological implications of photoheterotrophy is the ques-tion of whether cells that contain BChlaand express the associated metabolic function can be considered a true functional group, sharing common regulation and environmental require-ments. It is now clear that AAP bacteria are ubiquitous, we know that thepufoperon is widely distributed within the Proteobacteria [17,18,52], and that many coexisting phylotypes can ex-press this function within a given environment [12,53], but it still is not established to what ex-tent photoheterotrophy plays a role in the distribution of these bacterial taxa. There are two scenarios under which AAP bacteria could form an ecologically coherent group: 1) the meta-bolic functionality conferred by this trait is of such relevance that it overrides differences in other traits; 2) the functionality conferred by AAP metabolism is not in itself determinant, but its presence is linked to other key functional traits, such as tolerance to environmental condi-tions, metabolic plasticity, and functional capacities.
Supporting Information
S1 Fig. The relationship between AAP bacterial abundance and bacteriochlorophylla
(BChla) concentration.
(TIF)
S1 Table. Location and environmental characteristics for the lakes in the boreal (BOR) re-gion.Averages of environmental variables are presented for the summer of 2008.aFrequency of sampling. Secchi, secchi disk mean depth; DO, dissolved oxygen; DOC, dissolved organic carbon; TP, total phosphorous.
(PDF)
S2 Table. Location and environmental characteristics for the lakes in the eastern townships (EST) region.Averages of environmental variables are presented for the summer of 2008.a Fre-quency of sampling. Secchi, secchi disk mean depth; DO, dissolved oxygen; DOC, dissolved or-ganic carbon; TP, total phosphorous.
(PDF)
S3 Table. Location and environmental characteristics for the lakes in the laurentians (LAU) region.Averages of environmental variables are presented for the summer of 2008.aFrequency of sampling. Secchi, secchi disk mean depth; DO, dissolved oxygen; DOC, dissolved organic carbon; TP, total phosphorous.
(PDF)
S4 Table. Total bacterial abundance and the contribution of AAP bacteria to total bacterial abundance (%AAP) in the three broad seasonal categories: summer (stratification period), winter (ice cover period) and a mixed period.Average values are presented for each one of the 43 lakes sampled.
(PDF)
Acknowledgments
We thank Marilou Bergevin, Catherine Beauchemin, Alice Parkes, Delphine Marchand, Annick St-Pierre, Pierre Marcoux and Véronique Ducharme-Riel for their help with collection and analysis of samples, two anonymous reviewers for constructive comments, and H.S.C for inspiration.
Author Contributions
Conceived and designed the experiments: LF PDG. Performed the experiments: LF PDG. Ana-lyzed the data: LF PDG MTC MCGC. Contributed reagents/materials/analysis tools: DLK MTC CMB. Wrote the paper: LF PDG MTC MCGC.
References
1. Yurkov V, Csotonyi J (2008) New light on aerobic anoxygenic phototrophs. purple phototrophic Bact: 31–55.
2. Beatty JT (2002) On the natural selection and evolution of the aerobic phototrophic bacteria. Arch Microbiol 73: 109–114.
3. Hauruseu D, Koblížek M (2012) The influence of light on carbon utilization in Aerobic Anoxygenic Phototrophs. Appl Environ Microbiol 78: 7414–7419. PMID:22885759
4. Ferrera I, Gasol JM, Sebastián M, Hojerová E, Koblízek M (2011) Comparison of growth rates of aero-bic anoxygenic phototrophic bacteria and other bacterioplankton groups in coastal Mediterranean wa-ters. Appl Environ Microbiol 77: 7451–7458. doi:10.1128/AEM.00208-11PMID:21724878
6. Stegman MR, Cottrell MT, Kirchman DL (2014) Leucine incorporation by aerobic anoxygenic photo-trophic bacteria in the Delaware estuary. ISME J: 1–10.
7. Palovaara J, Akram N, Baltar F, Bunse C, Forsberg J, et al. (2014) Stimulation of growth by proteorho-dopsin phototrophy involves regulation of central metabolic pathways in marine planktonic bacteria. Proc Natl Acad Sci 111: 3650–3658. doi:10.1073/pnas.1400956111PMID:24497507
8. Nikrad MP, Cottrell MT, Kirchman DL (2012) Abundance and single-cell activity of heterotrophic bacteri-al groups in the western Arctic Ocean in summer and winter. Appl Environ Microbiol 78: 2402–2409.
doi:10.1128/AEM.07130-11PMID:22286998
9. Lamy D, Jeanthon C, Cottrell MT, Kirchman DL, Van Wambeke F, et al. (2011) Ecology of aerobic anoxygenic phototrophic bacteria along an oligotrophic gradient in the Mediterranean Sea. Biogeos-ciences 8: 973–985. doi:10.1101/pdb.prot5659PMID:21807845
10. Lehours A-C, Cottrell MT, Dahan O, Kirchman DL, Jeanthon C (2010) Summer distribution and diversity of aerobic anoxygenic phototrophic bacteria in the Mediterranean Sea in relation to environmental vari-ables. FEMS Microbiol Ecol 74: 397–409. doi:10.1111/j.1574-6941.2010.00954.xPMID:21039650 11. Lami R, Cottrell M, Ras J, Ulloa O, I (2007) High Abundances of Aerobic Anoxygenic Photosynthetic
Bacteria in the South Pacific Ocean. Appl Environ Microbiol 73: 4198–4205. PMID:17496136 12. Ferrera I, Borrego CM, Salazar G, Gasol JM (2013) Marked seasonality of aerobic anoxygenic
photo-trophic bacteria in the coastal NW Mediterranean Sea as revealed by cell abundance, pigment concen-tration and pyrosequencing of pufM gene. Environ Microbiol: 1–13.
13. Salka I, Moulisová V, Koblízek M, Jost G, Jürgens K, et al. (2008) Abundance, depth distribution, and composition of aerobic bacteriochlorophyll a-producing bacteria in four basins of the central Baltic Sea. Appl Environ Microbiol 74: 4398–4404. doi:10.1128/AEM.02447-07PMID:18502937
14. Waidner LA, Kirchman DL (2007) Aerobic anoxygenic phototrophic bacteria attached to particles in tur-bid waters of the Delaware and Chesapeake estuaries. Appl Environ Microbiol 73: 3936–3944. PMID:
17468276
15. Mašín M, Nedoma J, Pechar L, Koblížek M (2008) Distribution of aerobic anoxygenic phototrophs in temperate freshwater systems. Environ Microbiol 10: 1988–1996. doi:10.1111/j.1462-2920.2008.
01615.xPMID:18430010
16. Mašín M,Čuperová Z, Hojerová E, Salka I, Grossart H, et al. (2012) Distribution of aerobic anoxygenic phototrophic bacteria in glacial lakes of northern Europe. Aquat Microb Ecol 66: 77–86.
17. Eiler A, Beier S, Säwström C, Karlsson J, Bertilsson S (2009) High ratio of bacteriochlorophyll biosyn-thesis genes to chlorophyll biosynbiosyn-thesis genes in bacteria of humic lakes. Appl Environ Microbiol 75: 7221–7228. doi:10.1128/AEM.00960-09PMID:19801478
18. Cuperová Z, Holzer E, Salka I, Sommaruga R, Koblížek M (2013) Temporal changes and altitudinal
dis-tribution of aerobic anoxygenic phototrophs in mountain lakes. Appl Environ Microbiol 79: 6439–6446.
doi:10.1128/AEM.01526-13PMID:23956384
19. Ruiz-González C, Proia L, Ferrera I, Gasol JM, Sabater S (2012) Effects of large river dam regulation on bacterioplankton community structure. FEMS Microbiol Ecol: 1–16.
20. Hojerová E, Mašín M, Brunet C, Ferrera I, Gasol JM, et al. (2011) Distribution and Growth of Aerobic
Anoxygenic Phototrophs in the Mediterranean Sea. Environ Microbiol 13: 2717–2725. doi:10.1111/j.
1462-2920.2011.02540.xPMID:21883792
21. Medová H, Boldareva EN, Hrouzek P, Borzenko SV, Namsaraev ZB, et al. (2011) High abundances of aerobic anoxygenic phototrophs in saline steppe lakes. FEMS Microbiol Ecol 76: 393–400. doi:10.
1111/j.1574-6941.2011.01059.xPMID:21265869
22. Mašín M, Zdun A, Stoń-Egiert J, Nausch M, Labrenz M, Moulisová V, et al. (2006) Seasonal changes
and diversity of aerobic anoxygenic phototrophs in the Baltic Sea. Aquat Microb Ecol 45: 247–254. 23. Cottrell MT, Ras J, Kirchman DL (2010) Bacteriochlorophyll and community structure of aerobic
anoxy-genic phototrophic bacteria in a particle-rich estuary. ISME J 4: 945–954. doi:10.1038/ismej.2010.13
PMID:20182527
24. Jiao N, Zhang Y, Zeng Y, Hong N, Liu R, et al. (2007) Distinct distribution pattern of abundance and di-versity of aerobic anoxygenic phototrophic bacteria in the global ocean. Environ Microbiol 9: 3091–
3099. PMID:17991036
25. Kolber Z, Gerald F, Lang A (2001) Contribution of aerobic photoheterotrophic bacteria to the carbon cycle in the ocean. Science 292: 2492–2495. PMID:11431568
27. Docherty KM, Young KC, Maurice PA, Bridgham SD (2006) Dissolved organic matter concentration and quality influences upon structure and function of freshwater microbial communities. Microb Ecol 52: 378–388. PMID:16767520
28. Benner R (2003) Molecular Indicators of the Bioavailability of Dissolved Organic Matter. In: Sinsabaugh SEGFL, editor. Aquatic Ecosystems. Aquatic Ecology. Burlington: Academic Press. pp. 121–137. 29. Bertilsson S, Stepanauskas R, Cuadros-Hansson R, Granéli W, Wikner J, et al. (1999) Photochemically
induced changes in bioavailable carbon and nitrogen pools in a boreal watershed. Aquat Microb Ecol 19: 47–56.
30. Pace ML, Cole JJ (2002) Synchronous variation of dissolved organic carbon and color in lakes. Limnol Oceanogr 47: 333–342.
31. Carignan R, Planas D, Vis C (2000) Planktonic production and respiration in oligotrophic shield lakes. Limnol Oceanogr 45: 189–199.
32. Cottrell MT, Mannino A, DL, Kirchman DL (2006) Aerobic anoxygenic phototrophic bacteria in the Mid-Atlantic Bight and the North Pacific Gyre. Appl Environ 72: 557–564. PMID:16391092
33. Sieracki M, Gilg I, Thier E, Poulton NJ, Goericke R (2006) Distribution of planktonic aerobic anoxygenic photoheterotrophic bacteria in the northwest Atlantic. Limnol Oceanogr 51: 38–46.
34. Borrego CM, Garcia-Gil LJ (1994) Separation of bacteriochlorophyll homologues from green photosyn-thetic sulfur bacteria by reversed-phase HPLC. Photosynth Res 41: 157–164. doi:10.1007/
BF02184156PMID:24310022
35. Goericke R (2002) Bacteriochlorophyll a in the ocean: Is anoxygenic bacterial photosynthesis impor-tant? Limnol Oceanogr 47: 290–295.
36. Koblížek M, Mašín M, Ras J, Poulton AJ, Prásil O (2007) Rapid growth rates of aerobic anoxygenic phototrophs in the ocean. Environ Microbiol 9: 2401–2406. PMID:17803766
37. Grimm B, Porra R, Rüdiger W, Scheer H (2006) Chlorophylls and bacteriochlorophylls: biochemistry, biophysics, functions and applications. Netherlands: Springer. 459 p.
38. Idso S (1973) On the concept of lake stability. Limnol Oceanogr 18: 681–683.
39. Liu R, Zhang Y, Jiao N (2010) Diel variations in frequency of dividing cells and abundance of aerobic anoxygenic phototrophic bacteria in a coral reef system of the South China Sea. Aquat Microb Ecol 58: 303–310.
40. Celussi M, Gallina AA, Ras J, Giani M, Negro P Del (2015) Effect of sunlight on prokaryotic organic Car-bon uptake and dynamics of photoheterotrophy relevant pigments in the Adriatic Sea. Aquat Microb Ecol. doi:10.3354/ame01738
41. Cottrell MT, Kirchman DL (2009) Photoheterotrophic microbes in the Arctic Ocean in summer and win-ter. Appl Environ Microbiol 75: 4958–4966. doi:10.1128/AEM.00117-09PMID:19502441
42. Kirchman DL, Hanson TE (2012) Bioenergetics of photoheterotrophic bacteria in the oceans. Environ Microbiol Rep 5: 188–199. doi:10.1111/j.1758-2229.2012.00367.xPMID:23584962
43. Ruiz-González C, Simó R, Sommaruga R, Gasol JM (2013) Away from darkness: a review on the ef-fects of solar radiation on heterotrophic bacterioplankton activity. Front Microbiol 4: 131. doi:10.3389/ fmicb.2013.00131PMID:23734148
44. Guillemette F, McCallister SL, del Giorgio PA (2013) Differentiating the degradation dynamics of algal and terrestrial carbon within complex natural dissolved organic carbon in temperate lakes. J Geophys Res Biogeosciences 118: 963–973.
45. Farjalla VF, Amado AM, Suhett AL, Meirelles-Pereira F (2009) DOC removal paradigms in highly humic aquatic ecosystems. Environ Sci Pollut Res Int 16: 531–538. doi:10.1007/s11356-009-0165-xPMID:
19462194
46. Salka I, Cuperová Z, Mašín M, Koblížek M, Grossart H-P (2011) Rhodoferax-related pufM gene cluster
dominates the aerobic anoxygenic phototrophic communities in German freshwater lakes. Environ Microbiol 13: 2865–2875. doi:10.1111/j.1462-2920.2011.02562.xPMID:21895915
47. Hutalle-Schmelzer KML, Zwirnmann E, Krüger A, Grossart H-P (2010) Enrichment and cultivation of pelagic bacteria from a humic lake using phenol and humic matter additions. FEMS Microbiol Ecol 72: 58–73. doi:10.1111/j.1574-6941.2009.00831.xPMID:20459514
48. Salka I, Srivastava A, Allgaier M, Grossart H (2014) The draft genome sequence ofSphingomonassp. strain FukuSWIS1, obtained from Acidic Lake Grosse Fuchskuhle, indicates photoheterotrophy and a potential for humic matter degradation. Genome Announc 2: 1–2.
49. Gonzalez JM, Sherr EB, Sherr BF (1990) Size-selective grazing on bacteria by natural assemblages of estuarine flagellates and ciliates. Appl Environ Microbiol 56: 583–589. PMID:2107794
51. Yurkova N, Rathgeber C, Swiderski J, Stackebrandt E, Beatty JT, et al. (2002) Diversity, distribution and physiology of the aerobic phototrophic bacteria in the mixolimnion of a meromictic lake. FEMS Microbiol Ecol 40: 191–204. doi:10.1111/j.1574-6941.2002.tb00952.xPMID:19709227
52. Yutin N, Suzuki MT, Teeling H, Weber M, Venter JC, et al. (2007) Assessing diversity and biogeogra-phy of aerobic anoxygenic phototrophic bacteria in surface waters of the Atlantic and Pacific Oceans using the Global Ocean Sampling expedition metagenomes. Environ Microbiol 9: 1464–1475. PMID:
17504484
53. Waidner LA, Kirchman DL (2008) Diversity and distribution of ecotypes of the aerobic anoxygenic phototrophy gene pufM in the Delaware estuary. Appl Environ Microbiol 74: 4012–4021. doi:10.1128/