ISSN 0104-6632 Printed in Brazil
www.abeq.org.br/bjche
Vol. 26, No. 04, pp. 685 - 694, October - December, 2009
Brazilian Journal
of Chemical
Engineering
PREDICTION OF MASS TRANSFER
COEFFICIENTS IN A PULSED PACKED
EXTRACTION COLUMN USING EFFECTIVE
DIFFUSIVITY
M. Torab-Mostaedi
*and J. Safdari
Nuclear Fuel Cycle Research School, Nuclear Science and Technology Research Institute, Phone: (+9821) 88221128, Fax: (+9821)82064355, End of North Karegar Av.,
P.O. Box: 11365-8486, Tehran, Iran. E-mail: [email protected]
(Submitted: April 7, 2009 ; Revised: June 6, 2009 ; Accepted: July 27, 2009)
Abstract - The volumetric overall mass transfer coefficients have been measured in a pulsed packed
extraction column using diffusion model for two different liquid-liquid systems. The effects of operational variables such as pulsation intensity and dispersed and continuous phase flow rates on volumetric overall mass transfer coefficients have been investigated. Effective diffusivity is substituted for molecular diffusivity in the Gröber equation for prediction of dispersed phase overall mass transfer coefficients. The enhancement factor is determined experimentally and therefrom an empirical correlation is derived for prediction of effective diffusivity as a function of Reynolds number, Schmidt number and viscosity ratio. Good agreement between prediction and experiments was found for all operating conditions that were investigated.
Keywords: Pulsed packed column; Mass transfer coefficient; Axial diffusion model; Enhancement factor; Effective diffusivity.
INTRODUCTION
Liquid-liquid extraction processes are widely used in different industries, especially in rare earth separation and hydrometallurgical processes. The knowledge concerning the design and performance of extraction columns, however, is still far from satisfactory. The cause lies mainly in the complex behaviors of the hydrodynamics and mass transfer performance (Luo et al., 1998). The efficiency of liquid-liquid contactors is primarily dependent on the degree of turbulence imparted to the system and the interfacial area available for mass transfer. The rate of mass transfer can be enhanced by pulsating motion imparted to the liquids by an external mechanical or electronic device. Chantry et al. (1955) have shown that the height of a packed
column required to effect a given degree of extraction is reduced by a factor of three, under pulsation. Internal mechanical parts are eliminated, leakage is minimized, and the pulsator can be isolated (Hussain et al., 1988). The pulsed columns have a clear advantage over other mechanical contactors when processing corrosive or radioactive solutions since the pulsing unit can be remote from the column. The absence of moving mechanical parts in such columns obviates repair and servicing. These advantages have led to the application of these columns in chemical, biochemical and petroleum industries, besides nuclear fuel reprocessing.
columns is to determine the column height in the case of differential extractors such as pulsed packed columns. Therefore, the design of an extraction column for a given separation warrants the availability of reliable correlations for the prediction of overall mass transfer coefficients. The prediction of mass transfer coefficients for drops in a liquid-liquid extraction column is subject to considerable uncertainty. In a usual extraction column, the diameter of dispersed drops and the dispersed phase holdup depend on vertical position of the column and accurate estimation of these variables is difficult. This makes it difficult to determine the mass transfer coefficients in an extraction column. Moreover, very little is known about the effect of agitation, superimposed on the flow of the two phases in an extraction column, on the enhancement of mass transfer coefficients (Torab-Mostaedi et al., 2008; Sarker et al., 1985; Nii et al., 1997; Kirou et al., 1988). Mass transfer coefficients in extraction columns are generally obtained from the measured concentration profiles (or end concentrations) and values of operating variables by using an appropriate simulation model. In early design procedures, ideal plug flow conditions were assumed in both phases to estimate the height or number of stages required for the desired separation. However, it is now widely accepted that axial mixing generated by agitation intensity reduces the efficiency of the column by decreasing the mass transfer driving force. The effect of axial mixing is seen as concentration ‘jumps’ at either end of the extractor. These jumps move the equilibrium and operating lines closer together, thus reducing the concentration driving force and increasing the stage requirements in the extractor. Some reports have shown that 60 to 75% of the extractor height is used to compensate such decrement of mass transfer efficiency (Wang et al., 2002). On this basis, the state of the art for the design of extraction columns is to use the diffusion or backflow model, where one parameter accounts for all deviations from ideal plug flow behavior (Bart et al., 2008).
Although pulsed columns use sieve plates, packing, and discs and doughnuts, most investigations reported have dealt with the sieve plate type (Yadav and Patwardlan, 2008; Jahya et al., 2005; Jie and Weiyang, 2000) and there is little experimental data available for mass transfer coefficients in pulsed packed extraction columns (Pratt and Stevens, 1992b). On this basis, for the purpose of establishing proper design procedures for pulsed packed extraction columns, there is a need for sound equations which predict the overall mass transfer coefficients.
The present study has examined the influence of operating variables, including the pulsation intensity as well as dispersed and continuous phases flow rates, on volumetric overall mass transfer coefficients. More importantly, an empirical correlation to predict the enhancement factor in the Gröber equation has been developed based on the experimental data. The present results have been designed to aid the reliability in determining the optimal column height for pulsed packed extraction columns.
PREVIOUS WORK
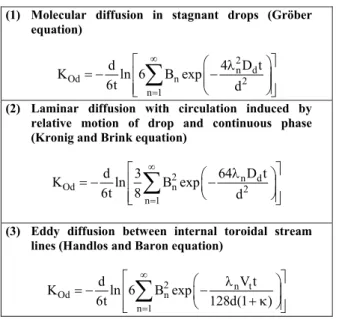
The overall mass transfer coefficient of dispersed or continuous phase is one of the essential parameters in extraction column design. Several correlations have been proposed for the mass transfer coefficient of a single drop in motion in a continuous phase. These models usually have been based on either a stagnant (Gröber, 1925), circulating (Kronig and Brink, 1950), or oscillating (Handlos and Baron, 1957) drop falling or rising in the continuous phase with mass transfer occurring into or out of drops. The theoretical models for dispersed phase mass transfer coefficients are listed in Table 1.
Table 1: Three proposed mechanisms of dispersed phase mass transfer coefficient
(1) Molecular diffusion in stagnant drops (Gröber equation)
2 n d
Od n 2
n 1
d 4 D t
K ln 6 B exp
6t d
∞
=
⎡ ⎛ λ ⎞⎤
= − ⎢ ⎜⎜− ⎟⎟⎥
⎢ ⎝ ⎠⎥
⎣
∑
⎦(2) Laminar diffusion with circulation induced by relative motion of drop and continuous phase (Kronig and Brink equation)
2 n d
Od n 2
n 1
d 3 64 D t
K ln B exp
6t 8 d
∞
=
⎡ ⎛ λ ⎞⎤
= − ⎢ ⎜⎝− ⎟⎠⎥
⎢ ⎥
⎣
∑
⎦(3) Eddy diffusion between internal toroidal stream lines (Handlos and Baron equation)
2 n t
Od n
n 1
d V t
K ln 6 B exp
6t 128d(1 )
∞
=
⎡ ⎛ λ ⎞⎤
= − ⎢ ⎜− ⎟⎥
+ κ
⎝ ⎠
⎢ ⎥
⎣
∑
⎦agitation. Axial mixing also leads to a reduction in mass transfer performance due to its effect of reducing the concentration driving force for mass transfer. Other factors such as throughput, contact area and column geometry also affect mass transfer coefficients in extraction columns.
An alternative approach uses enhanced molecular diffusivity,RD (also referred to as effective d diffusivity) in the equation for diffusion in rigid spheres. Effective diffusivity contains the effect of all known and unknown parameters that play an important role in calculating the exact value of the mass transfer coefficient. The idea was proposed by Calderbank and Korchinski (1956). Treybal (1963) has pointed out that comparison of the Kronig and Brink model with the case for rigid spheres shows that one might consider such a drop as a rigid sphere for which effective diffusivity equals 2.25-2.7 times the true molecular diffusivity. Equation (1) was then modified to define R:
2 n d
Od n 2
n 1
d 4 RD t
K ln 6 B exp
6t d
∞
=
⎡ ⎛ λ ⎞⎤
= − ⎢ ⎜⎜− ⎟⎟⎥
⎢ ⎝ ⎠⎥
⎣
∑
⎦(4)
Many investigators proposed different correlations for prediction of the enhancement factor. Johnson and Hamielec (1960) considered only the first term of the series in equation (4) and determined R values. Calculated results were compared with equation (5).
t d dV R
2048D (1 )
=
+ κ (5)
This is based on Handlos and Baron’s effective diffusivity, but the results were disappointing.
Steiner (1986) used equation (4) reduced to its first term of the summation series and evaluated R values on the basis of data from nine sources. A correlating equation was proposed.
Steiner (1986) has also correlated the drop mass transfer coefficient data for a spray column in terms of the enhancement factor R in the form:
0.12 1.42 2
5 32 0.67 d
2Re g d
R 5.56 10 Sc (1 )
1
− ⎛ ⎞ ⎛ Δρ ⎞
= × ⎜⎝ +κ⎟ ⎜⎜ σ ⎟⎟ × −ϕ
⎠ ⎝ ⎠ (6)
This is then used in equation (4) to calculate Kod.
Temos et al. (1993) presented the relation between eddy diffusivity and molecular diffusivity in a simple way, as shown in equations (7) and (8).
E d 0.44D
R 1
D
= + (7)
where
4 d i E
d
-4 d i d d d V d
D 3.29 10
V d 1 exp -3.29 10
− ⎛ρ ⎞
= × ⎜ ⎟×
μ
⎝ ⎠
⎧ ⎡ ⎛ρ ⎞ ⎛⎤⎫ μ ⎞
⎪ − × ⎪
⎨ ⎢ ⎜ μ ⎟ ⎜⎥⎬ ρ ⎟
⎝ ⎠ ⎝ ⎠
⎪ ⎣ ⎦⎪
⎩ ⎭
(8)
i
V for Re>>1is given by Eq. (9).
i 0.5 0.5 t
d d c c
2 3 1.45
V 1 V
1 ( / ) Re
⎧ ⎡ + κ ⎤ ⎫
⎪ ⎪
=⎨ −⎢ ⎥ ⎬
+ μ ρ μ ρ
⎪ ⎣ ⎦ ⎪
⎩ ⎭ (9)
Bahmanyar et al. (2008) proposed the following correlation for prediction of effective diffusivity in pulsed sieve plate extraction columns:
9 eff .
D =4.5151 10 exp(0.0067 Re )× − (10)
They also found that slip velocity is the most suitable velocity for calculating the Reynolds number.
Seyed Ebrahimi et al. (2009) recommended equation (11) for predicting the enhancement factor in pulsed sieve plate extraction columns:
d c
(1 V /V ) 5
d d
R=1.27 10× − Re + −0.027 Re (11)
Torab-Mostaedi et al. (2009) presented the following correlation for prediction of enhancement factor in a Hanson mixer-settler extraction column:
0.257 1.42
R=0.51 213.35Re+ − (1− ϕ)Eo (12)
EXPERIMENTAL
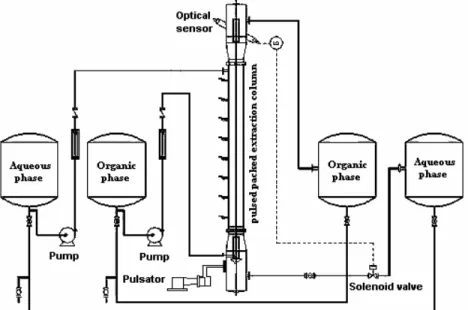
There were eight samplers arranged along the wall of column. The inlets and outlets of the column were connected to four tanks, each of 50 liters capacity. The flow rates of the two phases were indicated by two rotameters. The interface location of two phases at the top of the column was automatically controlled by an optical sensor. A solenoid valve (a normally closed type) was provided at the outlet stream of the heavy phase. This valve received electronic signals from the optical sensor. When the interface location was going to change, the optical sensor sent a signal to the solenoid valve and the aqueous phase was allowed to leave the column by opening the diaphragm of the solenoid valve. The organic phase was allowed to leave the column via an overflow.
The liquid systems studied were toluene-acetone-water (high interfacial tension) and n-butyl acetate- acetone- water (medium interfacial tension). These systems have been recommended by the European Federation of Chemical Engineering (E.F.C.E.) as
official test systems for extraction investigations (Míšek et al. 1985). In all experiments dilute solutions have been investigated with approximately 3.5% wt acetone in aqueous phase. Distilled water was used as the continuous phase and technical grades of toluene and n-butyl acetate of at least 99.5wt% purity were used as the dispersed phase. The physical properties of the liquid–liquid systems used in these experiments are listed in Table 2. It should be noted that, under mass transfer conditions, a degree of uncertainty surrounds the estimation of physical properties (particularly interfacial tension), since these vary not only with the inlet solute concentrations, but also along the column. In the present work, the values of physical properties have been assumed to correspond to the mean values of acetone concentration in the continuous and dispersed phases. The mean value of acetone concentration was obtained by averaging the values obtained at the inlet and outlet of the column. Liquid-liquid equilibrium data of the liquid systems were taken from Míšek et al. (1985).
Figure 1: Schematic diagram of the pulsed packed extraction column
Table 2: Physical properties of liquid systems at 20oC
Physical property Toluene-acetone-water n-Butyl acetate-acetone-water
3
c(kg / m )
ρ 994.4-995.7 994.3-995.8
3
d(kg / m )
ρ 864.4-865.2 879.6-881.4
c(mPa.s)
μ 1.059-1.075 1.075-1.088
d(mPa.s)
μ 0.574-0.584 0.723-0.738
(mN / m)
σ 27.5-30.1 12.4-13.2
2 c
D (m / s) 1.09-1.14×10⁻⁹ 1.01-1.06×10⁻⁹
2 d
Before carrying out the experiments, both phases were mutually saturated, after which solute was added to the continuous phase to give a concentration of about 3.5wt% acetone. Samples of each phase were taken at their inlets to the column and used for the determination of the initial solute concentration.
The amplitude and frequency of pulsation were next adjusted to the desired values and, after filling the column with the continuous phase, the dispersed phase was introduced. The interface position was then maintained at the desired height, and the system was allowed to reach steady state, which necessitated 3-4 changes of column volume. Inlet and outlet samples were taken for both the aqueous and organic phases once steady state conditions had been reached. The acetone content of the samples was measured using a gas chromatograph (MXT®-1) with flame ionization detector, calibrated with reference substances of toluene, n-butyl acetate and water for gas chromatography. A photographic technique was used to measure the drop diameter, since it proved to be more accurate and reliable than other techniques. When the conditions became steady, photographs were taken at different positions along the column. The average drop sizes were determined by taking photographs with a Sony DSC-F828 digital camera. At least 150 drops were analyzed for each determination. Holdup measurements were obtained using the shut down method. In order to use this method, at the end of each experiment the inlet and outlet valves were shut simultaneously and the dispersed phase was allowed to coalesce to the interface at the top of the column. A period of 10-15 min was allowed for the dispersed phase to settle. Holdup was then obtained by collecting and measuring the volume of the dispersed phase in a measuring cylinder, via a drainage valve, until the interface was as its initial position. All the experiments were carried out far from flooding conditions.
MODELING
The backflow and the diffusion models are the most important practical approaches for considering the influence of the axial mixing on the mass transfer performance of an extraction column. In the diffusion model, applicable to differential- type extractors, non-ideality is expressed in terms of an axial dispersion coefficient, E. In contrast, the backflow model is basically a stage-wise model, in which total mixing is assumed within each stage, and
the deviation from plug flow is presented by a back-mixing coefficient, α, between adjacent stages. Based upon the axial diffusion model and mass balance in the column over the differential elements of the column with a cross sectional and total effective height H, the equation set for steady state process was established as follows, under the constant superficial velocities Vx and Vy at any
given pulse amplitude and frequency:
* Ox x
1 x
x N (x x ) 0
Z Pe Z
⎛ ⎞
∂ − ∂ + − =
⎜ ⎟
∂ ⎝ ∂ ⎠ (13)
* x Ox
y y
1 y V
y N (x x ) 0
Z Pe Z V
⎛ ⎞
∂ + ∂ − − =
⎜ ⎟
⎜ ⎟
∂ ⎝ ∂ ⎠ (14)
where
x x x
Pe =HV / E , Pey=HV / Ey y, Z=h / H,
Ox Ox
x
K aH
N
V
=
The overall mass transfer coefficient was determined from the measured dispersed and continuous phase exit concentrations, together with the equilibrium data. The continuous phase axial dispersion was predicted from the models of Spaay et al. (1971). The dispersed phase axial dispersion was assumed to be negligible, i.e., 1/Pey=0. On this
basis, by using an effective back-mixing diffusion coefficient, hydrodynamic data (including holdup and Sauter mean drop size), and appropriate boundary conditions (Pratt and Stevens, 1992a), experimental continuous phase overall mass transfer coefficients are calculated from equations (13) and (14) by using MATLAB software. The dispersed phase overall mass transfer coefficients are then calculated by using the following equation:
Od Oc
1 1
mK =K (15)
RESULTS AND DISCUSSION
number of drops in the column increases due to a decrease of relative velocity between the dispersed phase and continuous phase and consequently the values of holdup will also increase. So it can be concluded that the value of interfacial area (and consequently volumetric overall mass transfer coefficient) increases with both effects. Experimental data from both systems (especially n-butyl acetate-acetone-water) shows that at high pulsation intensity, increased entrainment and poor extraction efficiency is observed, with the production of fine dispersed droplets.
The effect of pulsation intensity on the volumetric overall mass transfer coefficient of the toluene-acetone-water system (high interfacial tension) is
larger than that of butyl acetate-acetone-water (medium interfacial tension), because breakup of the dispersed phase drops into smaller ones is limited for the latter system due to its lower interfacial tension.
Figure 3 shows the effect of dispersed phase flow rate on volumetric overall mass transfer coefficients. As shown in this figure, the volumetric overall mass transfer coefficient increases with an increase in dispersed phase flow rates for both systems. The holdup and drop size increase with an increase in dispersed phase flow rate, but it is observed that the effect of holdup on interfacial area is larger than that of drop size, i.e., interfacial area increases upon increasing dispersed phase flow rate and consequently the mass transfer rate will increase.
0 1 2 3 4 5 6
0 0.8 1.6 2.4 3.2 4
Af [cm /s]
KOd
a [
m
s
-1]
Toluene/Acetone/Water n-Butyl acetate/Acetone/Water
Figure 2: Effect of pulsation intensity on the volumetric overall mass transfer coefficient at constant flow rates (Vd =0.57 mm/s, Vc =0.456 mm/s)
0 1 2 3 4 5 6 7 8
0 0.8 1.6 2.4 3.2
Af [cm /s]
KOd
a [
m
s
-1]
Toluene/Acetone/Water, Vd=0.57 m m /s Toluene/Acetone/Water, Vd=0.855 m m /s n-Butyl acetate/Acetone/Water, Vd=0.57 m m /s n-Butyl acetate/Acetone/Water, Vd=0.855 m m /s
0 1 2 3 4 5 6 7 8
0 0.8 1.6 2.4 3.2
Af [cm /s]
KOd
a [
m
s
-1]
Toluene/Acetone/Water, Vc=0.456 m m /s Toluene/Acetone/Water, Vc=0.8 m m /s n-Butyl acetate/Acetone/Water, Vc=0.456 m m /s n-Butyl acetate/Acetone/Water, Vc=0.8 m m /s
Figure 3: Effect of dispersed phase flow rate on volumetric overall mass transfer coefficient at constant Vc
The effect of continuous phase flow rate on volumetric overall mass transfer coefficients is given in Fig. 4. According to this figure, the volumetric overall mass transfer coefficient varies little with continuous phase flow rate. By increasing the continuous phase flow rate, the drag force between the drops and the continuous phase increases and consequently the slip velocity between the phases will decrease. So the dispersed phase holdup increases with an increase in continuous phase flow rate. Moreover, the experiments showed that mean drop size increases with an increase in the flow rate of the continuous phase. As to the effects of continuous phase flow rate on the volumetric overall mass transfer coefficient, the contribution of holdup is positive and that of mean drop size is negative because the interfacial area is proportional to the holdup and inversely proportional to the drop size. The results showed that the former can be compensated by the latter and the volumetric coefficient is not affected by the continuous phase flow rate for both systems.
It was accepted that internal motion in a drop increases regularly as drop size increases, and consequently the mass transfer coefficient will increase. It is well-known that drop size decreases with decreasing interfacial tension. Smaller drops are generated from the medium interfacial tension
system (n-butyl acetate-acetone-water) than are produced from the higher interfacial tension system (toluene-acetone-water) and, consequently, internal circulation in drops of the former system is lower than that of the latter system. The reduction of internal circulation and turbulence in drops lead to decrease mass transfer coefficients. Although mass transfer coefficients generally increase with increasing drop diameter, the presence of large drops tends to decrease mass transfer rates, since they reduce the available interfacial area for mass transfer. As can be seen in Figs. 2-4, at low pulsation intensity, the values of the volumetric overall mass transfer coefficient of the toluene-acetone-water system are lower than those of n-butyl acetate-acetone-water because of their low interfacial area. At higher pulsation intensity, the volumetric coefficients of the former system are higher than those of the latter system, because the interfacial area increases with increasing pulsation intensity.
The experimental results for the dispersed phase overall mass transfer coefficient are compared with theoretical models and the models derived for pulsed sieve plate extraction columns. The values of the average relative deviation (ARD) of the predicted values of the dispersed phase overall mass obtained by applying equations (1), (2), (3), (5), (6), and (10) to the experimental results are listed in Table 3.
Table 3: The values of ARD in the predicted values of overall mass transfer coefficient obtained by applying equation (1), (2), (3), (5), (6), and (10) to the experimental data
Liquid-liquid system Equ. (1) Equ. (2) Equ. (3) Equ. (5) Equ. (6) Equ. (10)
Toluene/Acetone/Water 76.86% 58.06% 198.09% 52.38% 92.65% 81.28%
n-Butyl acetate/Acetone/Water 55.76% 42.91% 387.29% 69.76% 72.33% 49.88%
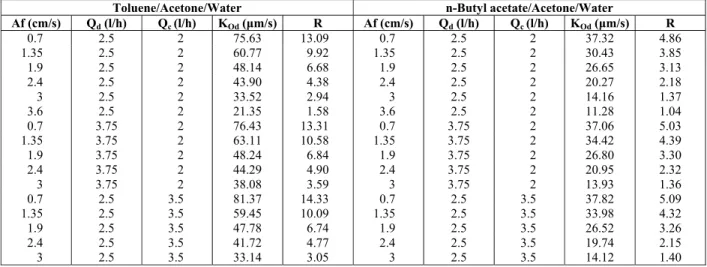
Table 4: Experimental values of dispersed phase overall mass transfer coefficient and enhancement factor
Toluene/Acetone/Water n-Butyl acetate/Acetone/Water
Af (cm/s) Qd (l/h) Qc (l/h) KOd (μm/s) R Af (cm/s) Qd (l/h) Qc (l/h) KOd (μm/s) R
0.7 2.5 2 75.63 13.09 0.7 2.5 2 37.32 4.86
1.35 2.5 2 60.77 9.92 1.35 2.5 2 30.43 3.85
1.9 2.5 2 48.14 6.68 1.9 2.5 2 26.65 3.13
2.4 2.5 2 43.90 4.38 2.4 2.5 2 20.27 2.18
3 2.5 2 33.52 2.94 3 2.5 2 14.16 1.37
3.6 2.5 2 21.35 1.58 3.6 2.5 2 11.28 1.04
0.7 3.75 2 76.43 13.31 0.7 3.75 2 37.06 5.03
1.35 3.75 2 63.11 10.58 1.35 3.75 2 34.42 4.39
1.9 3.75 2 48.24 6.84 1.9 3.75 2 26.80 3.30
2.4 3.75 2 44.29 4.90 2.4 3.75 2 20.95 2.32
3 3.75 2 38.08 3.59 3 3.75 2 13.93 1.36
0.7 2.5 3.5 81.37 14.33 0.7 2.5 3.5 37.82 5.09
1.35 2.5 3.5 59.45 10.09 1.35 2.5 3.5 33.98 4.32
1.9 2.5 3.5 47.78 6.74 1.9 2.5 3.5 26.52 3.26
2.4 2.5 3.5 41.72 4.77 2.4 2.5 3.5 19.74 2.15
As can be seen in this table, the previous models do not have enough accuracy for design of pulsed packed columns. Therefore, experimental values of dispersed phase overall mass transfer coefficients were used in equation (4) to define the effective diffusivity (RDd). This equation has been reduced to
its first term in determining the R values. The experimental values of the enhancement factor are given in Table (4). As can be seen in this table, the enhancement factor is greater than unity because of internal circulation of drops. The mechanisms of mass transfer change from molecular diffusion for very fine drops to eddy diffusion or a combination of molecular diffusion and eddy diffusion with laminar circulation inside moderate or large drops. This table shows that the enhancement factor is strongly affected by pulsation intensity as well as interfacial tension, while it varies little with phase flow rates. As can be seen in this table, the overall mass transfer coefficient decreases with an increase in pulsation intensity because of reduction of the internal circulation and turbulence in drops. This table also shows that the enhancement factor decreases with a decrease in interfacial tension, because the drop size is smaller for the system of the lower interfacial tension and the behavior of drops becomes closer to the rigid spheres model.
After calculating the experimental values of the enhancement factor for selected operating conditions, the following equation is derived in terms of Reynolds number, Schmidt number, and viscosity ratio by using the least squares method.
(
)
0.50 0.94 0.80 c
R 2.57 1326.07 Re Sc (1 )
7.70 Re 106
− −
= − + + κ
< < (16)
where:
32 slip c c d V
Re= ρ
μ (17)
in which d32 is the Sauter mean diameter and Vslip is
the slip (or relative) velocity between two phases through the column. Since the dispersed and continuous phases flow counter-currently through the column, the slip velocity, Vslip between the phases
is obtained as follows:
d c slip
Q Q
V
eA eA(1 )
= +
ϕ − ϕ (18)
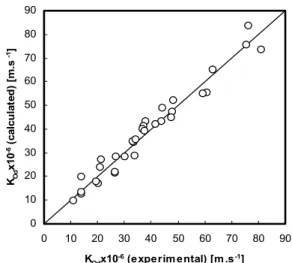
The calculated values of the enhancement factor are then used in equation (4) to calculate the dispersed phase overall mass transfer coefficients. The comparison of experimental data with those
calculated by the present model is shown in figure 5. This figure shows that the experimental results are in very good agreement with calculated values obtained by applying equations (4) and (17). The presented equation reproduces experimental results with an average relative deviation of 9.97%.
0 10 20 30 40 50 60 70 80 90
0 10 20 30 40 50 60 70 80 90
KOdx10
-6 (experim ental) [m .s-1]
KOd
x1
0
-6 (
c
a
lc
u
la
te
d
) [
m.s
-1]
Figure 5: Comparison of experimental data with calculated values
CONCLUSIONS
This study has examined the mass transfer performance of a pulsed packed column using two liquid systems. The experiments showed that the continuous phase flow rate had little influence on the value of KOda, and, conversely, KOda was significantly
influenced by the dispersed phase flow rate. The interfacial area, determined as a function of dispersed phase holdup and Sauter mean drop diameter, showed that the effects of phase flow rates are less pronounced than those of pulsation intensity and interfacial tension. A precise correlation was proposed for prediction of the enhancement factor in terms of Reynolds number, Schmidt number and viscosity ratio. This equation is recommended for calculation of dispersed phase overall mass transfer coefficients and, consequently, for final sizing of the column height.
NOMENCLATURE
a interfacial area m2/m3
A cross-sectional area of the
column [m2], pulse amplitude
m
Bn nth coefficient in equations
(1-4)
(-)
D molecular diffusivity m2/s
Deff effective diffusivity m2/s
DE eddy diffusivity m2/s
Eö Eötvös number 2
32
(gd Δρ σ/ ) (-)
e packing porosity (-)
E axial mixing coefficient m2/s
f frequency s-1
g acceleration due to gravity m/s2
H effective height of the
column
m
K overall mass transfer
coefficient
m/s
m distribution ratio (-)
NOx Number of 'true' transfer
unit
(-)
Pe Peclet number (-)
Q flow rate of the continuous
or dispersed phase
(m3/s)
R enhancement factor for mass
transfer
(-)
Re Reynolds number (-)
Scc Schmidt number (-)
t time s
V superficial velocity (-)
Vslip slip velocity m/s
Vt terminal velocity of droplet m/s
x mass fraction of acetone in
continuous phase
(-)
x* equilibrium mass fraction of
acetone in continuous phase corresponding to dispersed phase
(-)
y mass fraction of acetone in
dispersed phase
(-)
Greek Letters
α backflow coefficient (-)
n
λ nth coefficient in equations (1-4)
(-)
ρ density kg/m3
Δρ density difference between
phases
kg/m3
κ viscosity ratio(μ μd/ c) (-)
μ viscosity Pa.s
σ interfacial tension N/m
ϕ holdup of dispersed phase (-)
Subscripts
c continuous phase
d dispersed phase
O overall value
x x-phase (continuous phase in
present case)
y y-phase (dispersed phase in
present case)
Superscripts
* equilibrium value
REFERENCES
Bahmanyar, H., Nazari, L. and Sadr, A., Prediction of Effective Diffusivity and Using of it in Designing Pulsed Sieve Extraction Columns, Chem. Eng. Process. 47, 57-65 (2008).
Bart, H. -J., Drumm, C. and Attarakih, M. M., Process Intensification with Reactive Extraction Columns, Chem. Eng. Process. 47, 745-754 (2008).
Calderbank, P. H. and Korchinsky, I. J. O., Circulation in Liquid Drops: A Heat Transfer Study, Chem. Eng. Sci. 6, 65-78 (1965).
Chantry, W. A., Von Berg, R. L. and Wiegandt, H. F., Application of Pulsation to Liquid-Liquid Extraction, Ind. Eng. Chem. 47, 1153-1159 (1955). Gröber, H., Die Erwärmung and Abkühlung
einfacher Geometrischer Körper, Z Var Dtsch Ing. 69, 705-711 (1925).
Handlos, A. E. and Baron, T., Mass and Heat Transfer from Drops in Liquid-Liquid Extraction, AIChE J. 3, 127-136 (1957).
Hussain, A. A., Liang, T-B. and Slater, M. J., Characteristic Velocity of Drops in a Liquid-Liquid Extraction Pulsed Sieve Plate Column, Chem. Eng. Res. Des. 66, 541-554 (1988).
Jahya, A. B., Pratt, H. R. C. and Stevens, G. W., Comparison of the Performance of a Pulsed Disc and Doughnut Column with a Pulsed Sieve Plate Extraction Column, Solvent Extr. Ion. Exc. 23, 307-317 (2005).
Jie, Y. and Weiyang, F., Hydrodynamics and Mass Transfer in a Pulsed Packed Column, Can. J. Chem. Eng. 78, 1040-1045 (2000).
Johnson, A. I. and A. E. Hamielec, Mass Transfer inside Drops, AIChE J. 6, 145-149 (1960).
Kirou, V. J., Tavlarides, L. L., Bonnet, J. C. and Tsouris, C., Flooding, Holdup and Drop Size Measurements in a Multistage Column Extractor, AIChE J. 34, 283-292 (1988).
Míšek, T., Berger, R. and Schröter, J., Standard Test Systems for Liquid Extraction Studies, EFCE Publ. Ser., 46 (1985).
Nii, S., Suzuki, J., Tani, K. and Takahashi, K., Mass Transfer Coefficients in Mixer-Settler Extraction Column, J. Chem. Eng. Japan, 30, 1083-1089 (1997).
Pratt, H. R. C. and Stevens, G. W., Axial Dispersion, in Thornton, J.D. (Ed.), Science and Practice in Liquid-Liquid Extraction, Oxford University Press, pp. 461-492 (1992a).
Pratt, H. R. C. and Stevens, G. W., Selection, Design, Pilot-testing and Scale-up of Extraction Equipment, in Thornton, J. D. (Ed.), Science and Practice in Liquid-Liquid Extraction, Oxford University Press, pp. 493-589 (1992b).
Sarker, S. and Phillips, C. R., Characterization of Hydrodynamic Parameters in Rotating Disc and Oldshue-Rushton Columns, Hydrodynamic Modeling, Drop Size, Holdup and Flooding, Can. J. Chem. Eng. 63, 701-709 (1985).
Seyed Ebrahimi, S. S., Bahmanyar, H. and Safdari, J., A New Enhancement Factor for Mass Transfer Coefficients and Designing Pulsed Sieve-Plate Columns, J. Chem. Eng. Japan 42, 10-20 (2009). Steiner, L., Mass Transfer Rates from Single Drops
and Drop Swarms, Chem. Eng. Sci, 41, 1979-1986 (1979-1986).
Spaay, N. M., Simons, A. J. F. and Ten Brink, G. P.,
Design and Operation of a Pulsed Packed Column for Liquid-Liquid Extraction, in Proc. Internal. Solvent Extraction Conf., ISEC '71, B. Evans and P. C. Weston, Eds., Hague, August 19-23, 1971, Society of Chemical Industry, London, UK pp. 281-298 (1971).
Temos, J., Pratt, H. R. C. and Stevens, G. W., Comparison of Tracer and Bulk Mass Transfer Coefficients for Droplets, In Proceedings of International Solvent Extraction Conference Elsevier, Amsterdam, 93, 1770-1777 (1993). Torab-Mostaedi, M., Safdari, J., Moosavian, M. A.
and Ghannadi Maragheh, M., Prediction of Overall Mass Transfer Coefficients in a Hanson Mixer-Settler Using Effective Diffusivity, J. Chem. Eng. Japan 42, 78-85 (2009).
Torab-Mostaedi, M., Safdari, J., Moosavian, M. A. and Ghannadi Maragheh, M., Mass Transfer Coefficients in a Hanson Mixer-Settler Extraction Column, Braz. J. Chem. Eng. 25, 473-481 (2008). Treybal, R. E., Liquid Extraction, 2nd edn, p. 186,
McGraw Hill, New York, (1963).
Yadav, R. L. and Patwardlan, A. W., Design Aspects of Pulsed Sieve Plate Columns, Chem. Eng. J. 138, 389-415 (2008)