Article
Lack of Associations between Body Mass Index and
Clinical Outcomes in Patients with Papillary Thyroid
Carcinoma
Hyemi Kwon¹, Mijin Kim¹, Yun Mi Choi¹, Eun Kyung Jang¹, Min Ji Jeon¹, Won Gu Kim¹, Tae Yong Kim¹, Young Kee Shong¹, Dong Eun Song², Jung Hwan Baek3, Suck Joon Hong4, Won Bae Kim¹
Departments of 1
Internal Medicine, ²Pathology, 3
Radiology, and 4
Surgery, Asan Medical Center, University of Ulsan College of Medicine, Seoul, Korea
Background: Obesity is associated with aggressive pathological features and poor clinical outcomes in breast and prostate can-cers. In papillary thyroid carcinoma (PTC), these relationships remain still controversial. This study aimed to evaluate the associ-ations between body mass index (BMI) and the clinical outcomes of patients with PTC.
Methods: This retrospective study included 1,189 patients who underwent total thyroidectomy for PTCs equal to or larger than 1 cm in size. Clinical outcomes were evaluated and compared based on the BMI quartiles.
Results: There were no significant associations between BMI quartiles and primary tumor size, extrathyroidal invasion, cervical lymph node metastasis, or distant metastasis. However, an increase in mean age was associated with an increased BMI (P for trend <0.001). Multifocality and advanced tumor-node-metastasis (TNM) stage (stage III or IV) were significantly associated
with increases of BMI (P for trend 0.02 and <0.001, respectively). However, these associations of multifocality and advanced
TNM stage with BMI were not significant in multivariate analyses adjusted for age and gender. Moreover, there were no differ-ences in recurrence-free survivals according to BMI quartiles (P=0.26).
Conclusion: In the present study, BMI was not associated with the aggressive clinicopathological features or recurrence-free sur-vivals in patients with PTC.
Keywords: Obesity; Thyroid neoplasms; Prognosis
INTRODUCTION
Obesity is associated with the development and progression of various cancers such as breast cancer, endometrial cancer, co-lon cancer, esophageal adenocarcinoma, prostate cancer, liver cell carcinoma, leukemia, non-Hodgkin lymphoma, and
mela-noma [1-4]. Recently, several epidemiologic studies have sug-gested a positive association between obesity and the preva-lence of thyroid cancer [5-10].
In addition to the increased prevalence of cancers, obesity is associated with aggressive pathological features and poor clini-cal outcomes such as increased risk of recurrence and
progres-Received: 22 August 2014, Revised: 19 September 2014,
Accepted: 6 October 2014
Corresponding author: Won Bae Kim
Division of Endocrinology and Metabolism, Department of Internal Medicine, Asan Medical Center, University of Ulsan College of Medicine, 88 Olympic-ro 43-gil, Songpa-gu, Seoul 05505, Korea
Tel: +82-2-3010-3913, Fax: +82-2-3010-6962, E-mail: kimwb@amc.seoul.kr
Copyright © 2015 Korean Endocrine Society
sion in breast and prostate cancers [11-14]. The relationships between obesity and clinical outcomes of thyroid cancer re-main still controversial. Three studies showed a correlation be-tween obesity and more advanced tumor stages [5,15,16]. A re-port suggested that overweight or obese patients with papillary thyroid carcinomas (PTC) larger than 1 cm in size had the in-creased risk of developing loco-regional persistent or recurrent disease [5]. However, other studies reported that a higher body mass index (BMI) was not associated with more aggressive pathological features, or the recurrence or persistence of dis-ease [17,18]. In fact, one study suggested that obesity might be correlated with less aggressive tumor invasion, although this finding was not statistically significant [17].
In the present study, we evaluated the associations of an in-creased BMI with clinicopathological features and the recur-rence-free survivals in patients with PTCs equal to or larger than 1 cm in size.
METHODS
Study subjects and design
This retrospective study included 1,189 patients who under-went total thyroidectomy for PTCs equal to or larger than 1 cm in size at Asan Medical Center in Seoul, Korea between 2000 and 2005. We reviewed medical records of the patients includ-ing preoperative body weights, heights, surgical records, pa-thology reports, and the results of therapeutic whole body scans to assess the initial clinicopathological status for each patient. The tumor node metastasis (TNM) stage was based on the sev-enth edition of the American Joint Committee on Cancer (AJCC) staging manual [19].
Anthropometric measurements
On the day of admission for thyroid surgery, the heights and weights were measured in patients wearing light clothing with-out shoes. BMI was calculated using the following formula; the weight in kilograms stratified by square of the height in meters (kg/m2
). For comparisons, patients were stratified into four groups according to gender-specific quartiles for BMI (kg/m2
): Q1 19.4 to 23.0, Q2 23.1 to 24.9, Q3 25.0 to 26.9, and Q4 27.0 to 38.2 for males; Q1 15.8 to 21.7, Q2 21.8 to 23.5, Q3 23.6 to 25.9, and Q4 26.0 to 37.1 for females.
Follow-up protocol for the detection of clinical recurrence
As we previously described, all patients were subjected to reg-ular physical examinations and assessments of serum
thyro-globulin (TG) levels in every 6 to 12 months interval [20]. Neck ultrasonography examinations were performed at least once during the follow-up period. Stimulated TG levels were evaluated in patients with thyroid-stimulating hormone with-drawal approximately 12 months after total thyroidectomy. Ad-ditional diagnostic imaging studies including fluorodeoxyglu-cose positron emission tomography and chest computed to-mography scans, were performed in patients whose distant me-tastases were clinically under suspicions [20]. Clinical recur-rence was defined as the reappearance of pathologically proven malignant tissues and/or the appearance of metastatic lesions in the lung, bone, and/or brain in patients initially confirmed to be in remission [20].
Statistical analysis
Categorical variables are presented as numbers and percentag-es. Continuous variables are expressed as mean±standard
de-viation. The BMI quartiles were calculated separately for males and females. All data analyses were performed using R version 3.0 and R libraries survival (R Foundation for Statistical Com-puting, Vienna, Austria; http://www.R-project.org). The com-parisons of continuous variables, such as age and maximal tu-mor diameter, according to BMI quartiles were conducted us-ing analysis of variance or Student t test. Trends across the in-creases in BMI quartiles were performed using a Cochran-Ar-mitage trend test, except for the nodal metastasis variable. Cat-egorical variables were analyzed using chi-square tests. In the multivariate analyses, the relative associations between BMI quartiles and advanced TNM stage or multifocality were pre-sented as odds ratios (ORs) with 95% confidence intervals (CIs) which were calculated using binominal logistic regres-sion analyses. A log-rank test was used to compare recurrence-free survivals among the BMI quartiles. Hazard ratios (HRs) and 95% CIs were derived from the Cox proportional hazards model. All of P values were two-sided. P<0.05 was considered
statistically significant.
RESULTS
Baseline characteristics
Total 1,189 patients (157 males and 1,032 females) were includ-ed in the present study. The baseline characteristics of patients are shown in Table 1. The mean age was 45.3±11.9 years and
640 patients (53.8%) were older than 45 years of age. The mean maximal tumor diameter was 2.1±1.2 cm. Extrathyroidal
patients (66.4%) and 466 (39.2%), respectively. Of the 1,189 pa-tients, 762 patients (64.1%) had cervical lymph node (LN) me-tastases, 181 (15.2%) had lateral neck LN metastases (N1b), and 25 (2.1%) had distant metastases at the initial diagnosis.
The mean BMI was 24.1±3.2 kg/m2
for all patients, 24.9±
3.0 kg/m2
for the males, and 23.5±3.3 kg/m2
for the females. Of the 1,189 patients, 384 (32.3%) were overweight (BMI, 25.0 to 29.9 kg/m2
), and 55 (4.6%) were obese (BMI ≥30.0 kg/m2
). The proportion of overweight and obese patients (BMI ≥25 kg/m2
) was markedly higher in males than females (48.4% vs. 35.2%, P=0.001).
Associations of BMI quartile groups with clinicopathological features of PTC
The clinicopathological features of the PTCs were evaluated
according to BMI quartile categories (Table 1). There were no significant associations for primary tumor size, extrathyroidal invasion, LN metastasis, or distant metastasis according to BMI quartiles. However, the mean age showed a significant in-crease across BMI quartiles (P<0.001). Multifocality and
ad-vanced TNM stage (stage III or IV) showed significantly in-creasing trends with the increases in BMI quartiles (P for trend=0.015 and <0.001, respectively).
In multivariate analyses, these associations of increased BMI with multifocality (OR, 1.11; 95% CI, 0.99 to 1.23; P=0.067)
and advanced TNM stage (OR, 1.11; 95% CI, 0.99 to 1.23; P=0.769) were disappeared after adjusting for age and gender.
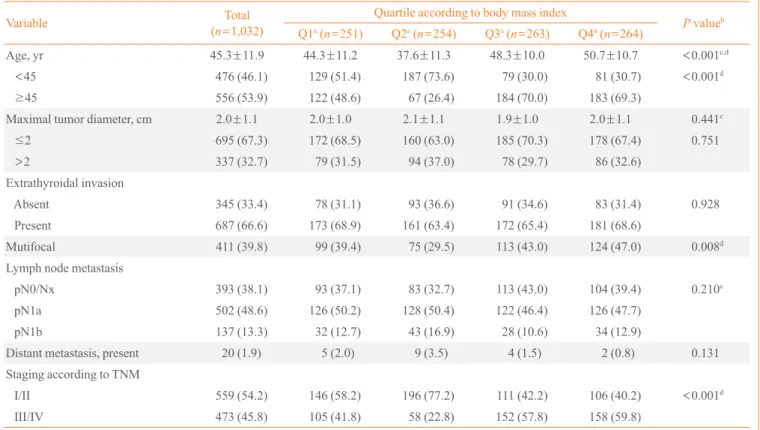
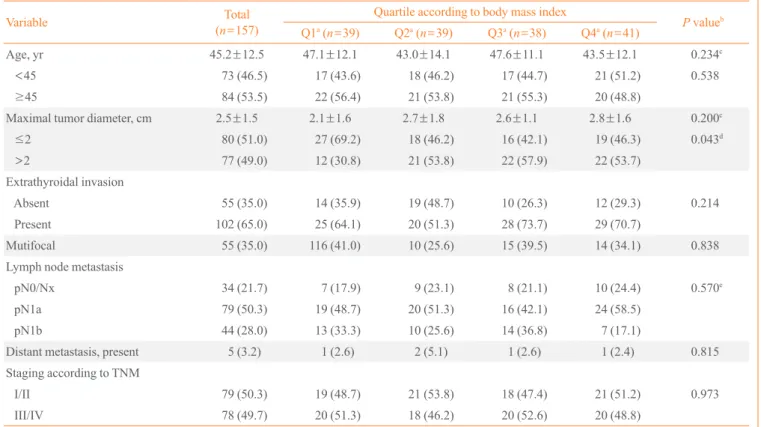
The associations between clinico-pathological features of PTC and BMI quartiles were also evaluated according to gender (Tables 2, 3). The females showed the same patterns as overall Table 1. Baseline Characteristics of Study Subjects and Associations between Body Mass Index Quartiles and Clinicopathological Features of Papillary Thyroid Carcinoma
Characteristic Total
(n=1,189)
Quartile according to body mass index
P valueb
Q1a (n=290) Q2a (n=293) Q3a (n=301) Q4a (n=305)
Age, yr 45.3±11.9 44.7±11.3 38.4±11.8 48.2±10.1 49.7±11.2 <0.001c,d
<45 549 (46.2) 146 (50.3) 205 (70.0) 96 (31.9) 102 (33.4) <0.001d
≥45 640 (53.8) 144 (49.7) 88 (30.0) 205 (68.1) 203 (66.6)
Gender
Male 157 (13.2) 39 (13.4) 39 (13.3) 38 (12.6) 41 (13.4) 0.939
Female 1,032 (86.8) 251 (86.6) 254 (86.7) 263 (87.4) 264 (86.6)
Maximal tumor diameter, cm 2.1±1.2 2.0±1.1 2.2±1.2 2.0±1.0 2.1±1.2 0.209c
≤2 775 (65.2) 199 (68.6) 178 (60.8) 201 (66.8) 197 (64.6) 0.633
>2 414 (34.8) 91 (31.4) 115 (39.2) 100 (33.2) 108 (35.4)
Extrathyroidal invasion
Absent 400 (33.6) 92 (31.7) 112 (38.2) 101 (33.6) 95 (31.1) 0.586
Present 789 (66.4) 198 (68.3) 181 (61.8) 200 (66.4) 210 (68.9)
Mutifocal 466 (39.2) 115 (39.7) 85 (29.0) 128 (42.5) 138 (45.2) 0.015d
Lymph node metastasis
pN0/Nx 427 (35.9) 100 (34.5) 92 (31.4) 121 (40.2) 114 (37.4) 0.330e
pN1a 581 (48.9) 145 (50.0) 148 (50.5) 138 (45.8) 150 (49.2)
pN1b 181 (15.2) 45 (15.5) 53 (18.1) 42 (14.0) 41 (13.4)
Distant metastasis, present 25 (2.1) 6 (2.1) 11 (3.8) 5 (1.7) 3 (1.0) 0.145
Staging according to TNM
I/II 638 (53.7) 165 (56.9) 217 (74.1) 129 (42.9) 127 (41.6) <0.001d
III/IV 551 (46.3) 125 (43.1) 76 (25.9) 172 (57.1) 178 (58.4)
Values are expressed as mean±SD or number (%).
TNM, tumor node metastasis.
aQuartiles for body mass index (kg/m2): Q1 19.4–23.0, Q2 23.1–24.9 , Q3 25.0–26.9, and Q4 27.0–38.2 for males and Q1 15.8–21.7, Q2 21.8–23.5,
Q3 23.6–25.9, and Q4 26.0–37.1 for females; bP values for trends across the body mass index quartiles were conducted using a Cochran-Armitage
trend test, except nodal metastasis variable; cP values by analysis of variance; dStatistically significant; eNodal metastasis variable was analyzed by a
vivals in patients who underwent total thyroidectomy for PTCs. There were no significant relationships between increased BMI and clinicopathological features of PTC. Patients with PTCs that were less than 1 cm in size were excluded because papil-lary thyroid microcarcinoma has favorable prognoses which included a low rate of distant metastasis and a low risk of dis-ease recurrence [21-23].
In this study, we applied gender-specific BMI quartiles to the data to evaluate possible associations between increased BMI and clinicopathological features of PTC. Gender is an im-portant contributing factor to obesity, and a significant differ-ence in the proportion of obese patients according to gender was observed in our study (males vs. females, 48.4% vs. 35.2%; P=0.001). Therefore, gender-specific BMI quartiles
were calculated to adjust for the differences in BMI distribu-tion between males and females.
In univariate analyses, an advanced TNM stage was signifi-cantly associated with increased BMI. However, this increase subjects, while the proportion of the males with maximal tumor
diameters larger than 2 cm was associated with higher BMI quartile (P for trend=0.043). However, its association
disap-peared after adjusting for age (The data was not shown).
Recurrence-free survivals according to BMI quartiles
After the exclusion of patients with distant metastases at initial diagnosis (n=25), the recurrence-free survivals of the PTC
pa-tients were evaluated during median 8.4 years of the follow-up period. Total 160 of 1,164 patients (13.7%) experienced PTC recurrence during the follow-up. There were no significant dif-ferences in recurrence-free survivals across the BMI quartiles (log rank statistics=4.0, df=3, P=0.26) (Fig. 1).
DISCUSSION
The present study evaluated associations of the increases in BMI with clinicopathological features and recurrence free
sur-Table 2. Associations between Body Mass Index Quartile and Clinicopathological Features for Females
Variable Total
(n=1,032)
Quartile according to body mass index
P valueb
Q1a
(n=251) Q2a
(n=254) Q3a
(n=263) Q4a
(n=264)
Age, yr 45.3±11.9 44.3±11.2 37.6±11.3 48.3±10.0 50.7±10.7 <0.001c,d
<45 476 (46.1) 129 (51.4) 187 (73.6) 79 (30.0) 81 (30.7) <0.001d
≥45 556 (53.9) 122 (48.6) 67 (26.4) 184 (70.0) 183 (69.3)
Maximal tumor diameter, cm 2.0±1.1 2.0±1.0 2.1±1.1 1.9±1.0 2.0±1.1 0.441c
≤2 695 (67.3) 172 (68.5) 160 (63.0) 185 (70.3) 178 (67.4) 0.751
>2 337 (32.7) 79 (31.5) 94 (37.0) 78 (29.7) 86 (32.6)
Extrathyroidal invasion
Absent 345 (33.4) 78 (31.1) 93 (36.6) 91 (34.6) 83 (31.4) 0.928
Present 687 (66.6) 173 (68.9) 161 (63.4) 172 (65.4) 181 (68.6)
Mutifocal 411 (39.8) 99 (39.4) 75 (29.5) 113 (43.0) 124 (47.0) 0.008d
Lymph node metastasis
pN0/Nx 393 (38.1) 93 (37.1) 83 (32.7) 113 (43.0) 104 (39.4) 0.210e
pN1a 502 (48.6) 126 (50.2) 128 (50.4) 122 (46.4) 126 (47.7)
pN1b 137 (13.3) 32 (12.7) 43 (16.9) 28 (10.6) 34 (12.9)
Distant metastasis, present 20 (1.9) 5 (2.0) 9 (3.5) 4 (1.5) 2 (0.8) 0.131
Staging according to TNM
I/II 559 (54.2) 146 (58.2) 196 (77.2) 111 (42.2) 106 (40.2) <0.001d
III/IV 473 (45.8) 105 (41.8) 58 (22.8) 152 (57.8) 158 (59.8)
Values are expressed as mean±SD or number (%). TNM, tumor node metastasis.
aQuartiles for body mass index (kg/m2): Q1 15.8–21.7, Q2 21.8–23.5, Q3 23.6–25.9, and Q4 26.0–37.1 for females; bP values for trends across the
was also associated with older age. Age at the time of diagnosis was a major variable when assessing tumor staging based on the AJCC TNM staging system [19]. Therefore, age might be a confounding factor when assessing the impact of obesity in the TNM stage of PTC. In our multivariate analysis, the positive association between BMI and advanced TNM stage disap-peared after adjusting for age and gender.
The World Health Organization defined obesity as BMI ≥ 30.0 kg/m2
[24]. Tresallet et al. [5] suggested that overweight or obese patients with PTC larger than 1 cm in size had an in-creased risk of developing loco-regional persistent or recurrent disease (OR, 3.8; P=0.03). Using Western standards, these
au-thors categorized 14.5% of patients as obese (BMI ≥30.0 kg/ m2
) and 29.3% of patients as overweight (BMI, 25.0 to 29.9 kg/m2
). However, only 55 of 1,189 patients (4.6%) in the pres-ent study had BMI ≥30.0 kg/m2
. The Korean Endocrine Soci-ety defined obesity as BMI ≥25.0 kg/m2
[25]. Using this defi-nition, approximately 36% of patients in the present study were Table 3. Associations between Body Mass Index Quartiles and Clinicopathological Features for Males
Variable Total
(n=157)
Quartile according to body mass index
P valueb
Q1a
(n=39) Q2a
(n=39) Q3a
(n=38) Q4a
(n=41)
Age, yr 45.2±12.5 47.1±12.1 43.0±14.1 47.6±11.1 43.5±12.1 0.234c
<45 73 (46.5) 17 (43.6) 18 (46.2) 17 (44.7) 21 (51.2) 0.538
≥45 84 (53.5) 22 (56.4) 21 (53.8) 21 (55.3) 20 (48.8)
Maximal tumor diameter, cm 2.5±1.5 2.1±1.6 2.7±1.8 2.6±1.1 2.8±1.6 0.200c
≤2 80 (51.0) 27 (69.2) 18 (46.2) 16 (42.1) 19 (46.3) 0.043d
>2 77 (49.0) 12 (30.8) 21 (53.8) 22 (57.9) 22 (53.7)
Extrathyroidal invasion
Absent 55 (35.0) 14 (35.9) 19 (48.7) 10 (26.3) 12 (29.3) 0.214
Present 102 (65.0) 25 (64.1) 20 (51.3) 28 (73.7) 29 (70.7)
Mutifocal 55 (35.0) 116 (41.0) 10 (25.6) 15 (39.5) 14 (34.1) 0.838
Lymph node metastasis
pN0/Nx 34 (21.7) 7 (17.9) 9 (23.1) 8 (21.1) 10 (24.4) 0.570e
pN1a 79 (50.3) 19 (48.7) 20 (51.3) 16 (42.1) 24 (58.5)
pN1b 44 (28.0) 13 (33.3) 10 (25.6) 14 (36.8) 7 (17.1)
Distant metastasis, present 5 (3.2) 1 (2.6) 2 (5.1) 1 (2.6) 1 (2.4) 0.815
Staging according to TNM
I/II 79 (50.3) 19 (48.7) 21 (53.8) 18 (47.4) 21 (51.2) 0.973
III/IV 78 (49.7) 20 (51.3) 18 (46.2) 20 (52.6) 20 (48.8)
Values are expressed as mean±SD or number (%). TNM, tumor node metastasis.
aQuartiles for body mass index (kg/m2); Q1 19.4–23.0, Q2 23.1–24.9, Q3 25.0–26.9, and Q4 27.0–38.2 for males; bP values for trends across the
body mass index quartiles were conducted using a Cochran-Armitage trend test, except nodal metastasis variable; cP values by analysis of variance; dStatistically significant; eNodal metastasis variable was analyzed by a chi-square test.
Fig. 1. Recurrence-free survivals across the body mass index (BMI) quartiles. There were no significant differences in recur-rence-free survivals of papillary thyroid carcinoma patients across the BMI quartiles. The numbers of patients who remained no evi-dence of disease at each time point were described at the bottom.
1.0
0.8
0.6
0.4
0.2
0
Recurrence-free survival (%)
0 2 4 6 8 10 12
284 263 237 210 167 49 15
282 249 217 193 165 54 21
296 262 240 213 174 53 19
302 269 237 213 174 58 17
Q1
Q2 Q3
Q4
Duration of follow-up (yr) Log rank=4.0, df=3, P=0.26
Q1
Q2 Q3
categorized as the obese group. This difference in the preva-lence of obesity between Western countries and Korea may ex-plain the lack of associations between obesity and clinico-path-ological features of PTC. Therefore, BMI quartiles were used for analyses in this study.
This retrospective study has several limitations. First, infor-mation such as waist to hip ratio, percentage of body fat, skin-fold thickness, and assessments of intra-abdominal fat were unavailable. Thus, the present study defined obesity based only on BMI. Similarly, other potential contributing factors includ-ing the history of diabetes mellitus, dyslipidemia, smokinclud-ing, and physical activity could not be obtained. However, this study did include a large, homogenous, and well-defined population of subjects (n=1,189) with PTC equal to or greater than 1 cm
in size. Moreover, the study subjects underwent total thyroid-ectomy and followed by same strategy at one institution for long term period. And, we applied gender-specific BMI quar-tiles.
In conclusion, the present study found that increased BMI was not associated with the clinical outcomes of patients with PTC, including their clinicopathological features and recur-rence-free survivals.
CONFLICTS OF INTEREST
No potential conflict of interest relevant to this article was re-ported.
ACKNOWLEDGMENTS
This study was supported by the 2013 Korean Endocrine Soci-ety Research Grant Award in year 2013.
REFERENCES
1. Renehan AG, Tyson M, Egger M, Heller RF, Zwahlen M.
Body-mass index and incidence of cancer: a systematic re-view and meta-analysis of prospective observational stud-ies. Lancet 2008;371:569-78.
2. Wolin KY, Carson K, Colditz GA. Obesity and cancer.
On-cologist 2010;15:556-65.
3. Marcello MA, Cunha LL, Batista FA, Ward LS. Obesity and
thyroid cancer. Endocr Relat Cancer 2014;21:T255-71.
4. De Pergola G, Silvestris F. Obesity as a major risk factor for
cancer. J Obes 2013;2013:291546.
5. Tresallet C, Seman M, Tissier F, Buffet C, Lupinacci RM,
Vuarnesson H, et al. The incidence of papillary thyroid car-cinoma and outcomes in operative patients according to their body mass indices. Surgery 2014;156:1145-52.
6. Han JM, Kim TY, Jeon MJ, Yim JH, Kim WG, Song DE, et
al. Obesity is a risk factor for thyroid cancer in a large, ul-trasonographically screened population. Eur J Endocrinol 2013;168:879-86.
7. Marcello MA, Sampaio AC, Geloneze B, Vasques AC,
As-sumpcao LV, Ward LS. Obesity and excess protein and car-bohydrate consumption are risk factors for thyroid cancer. Nutr Cancer 2012;64:1190-5.
8. Zhao ZG, Guo XG, Ba CX, Wang W, Yang YY, Wang J, et
al. Overweight, obesity and thyroid cancer risk: a meta-analysis of cohort studies. J Int Med Res 2012;40:2041-50.
9. Rinaldi S, Lise M, Clavel-Chapelon F, Boutron-Ruault MC,
Guillas G, Overvad K, et al. Body size and risk of differenti-ated thyroid carcinomas: findings from the EPIC study. Int J Cancer 2012;131:E1004-14.
10. Xu L, Port M, Landi S, Gemignani F, Cipollini M, Elisei R, et
al. Obesity and the risk of papillary thyroid cancer: a pooled analysis of three case-control studies. Thyroid 2014;24:966-74.
11. Strom SS, Wang X, Pettaway CA, Logothetis CJ,
Yamamu-ra Y, Do KA, et al. Obesity, weight gain, and risk of bio-chemical failure among prostate cancer patients following prostatectomy. Clin Cancer Res 2005;11(19 Pt 1):6889-94.
12. Collaborative Group on Hormonal Factors in Breast
Can-cer. Breast cancer and hormone replacement therapy: col-laborative reanalysis of data from 51 epidemiological stud-ies of 52,705 women with breast cancer and 108,411 wom-en without breast cancer. Lancet 1997;350:1047-59.
13. Borugian MJ, Sheps SB, Kim-Sing C, Olivotto IA, Van
Patten C, Dunn BP, et al. Waist-to-hip ratio and breast can-cer mortality. Am J Epidemiol 2003;158:963-8.
14. Protani M, Coory M, Martin JH. Effect of obesity on
sur-vival of women with breast cancer: systematic review and meta-analysis. Breast Cancer Res Treat 2010;123:627-35.
15. Kim HJ, Kim NK, Choi JH, Sohn SY, Kim SW, Jin SM, et
al. Associations between body mass index and clinico-path-ological characteristics of papillary thyroid cancer. Clin En-docrinol (Oxf) 2013;78:134-40.
16. Harari A, Endo B, Nishimoto S, Ituarte PH, Yeh MW. Risk
of advanced papillary thyroid cancer in obese patients. Arch Surg 2012;147:805-11.
17. Paes JE, Hua K, Nagy R, Kloos RT, Jarjoura D, Ringel
thy-roid cancer pathology features and outcomes: a clinicopath-ological cohort study. J Clin Endocrinol Metab 2010;95: 4244-50.
18. Kim JY, Jung EJ, Jeong SH, Jeong CY, Ju YT, Lee YJ, et al.
The indices of body size and aggressiveness of papillary thyroid carcinoma. J Korean Surg Soc 2011;80:241-4.
19. Edge S, Byrd DR, Compton CC, Fritz AG, Greene FL, Trotti
A, AJCC cancer staging manual. 7th ed. New York: Spring-er; 2010. p. 87-96.
20. Yim JH, Kim WB, Kim EY, Kim WG, Kim TY, Ryu JS, et
al. The outcomes of first reoperation for locoregionally re-current/persistent papillary thyroid carcinoma in patients who initially underwent total thyroidectomy and remnant ablation. J Clin Endocrinol Metab 2011;96:2049-56.
21. Hay ID, Hutchinson ME, Gonzalez-Losada T, McIver B,
Reinalda ME, Grant CS, et al. Papillary thyroid microcarci-noma: a study of 900 cases observed in a 60-year period. Surgery 2008;144:980-7.
22. Baudin E, Travagli JP, Ropers J, Mancusi F, Bruno-Bossio G,
Caillou B, et al. Microcarcinoma of the thyroid gland: the Gustave-Roussy Institute experience. Cancer 1998;83:553-9.
23. Appetecchia M, Scarcello G, Pucci E, Procaccini A.
Out-come after treatment of papillary thyroid microcarcinoma. J Exp Clin Cancer Res 2002;21:159-64.
24. World Health Organization. Obesity: preventing and
man-aging the global epidemic: report of a WHO consultation on obesity. Geneva: World Health Organization; 1997.
25. Korean Endocrine Society; Korean Society for the Study of