Vol-7, Special Issue-March, 2016, pp192-201 http://www.bipublication.com
Case Report
Services Quality on Brand Preference and Purchase Intention of Customers
(case study: customers of Saderat bank)
Yaghoub Ansari 1, Habibollah Ahmadi2, Bijan Rezaei3, Mehran Taftish4 and Atefeh Rahimi5
1Mba, PhD Candidate, Islamic Azad University,
Science and Research Branch of Kohgiluyeh and Boyer-ahmad, Department of Management, Yasouj, Iran.
2 Department of Management, kohgiloyeh and boyer ahmad Branch,
Islamic Azad University, yasouj, Iran.
3Master of Management, Semnan University, Semnan, Iran 4
Master of Financial Management, Hormozgan University, Iran
5Master of Industrial Management, university of Isfahan, Iran
Corresponding author: Habibollah Ahmadi
ABSTRACT
The aim of present article is, define the relation between perceived service quality with the purchase intentions and Brand preference among the customers in Saderat bank of Tehran in Iran. This is a survey research. The research method is a descriptive survey. This study was conducted on customers in Saderat bank of Tehran in Iran. The sample comprises 300 responder, which randomly were chosed. Data of research have been gathered through a researcher-developed questionnaire and sampling has been done through census and analyzed with using the software of SPSS. The validity of the instrument was confirmed by validity of content and the reliability by Cronbach Alpha. Overall findings of research indicated that there is a positive and significant relationship between the perceived service quality and the purchase intentions, there is a positive and significant relationship between the Perceived service quality and the preference of brand and there is a positive relationship between the brand preference and the purchase intentions.
KEYWORDS: Perceived service quality, purchase intentions, Brand preference.
1. INTRODUCTION
According to increasing competition in the services and industry sectors, creating the powerful brands in these industries is very important. One of the key factors that help to create a powerful brand is investment and improves the quality of services. Today, the competition to improve quality of service there is as an topic of main strategic for firms that are
working in the service organizations.
Organizations that achieving to the superior
levels of quality of service attracts superior levels of customer satisfaction as a prelude to achieving to sustainable competitive advantage [1].
present ingredients [5]. Demirci orel, for example, investigated supermarket customer satisfaction of self-checkout, quality of service and customer loyalty [6]. This researcher reported that systems of self-checkout of service quality influenced customer loyalty positively through the route of customer satisfaction. Kuo et al created a theatrical framework to assessment of service quality of value-added services of mobile and sustained a more reasoning of the relations between perceived value, satisfaction of customer, service quality, and intention of post-purchase [7]. They indicated that quality of service influenced both customer satisfaction and customer perceived value positively. Further, perceived value in their research influenced on post-purchase intention and customer satisfaction positively.
2. Theoretical foundations of the research
2.1. Quality of Services
Thoughts of customers are main for the service quality in the organizations of service and industrial [8, 9]. In general employees on organizations interchangeably are willing to use the service quality and satisfaction terms. In front, Zeithaml and colleagues clearly described and evaluated two meanings clearly, and this has scintillated a remarkable level of controversy [10]. The basic effects and causes of these two meanings mainly are various [11]. Satisfaction of customer is mainly believed to be a wide idea, whiles, quality of service concentrates in defined service construct particularly [12]. Quality of Service is a sort of intensive assessment that indicates customer consciousness of particular service construct that comprise responsiveness, reliability, empathy, tangibility and assurance. However, satisfaction of customer is an extension [3] and is effected by the identification of quality of service. The Service Quality critic of Retail which developed by Dabholkar et al in1996 year is used in this research as the theoretical structure for evaluating the quality of
service comprising three measurable variables credibility, responsiveness and tangibles [13]. For the durability and development enhancing the quality level of service is main for every type of corporations. Since1970 to now the scholars has present considerable level of interest in quality of service [14]. The amount satisfaction of customer is a result of the adjustment of customers of the quality of service that expected of a particular service organization [15]. Actually, this concept was the base for the model
of SERVQUAL (Assurance; Reliability;
Empathy; Responsiveness and Tangibles) that see quality of service as the gap between the customer expectations with their perceptions of the favorable rate of service [2]. In recent section Haywood indicated three main features in a quality of service include judgment; facilities and behavior [16]. Yet, Brogowicz and colleague offered a model for quality of service that called
synthesized service quality model [17].
According to this model, if the customers effect by the word of mouth by customers or effected by actions of marketing such as media communications or advertising, thus gap of service quality arise into the consumers and customers though.
Parasuraman and colleague in1985 year indicated ten dimensions include [2]:
- security;
- courtesy;
- reliability;
- credibility;
- responsiveness;
- tangibles;
- competence;
- Access.
- communication;
- Understanding the customer.
2.2. Purchase intention
Consumer attitude also effect on purchase intention. Purchase intention is affected by market conditions and desirable approaches based on consumer’s financial position. Smith describes an interesting discussion position [18]. Smith describes an interesting discussion on use of purchase intention in the evaluation of effectiveness of automobile advertising. Purchase intention is used as input for model of novel product by Silk and Urban, 1978 [19]. Bass and Bessemer used purchase intentions in their well-known soft drink study [20].
Intentions of purchase significantly are
concentrated by the attitude of customers instead of other instruments such as factors or
demographics of economy [21]. Planned
behavior model were presented through [22] which was presented the development of its work in 1975 year reasoned action theory. In reasoned action theory it was presented that behavior arises through an intention of individual’s and that arises from the subjective and norms attitude, both are the beliefs function. Relation between intention of purchase, quality of service and satisfaction of customer was there either there is a post product purchase or customer satisfaction [23]. Taylor and colleagues included the relation between the quality of service and intention of purchase but satisfaction of customer is as a moderator variable between the intention of purchase and satisfaction of customer [24]. Intention of purchase is a consumer plan to purchase a particular product, and has been concentrates of main latter consideration. As present research is related with branding of services, we describes intention of purchase as the inclination to follow with using the customer service presented through particular suppliers.
2.3.Preference of Brand
Scholars has recognized two results which display a change in preference of brand that
following a promotion of sales: choice
probability and perceptions of brand. Researches which measuring brand perceptions of customers
typically measure changes in issues totally “liking” for the brand [25] or perceptions of brand quality [26, 27] which following offer to a promotion of sales. The second scale of post-promotion preference i.e. choice probability often directly is evaluated through brand choice of pre- promotion and post-promotion [28, 29]. Choice probability also indirectly has been measured through promotion-induced changes in sensitivity of price [30] and promotion- induced changes in brand loyalty [31].
2.4.Brand preference and purchase intentions
Preference of brand is the prejudice that a consumer have than a specific brand. Various scholars has emphasized the matter of building equity of brand, which brings the benefit to the organization of more brand preference of customer and purchase intentions of customer [32]. Hellier et al described brand preference as “the extent to which the customer favors the designated service provided by his or her present company, in comparison to the designated service provided by other companies in his or her consideration set” [33].
Hellier and colleagues offer a total service sector model of repurchase intentions [33]. The relation between preference of brand and intentions of repurchase is evaluated via a structural equation model. The universal model is evaluated to car insurance customer and customer of personal pension services. Preference of brand is found to have a positive and significant effect on repurchase intentions of customer.
3. Methodology and proposed model
3.1.Hypotheses of Research
1. There is a significant relation between the Perceived service quality and and the purchase intentions among the customers in Saderat bank of Tehran in Iran.
3. There is a significant relation between the Brand preference and the purchase intentions among the customers in Saderat bank of Tehran in Iran.
4. There is a significant relation between the tangible and the purchase intentions among the customers in Saderat bank of Tehran in Iran. 5. There is a significant relation between the Responsiveness and the purchase intentions among the customers in Saderat bank of Tehran in Iran.
6. There is a significant relation between the credibility and the purchase intentions among the customers in Saderat bank of Tehran in Iran. 7. There is a significant relation between the tangible and the Brand preference among the customers in Saderat bank of Tehran in Iran. 8. There is a significant relation between the Responsiveness and the Brand preference among the customers in Saderat bank of Tehran in Iran. 9. There is a significant relation between the credibility and the Brand preference among the customers in Saderat bank of Tehran in Iran.
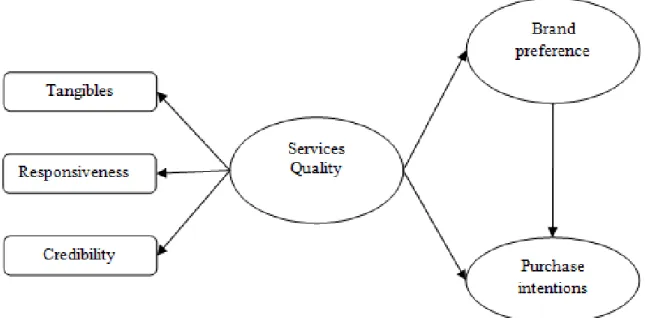
Fig 1: conceptual model
4. METHODOLOGY
In this research, tried to be measured relationship between the Perceived service quality and three dimensions, the purchase intentions and Brand preference among the customers in Saderat bank of Tehran in Iran. Therefore, 300 questionnaires were distributed among members of statistical community. The tool that was used to measure the quantitative data is SPSS 19 Software. All constructs were measured using five-point likert scales with anchors strongly disagree (= 1) and strongly agree (= 5). All items were positively
worded. In order to evaluate the validity of the data achieved through instrument (questionnaire)
internal consistency between variables of research.
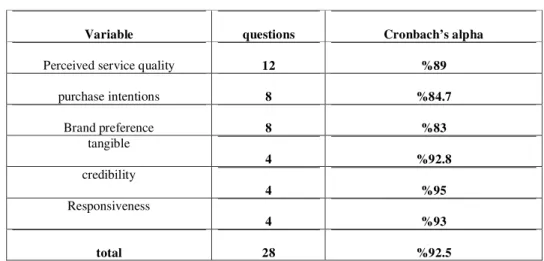
Table 1: reliability coefficient of research variables related to given hypotheses
5. findings analysis
5.1.Descriptive data
Descriptive statistical data of table 2 indicates the relation to the customers that participated to the article (n = 300). The social demographic qualification of the participants are as follows: 138 and 162 participated to the research. The
educational background of the participants are; 69 diploma, 72 people have Associate course, 106 people have b.sc degree and 39 people have m. sc degree and 14 people PhD degree. The age classification of participants are; 6 people are between 15 - 20; 122 people are between 21-30; 63 people are between 31-40, ; 28 people are between 41-50 and 27 people are more than the age of 50.
Variable Name Frequency
Gender Male 138
Female 162
Education
Diploma 69
Associate course 72
b.sc 106
m. sc 39
PhD 14
Age
<20 60
21 – 30 122
31 – 40 63
41 – 50 28
50 < 27
Table 2. Demographic qualifications of participants
Table 3 shows all Pearson correlation
coefficients of all variables. All variables are significant relevant at the 0.05 level correlation, among which Perceived service quality and purchase intentions is significantly positively
correlated (C = 0.549). Also, Perceived service quality and Brand preference (C = 0.455) and purchase intentions and Brand preference (C = 0.535) are significantly positively correlated.
Variable 1 2 3
1 Perceived service quality .712 - -
2 purchase intentions .549 .744 -
3 Brand preference .455 .535 .790
Table 3: correlations
Cronbach’s alpha questions
Variable
%89 12
Perceived service quality
%84.7 8
purchase intentions
%83 8
Brand preference
%92.8 4
tangible
%95 4
credibility
%93 4
Responsiveness
%92.5 28
6. RESULTS
In the under Tables, beta, T and result for each of the variables in research variables was examined. For example, in the first hypothesis, beta is 0.
546, t value is 9.422 and hypothesis was accepted
Hypothesis 1: There is a significant relation between the Perceived service quality and the purchase intentions among the customers in
Saderat bank of Tehran in Iran:
Result t
beta Dependent variable
Independent variable Hypothesis
Accepted 9.422
.546 purchase intentions
Perceived service quality 1
Table 4: hypothesis 1
As shown in table 4, since observed beta is equal to. 546 and T is 9.422, so there is a significant relation between the Perceived service quality and the purchase intentions among the customers in Saderat bank of Tehran in Iran with 95% confidence.
Hypothesis 2: There is a significant relation between the perceived service quality and the Brand preference among the customers in Saderat bank of Tehran in Iran.
Result t
beta Dependent variable
Independent variable Hypothesis
Accepted 3.180
.167 Brand preference
Perceived service quality 2
Table 5: hypotheses 2
As shown in table 5, since observed beta is equal to .167 and T is 3.180, so there is a significant relation between the Perceived service quality and the brand preference among the customers in Saderat bank of Tehran in Iran with 95% confidence.
Hypothesis 3: There is a significant relation between the brand preference and the purchase intentions among the customers in Saderat bank of Tehran in Iran.
Result t
beta Dependent variable
Independent variable Hypothesis
Accepted 2.166
.123 purchase intentions
Brand preference 3
Table 6: hypotheses 3
As shown in table 6, since observed beta is equal to .123 and T is 2.166, so there is a significant relation between Brand preference and purchase intentions among the customers in Saderat bank of Tehran in Iran with 95% confidence.
Hypothesis 4: There is a positive and significant relation between the tangible and the purchase intentions among the customers in Saderat bank of Tehran in Iran.
Result t
beta Dependent variable
Independent variable Hypothesis
Accepted 4.485
.259 purchase intentions
tangible 4
Table 7: hypotheses 4
As shown in table 7, since observed beta is equal to .259 and T is 4.485, so there is a significant relation between the tangible and the purchase intentions among the customers in Saderat bank of Tehran in Iran with 95% confidence.
Hypothesis 5: There is a significant relation between the Responsiveness and the purchase intentions among the customers in Saderat bank of Tehran in Iran.
Result t
beta Dependent variable
Independent variable Hypothesis
Accepted 4.061
.314 purchase intentions
Responsiveness 5
As shown in table 8, since observed beta is equal to .314 and T is 4.061, so there is a significant relation between the Responsiveness and the purchase intentions among the customers in Saderat bank of Tehran in Iran with 95% confidence.
Hypothesis 6: There is a significant relation between the credibility and the purchase intentions among the customers in Saderat bank of Tehran in Iran.
Result t
beta Dependent variable
Independent variable Hypothesis
Accepted 5.429
.315 purchase intentions
credibility 6
Table 9: hypotheses 6
As shown in table 9, since observed beta is equal to .315 and T is 5. 429, so there is a significant relation between the credibility and the purchase intentions among the customers in Saderat bank of Tehran in Iran with 95% confidence.
Hypothesis 7: There is a significant relation between the tangible and the Brand preference among the customers in Saderat bank of Tehran in Iran.
Result t
beta Dependent variable
Independent variable Hypothesis
Rejected 6.835
.491 Brand preference
tangible 7
Table 10: hypotheses 6
As shown in table 10, since observed beta is equal to .491 and T is 6.835, so there is a significant relation between the tangible and the Brand preference among the customers in Saderat bank of Tehran in Iran with 95% confidence.
Hypothesis 8: There is a significant relation between the Responsiveness and the Brand preference among the customers in Saderat bank of Tehran in Iran.
Result t
beta Dependent variable
Independent variable Hypothesis
Accepted 6.752
.361 Brand preference
Responsiveness 8
Table 11: hypotheses 6
As shown in table 11, since observed beta is equal to .361 and T is 6.752, so there is a significant relation between the Responsiveness and the Brand preference among the customers in Saderat bank of Tehran in Iran with 95% confidence.
Hypothesis 9: There is a significant relation between the credibility and the Brand preference among the customers in Saderat bank of Tehran in Iran.
Result t
beta Dependent variable
Independent variable Hypothesis
Accepted 5.702
.446 Brand preference
credibility 9
Table 12: hypotheses 6
As shown in table 12, since observed beta is equal to .446 and T is 5.702, so there is a significant relation between credibility &Brand preference among the customers in Saderat bank of Tehran in Iran with 95% confidence.
7. Conclusions and suggestions
The aim of this article is, investigate the relationship between Perceived service quality
significant relation between the Brand preference and the purchase intentions, (4): There is a significant relation between the tangible and the purchase intentions, (5): There is a significant relation between the responsiveness and the purchase intentions, (6): There is a significant relation between the credibility and the purchase intentions, (7): There is a significant relation between the tangible and the Brand preference, (8): There is a significant relation between the Responsiveness and the Brand preference and (9): There is a significant relation between the credibility and the Brand preference. Moreover, the results of present research can helping to managers of marketing in service organizations to allocate resources in plans of conducting marketing. Among the two antecedents, attitude of brand has a higher total effect on the following favorite constructs, purchase intention, brand equity and brand preference. In result, managers of service marketing could concentrates on forming consumers brand attitude. This is the case when interactions between employees of service and service customers take place.
- Improving the traditional service quality and
accelerating to deliver in bank,
- Improving the quality of electronic services
and online in bank,
- Improving the process of Bank employees
accountability to customers,
- Strengthening and ensuring the safety of the
banking system and maintaining the customer privacy,
- Designing the practical, safe and reliable
Website for online banking services,
- Increasing the easy access to banking
services,
- Customization the banking services and
providing customer service according to their needs and aspirations
- Increasing the diversity and differentiation in banking.
REFERENCES
1. Guo, X. and Duff, A. and Hair, M. (2008). "Service Quality Measurement in the Chinese Corporate Banking Market", International Journal of Bank Marketing, 26(5), 305-327.
2. Parasuraman, A. and Zeithaml, V. A. and
Berry, L. L. (1985). "A conceptual model of service quality and its implications for future research". the Journal of Marketing, 41-50.
3. Parasuraman, V. and Zeithaml, A. and L. L. Berry. (1988). "SERVQUAL: A
multiple-item scale for measuringconsumer
perceptions of service quality", Journal of Retailing, vol.64, no.1, pp.12-40.
4. Segoro, W. (2013). "The influence of
perceived service quality, mooring factor, and relationship quality on customer satisfaction and loyalty". Procedia-Social and Behavioral Sciences, 81, 306- 310.
5. Wu, C. H. J. and Liang, R. D. (2009). "Effect of experiential value on customer satisfaction with service encounters in luxury-hotel
restaurants". International Journal of
HospitalityManagement, 28(4), 586-593.
6. Demirci Orel, F. and Kara, A. (2014).
"Supermarket self-checkout service quality, customersatisfaction, and loyalty: Empirical evidence from an emerging market". Journal of Retailing and Consumer Services, 21(2), 118-129.
7. Kuo, Y. F. and Wu, C. M. and Deng, W. J.
(2009). "The relationships among service
quality, perceived value, customer
satisfaction, and post-purchase intention in mobile value-addedservices". Computers in human behavior, 25(4), 887-896.
8. Dabholkar, C. D. and Shepherd, D. and I.
Thorpe. (2000). "A comprehensive
framework for service quality:An
9. Lee, B. Y. and Shih, Y. S. (2008). "Chung, The exploration of consumers' behavior in choosing hospitalby the application of neural network", An International Journal of Expert Systems with Applications,vol.34, no.4, pp.806-816.
10.Zeithaml, M. J. and Bitner D. and Gremler, D.
(2006). "Service Marketing: Integrating
Customer FocusAcross the Firm", McGraw-Hill, New York.
11.Cronin, M. K. and Brady G. T. and Hult, M. (2000). "Assessing the effects of quality, value and customersatisfaction on consumer
behavioral intentions in service
environments", Journal of Retailing,
vol.76,no.2, pp.193-218, 2000.
12.Brady, J. J. and Cronin. (2001). "Some new thought on conceptualizing perceived service quality: Ahierarchical approach", Journal of Marketing, vol.65, pp.34-49.
13.Dabholkar, D. I. Torpe and J. O. Rentz.
(1996). A measure of service quality for retail stores, Journalof the Academy of Marketing Science, vol.24, pp.3-16.
14.Gronroos, C. (2001). The perceived service quality concept – a mistake? Managing Service Quality, 11(3), 150-2.
15.Caruana, A., Ewing, M.T., and
Ramaseshan, B. (2000), “Assessment of the Three-Column Format SERVQUAL: An Experimental Approach,” Journal of Business Research, 49, pp. 57-65.
16.Haywood-Farmer, J. (1988). "A conceptual model of service quality". International
Journal of Operations &Production
Management, 8(6), 19-29.
http://dx.doi.org/10.1108/eb054839
17.Brogowicz, A. A. and Delene, L. M. and
Lyth, D. M. (1990). "A synthesised service quality model with managerial implications". International Journal of Service Industry
Management, 1(1), 27-44.
http://dx.doi.org/10.1108/0956423901000164 0
18.Smith, A. (1965). "An Inquiry into the Nature and Causes of The Wealth of Nations". Modern Library: New York.
19.Silk, A. J. and Urban, G. L. (1978). "Pre-Test Market Evaluation of New Product Goods: A
Model andMeasurement Methodology",
Journal of Marketing Research, 15, 171-191.
20.Knight, D. K. and Kim, E.Y. (2007).
"Japaneseconsumers’ need for uniqueness: effects on brand perceptions and purchase intention". Journal of Fashion Marketing and Management, 11(2): 270-280.
21.Ferrell, Z. and McIntosh. (1992). "Predicting intention to consume beef: normative versus attitudinal influences." Sociologia Ruralis, 250-265.
22.Ajzen, I. (1991). "The theory of planned behavior". Organizational Behavior and Human Decision Processes, 1991: 179-211. 23.Cronin, and Taylor. S. A. (1992). "Measuring
service quality". Journal of Marketing. 24.Taylor, S. A. and Thomas L. B. (1994). "An
Assessment of the Relationship between Service Quality and Customer Satisfaction in the Formation of Consumers’ Purchase Intentions". Journal of Retailing.
25.Tybout, A. M. and Carol A. S. (1983).
“Availability of Well-DefinedInternal
Knowledge and the Attitude Formation Process: InformationAggregation Versus Self-Perception,” Journal of Personality and SocialPsychology, 44 (3), 474–491.
26.Dawar, N. and Miklos, S. (1997). “The
Signaling Impact of LowIntroductory Price on Perceived Quality and Trial,” Marketing Letters,8, 251–259.
27.Low, G. S. and Donald, R. L. (1993). “The
Effect of DoubleDeals on Consumer
Attitudes,” Journal of Retailing, 69, 453–466.
28.Motes, W. (1987). “Replication of Pricing
Effects on Brand ChoiceBehaviour,”
29.Scott, C. A. (1976). “Effects of Trial and Incentives on Repeat PurchaseBehavior,” Journal of Marketing Research, 13, 263–269.
30.Srinivasan, Sh. and Peter, T. L. and
Popkowski, L. and Frank, M.B. (2000). “Market Share Response and Competitive
Interaction:The Impact of Temporary,
Evolving, and Structural Changes inPrices,”
International Journal of Research in
Marketing, 17, 281–305.
31.Bhattacharya, C. B. and Peter, S. and Fader, L. and Lodish, M. and Wayne, S. andDeSarbo. (1996). “The Relationship Between the Marketing Mix andShare of Category Requirements,” Marketing Letters, 7 (1), 5–18.
32.Cobb-Walgren, C. J. and Ruble, C. A. and Donthu, N. (1995). "Brand equity, brand preference, and purchase intent". Journal of Advertising, 24(3), 25-40.
33.Hellier, P. K. and Geursen, G. M. and Carr, R.
A. and Richard, J. A. (2003). "Customer repurchaseintention: a general structural equation model". European Journal of Marketing, 37(11/12),1762-1800.
34.Dawes, J. (2004). “Assessing the Impact of a