M
ASTERS
F
INAL
T
HESIS
INTERACTION OF BRAND COMMUNITY AND PURCHASE
INTENTIONS
JOÃO PEDRO GOMES ROGADO QUINTINO
M
ASTERS
F
INAL
T
HESIS
INTERACTION OF BRAND COMMUNITY AND
P
URCHASE
I
NTENTIONS
JOÃO PEDRO GOMES ROGADO QUINTINO
S
UPERVISOR:
P
ROF.
D
OUTORJ
OSÉM
ANUELC.
V
ERÍSSIMOTHESIS COMMITTEE
P
RESIDENT:
P
ROF.
D
OUTORAH
ELENAD
OC
ARMOM
ILAGREM
ARTINSG
ONÇALVESC
OMMITTEEM
EMBERS:
P
ROF.
D
OUTORAP
ATRICIAI
SABELR
AMOSP
EGON
UNEST
AVARESP
ROF.
D
OUTORJ
OSÉM
ANUELC.
V
ERÍSSIMOA
CKNOWLEDGMENTSI would like to express my sincere gratitude and appreciation to
everyone who offered me valuable support and encouragement during the
completion of my Masters degree. I am very thankful to Professor José Manuel
Veríssimo for his supervision, guidance, and advice in all stages of this work.
Without his guidance, this study could not have been accomplished.
Finally, but not least, I am deeply grateful to my beloved family,
especially my wife, Lina, for all the sacrifices she has made and for offering
T
ABLE OFC
ONTENTSAcknowledgments ... II
Table of Contents ... III
List of Tables ... V
List of Figures ... V
Abstract ... VI
1. Introduction ... 1
1.1. Relevance of Social Media ... 1
2. Literature Review ... 3
2.1. Web 2.0 Social Media Platforms ... 3
2.2. Facebook Pages for Businesses, Organizations, and Personalities .. 3
2.3. Social Media Brand Communities ... 4
2.4. Interaction Involvement (Brand Relationship) ... 5
2.5. Social Media Content ... 6
2.6. Purchase Intentions ... 7
3. Conceptual Model ... 8
3.1. Hypotheses ... 10
4. Methodology ... 12
4.1. Description and Justification of the Methods ... 12
4.2. Research Procedure ... 13
4.3. Questionnaire Design ... 14
4.4. Target Population and Sampling Design ... 16
4.5. Internal Consistency ... 17
5. Data Analysis and Results ... 20
5.1. Sample Characterization ... 20
5.2. Descriptive Analysis ... 21
5.3. Regression models ... 26
5.4. Hypotheses Testing ... 27
6.1. Discussion ... 31
6.2. Academic Implications ... 32
6.3. Practical Implications ... 33
6.4. Limitations ... 33
6.5. Future Research ... 34
7. References and Bibliography ... 35
8. Appendixes ... 39
L
IST OFT
ABLESTABLE 1—MEASUREMENT SCALES ... 15
Table 2—Cronbach’s alpha coefficient, explained variance and unidimensional loadings of the dimensions ... 19
Table 3—Gender, age and education variables ... 21
Table 4—Facebook usage frequency ... 23
Table 5—Purchase intention of a product or service promoted by a Facebook brand community page that they “like” ... 24
Table 6—Motivations that led respondents to “like” a Facebook brand community page ... 25
Table 7—Scores of the scales in the global sample and by country ... 26
Table 8—Results of the regression model (global sample) ... 28
Table 9—Results of the regression model (Portugal sample) ... 29
Table 10—Results of the regression model (U.S. sample) ... 30
A
BSTRACTWith the proliferation of online communities, we have seen a migration
from real-world social relationships to virtual-world relationships, prompting
companies and brands to view social media—and Facebook in particular—as
a potential tool for marketing actions. Many companies and brands have
created their own Facebook brand community page as a communication tool
to reach customers.
The main purpose of this research is to investigate if the interactions of
Facebook users via different types of Facebook brand community content
have a positive impact on purchase intentions. In addition, this study
investigates whether there are any similarities and differences between
Facebook users residing in Portugal and the United States.
For this research, six hypotheses were developed and addressed using
a quantitative statistical research model. For data collection, an online
questionnaire was used, and 400 responses were obtained from a
convenience sample.
The findings from this research indicate that Facebook content, such as
information on products or services as well as promotions, has a positive
impact on purchase intention, with information being the more influential of the
two. These findings held true when studying the residents of Portugal and the
United States as distinct groups. There are some differences between the two
groups. For example, participation in games has a significant effect on
purchase intentions for individuals residing in the United States, but not for the
residents of Portugal. On the other hand, participation in sweepstakes has a
significant influence on purchase intentions for residents of Portugal, but not
for residents of the United States.
Finally, this study discusses the limitation of this research and offers
some directions for future research.
Keywords: Web 2.0 Social Media; Facebook Pages; Interaction; Brand
1. I
NTRODUCTION1.1. Relevance of Social Media
Web 2.0 and social media platforms have dramatically changed the way
individuals communicate and interact, and the rapid growth of web-based
platforms have likewise dramatically changed the nature of human behavior,
habitats, and activities (Tiago & Verissimo, 2014). Since the introduction of
social media in the early 1990s, and with the proliferation of online
communities, we have seen a migration from the real-world social relationship
to the virtual-world relationship, whereby individuals are able to share
knowledge and experiences across different cultures (Tiago & Verissimo,
2013). Social media encompass a broad range of online platforms, such as
Facebook, Twitter, YouTube, Instagram, blogs, and podcasting. According to a
survey conducted by the Pew Research Center (2013), Facebook remains the
dominant player in the social networking world; 42% of online adults use
multiple social networking sites, and Facebook remains the platform of choice.
Social media has assumed an important role in today’s society, especially
among youngsters. It is a place any individual can join by creating a private
profile. According to Gangadharbatla (2010), there are many reasons why
people want to join social media platforms; we as human beings have a need
for cognition, a need to belong to a community, and a need to establish our
Many individuals join Facebook mainly to stay in touch and interact with friends
and relatives and to experience entertainment.
The way businesses and organizations communicate with consumers has
changed from one-on-many to one-on-one (Michahelles & Cvijikj, 2011).
Businesses and organizations were traditionally in total control of their brand
value and were able to dictate their terms to the consumer. However, the
scenario has changed; the power is now on the consumer’s side.
With the increasing popularity of Facebook among Internet users,
companies and organizations have come to recognize its potential for
marketing activities, and one type of marketing activity that Facebook provides
for business is the creation of brand communities (Weman, 2011).
Facebook offers companies and brands the possibility to create a
Facebook brand community page to be used as a marketing tool to
communicate with customers. Facebook brand community pages are
Facebook pages created by companies and brands that are, in a sense,
“owned collectively” by the community connected to it.
The primary aim of this research is to establish whether different types
of consumer interaction (e.g., information, promotions, participation in games,
participation in sweepstakes, and level of interactivity) on brand fan pages
have a positive impact on purchasing.
The secondary aim is to study if engagement content on Facebook
brand community pages has a different impact on the purchasing intentions of
2. L
ITERATURER
EVIEW2.1. Web 2.0 Social Media Platforms
With the introduction of Web 2.0 technology, broadcast media
monologues (one to many) were transformed into social media dialogues
(many to many) (Berthon et al., 2012). Many businesses are now using Web
2.0 social media platforms, such as Facebook and Twitter, to improve their
internal operation and to interact with customers, business partners, and
suppliers (Culnan, Mchugh, & Zubillaga, 2010). A survey conducted by
McKinsey (2009) that involved nearly 1,700 executives from around the world
suggested that Web 2.0 social platforms are effective: 69% of respondents
reported that their companies had positive, measurable results from the use of
Web 2.0 social media applications.
2.2. Facebook Pages for Businesses, Organizations, and Personalities
These pages are different from the standard pages used as personal
profiles, and they can be created by any user of Facebook in order to promote
businesses, brands, products, services, political figures, or celebrities
(Facebook, 2013). Companies and brands can post messages, videos, games,
information, and other materials for members to express their feelings about,
2.3. Social Media Brand Communities
A brand community consists of a geographically diverse group of
individuals who engage in a relationship with a brand. This relationship always
goes beyond the relationship with the brand; it also leads to relationships
among consumers, but always with a focus on the brand (Muniz Jr. & O’Guinn,
2001). According to Muniz Jr. and O’Guinn (2001), consumers who are
members of a brand community tend become more loyal to that brand and
have an active voice in the brand community. The authors noted that “things
that are publicly consumed may stand a better chance of producing
communities than those consumed in private.” Researchers of brand
communities agree that the main function of the brand communities is to
cultivate customers’ loyalty to the brand (Mcalexander, Schouten, & Koenig,
2014; Muniz Jr. & O’Guinn, 2001; Schau, Muñiz Jr, & Arnould, 2009).
Social media brand communities include Facebook fan pages, where
users join by clicking on the “Like” link. When users of Facebook become a fan
of a page, they are connecting with that organization or public figure and will
be able to interact with that organization or public figure.
According to Larocheet et al. (2012), many Internet users join virtual
communities to identify themselves with the brand and to fulfill their social
need for self-identity. According to Mclaughlin and Lee (2004), more than half
of consumers join brand communities to learn more about the brand within the
community. Economic benefits, such as discounts and promotions, are also
one of the possible reasons that consumers join a social media brand
2.4. Interaction Involvement (Brand Relationship)
In the last few years, customer engagement has being a topic of great
interest to marketers in several areas of business, as is evident by the large
numbers of recent publications, blogs, and forums on the subject (Sashi,
2012).
Brands and companies have been changing their traditional way of
communicating from a one-to-many to a one-to-one approach, providing
assistance and information through social networks such as Facebook
(Michahelles & Cvijikj, 2011). Through social networking, companies and
organizations can also acquire better knowledge of consumer needs and views
through members’ feedback and by observing and monitoring members’
engagement and interaction within the brand community (Michahelles & Cvijikj,
2011).
Brand community members participate in social media games via
interactive features, which add crucial value that may lead to a purchase
(Huang, 2012).
Consumers who engage in a more emotional relationship with an
organization identify themselves more with the organization than with their
products or services; these individuals often end up purchasing products or
services from these companies even though sometimes the quality is slightly
below their expectations (Bhattacharya & Sen, 2003).
Consumer-to-consumer communication is an important element of
social media engagement, where consumers are able to interact with the
aware of such discussions on the social media platform in order to be able to
properly intervene and attempt to steer those discussions more in line with the
organization’s missions and goals (Mangold & Faulds, 2009).
2.5. Social Media Content
Several researchers have employed uses and gratification (U&G) theory
to understand costumers’ goals and motivations toward engagement with
different contents (Cvijikj & Michahelles, 2013).
The benefits users can experience from social media content can be
categorized into hedonic and utilitarian consumption benefits. Hedonic values
are related to social media enjoyment and playfulness, and utilitarian values
are based on goal achievement, cognitive needs, values, and interests (Cotte,
Chowdhury, & Ricci, 2006).
According to Jahn and Kunz (2012), the most important drivers for
attracting users to join and interact via brand community fan pages are
valuable entertainment and innovative content. Brand community Facebook
pages provide their members with various types of content, including watching
videos, viewing photos, playing games, commenting on and creating posts,
and participating in contests and sweepstakes (Lin & Lu, 2011).
To be successful in social media, post content should focus not only on
products or services but also and mostly on engaging with consumers
regarding subjects that would inform and help customers know the people and
personality of the business. As a result of such an engagement approach,
2009). According to Mangold and Faulds, (2009) consumers go to social
media to get information and to stay current with the brand’s products and
promotional campaigns.
A successful social media marketing strategy should provide consumers
with relevant and up-to-date content and provide a means for consumers to
submit feedback. Feedback can come as criticism, approval, and helpful
suggestions (Mangold & Faulds, 2009).
2.6. Purchase Intentions
According to the American Marketing Association (2013), purchase
intentions is defined as “the decision plan to buy a particular product or brand
created through the choice/decision process.”
To better understand how consumers form their purchase decisions,
marketers need to identify who is responsible for the purchase decision. Thus,
people can be classified as imitators, users, influencers, deciders, approvers,
buyers, or gatekeepers. Each of these profiles needs to be addressed
differently (Kotler & Keller, 2009, p. 188).
The main purpose of marketing is to strength customer relationships,
with the ultimate goal of influencing purchase intentions (Kim & Ko, 2012).
Over the years, marketers have utilized different marketing strategies to
positively influence purchase intentions.
Social media is becoming a major factor in influencing several aspects
of consumer behavior, including purchase behavior (Mangold & Faulds, 2009).
page. In addition, they are a great marketing tool to influence customer
behavior and help maintain customer satisfaction and loyalty, therefore
triggering customer purchase intentions (Shang & Lin, 2013). Promoting
sweepstakes on Facebook fan pages is also a great marketing strategy to
increase customers’ interaction within Facebook fan pages. According to a
study conducted by Bushelow (2012), sweepstakes were the third main
motivation for consumers to join a Facebook fan page, which indicates the
importance of this activity for increasing interaction and, ultimately, purchase
intentions.
3. C
ONCEPTUALM
ODELAccording to Cotte et al. (2006), users experience social media content
based on either hedonic or utilitarian values. Hedonic values are related to
social media enjoyment and playfulness, whereas utilitarian values are based
on goal achievement, cognitive needs, values, and interests.
Many researchers have used hedonic and utilitarian values to measure
the outcomes of customers’ interaction with the brand community. Pöyry,
Parvinen, and Malmivaara (2012) employed a model where hedonic and
utilitarian values were used to measure the relationship between customers’
browsing and purchase intention on a Facebook brand community page. Jahn
and Kunz (2012) used a model to measure the functional and hedonic content
values as drivers of brand community members’ participation.
In this research, we utilize hedonic and utilitarian values of the four
promotions, participation in games, and participation in sweepstakes—and the
level of interaction to measure their effects on purchase intention.
The model used in this research (Fig. 1) is an adaptation of a
conceptual framework proposed by Bond (2010), which analyzes a relationship
between social media participation/engagement and behavioral outcomes,
such as purchased intention. Bond (2010) applies the Use-and-Gratification
theory (Calder et al., 2009) to explain behavioural outcomes as a result of
social media engagement, and addresses the following behavioral outcomes:
“Brand Awareness”, “Satisfaction with Social Media”, “Word of Mouth” and
“Purchase Intention”. The model for this research uses only “Purchase
Intention”, as behavioral outcomes.
Based on the literature review, six hypotheses have been developed
(Fig. 1). For the primary aim of the research, five hypotheses are proposed in
order to test whether the dependent variable of purchase intention will be
positively affected by the independent variables relative to four different
activities (i.e., types of content) and also by the level of engagement within the
Facebook brand community. To test whether members of Facebook brand
community pages residing in Portugal and in the United States respond
differently to the type of engagement content referred to in the five
Fig. 1—Adapted conceptual framework (Bond, 2010): Relationships between content type and purchase intention, and between level of interaction and purchase intention.
3.1. Hypotheses
Based on the literature review, six hypotheses have been developed for
this research.
It is well known that most consumers rely on social media to find
information and to stay current with brands’ products and promotion
campaigns (Mangold & Faulds, 2009). As a result of such an engagement
approach, consumers feel more comfortable doing business with the brand
(Gordhamer, 2009). Therefore, hypothesis 1 states:
H1. Information about products on brand fan pages has a positive
impact on purchasing intention.
Financial reward–based marketing strategies, such as promotions, are
a way to build a stronger relationship between consumers and companies
INFORMATION ABOUT CORPORATION OR
PRODUCTS
PURCHASE INTENTION PRICE PROMOTIONS
GAMES
SWEEPSTAKES
LEVEL0' INTERACTION
H2 H3
H5
H6 H4 H1
ACTION
FACEBOOK PARTICIPATION & ENGAGEMENT
BEHAVIORAL OUTCOME
TYPE OF ENGAGEMENT CONTENT FOR RESIDENT IN PORTUGAL
(Lee, 2009). According to the study conducted by Mclaughlin and Lee (2004),
about one-third of the consumers who join social media brand community
pages do so to take advantage of promotions, such as discounts and coupons.
Therefore, hypothesis 2 states:
H2. Brand fan page promotions, such as discounts and coupons, have
a positive impact on purchasing intentions.
It is important for community fan pages to deliver interesting,
entertaining, and innovative content, such as games and sweepstakes, in
order to promote greater engagement among members of the brand
community (Jahn & Kunz, 2012).
Games are a powerful way to induce interaction within a fan page and
to influence customer behavior, ultimately contributing to customer satisfaction
and loyalty (Shang & Lin, 2013). These customers’ behavior will potentially
trigger purchase intentions. Therefore, hypothesis 3 states:
H3. Participation in brand fan page games has a positive impact on
purchasing intentions.
According to a study conducted by Bushelow (2012), sweepstakes were
the third main motivation for consumers to join a Facebook fan page, which
indicates the importance of this activity for increasing interaction and,
ultimately, purchase intention. Therefore, hypothesis 4 states:
H4. Participation in brand fan page sweepstakes has a positive impact
on purchasing intentions.
Consumers who have a considerable level of engagement with an
even when the quality of the products and services is below their initial
expectations (Bhattacharya & Sen, 2003). Therefore, hypothesis 5 states:
H5. A higher level of interactivity in an online brand community
positively affects purchasingintentions.
In order to compare the way members of Facebook brand community
pages residing in Portugal and the United States respond to the various types
of engagement content (i.e., information, promotions, participation in games,
participation in sweepstakes, and level of interactivity) referred to in the
previous hypotheses, we have formulated hypothesis 6:
H6. The content of Facebook brand community pages has a different
impact on the purchasing intentions of individuals residing in Portugal
compared to those in the UnitedStates.
4. M
ETHODOLOGYFor this study, empirical research was conducted using a quantitative
approach and a non-probabilistic convenience sampling method. The data for
this research was collected via an online survey with a self-administered
questionnaire.
4.1. Description and Justification of the Methods
Through this research, we intended to study the way Facebook users
residing in Portugal and the United States relate with brands on the Facebook
The primary aim of this research is to establish the impact on purchase
intentions of different types of consumer interaction (i.e., engagement
behavior) within Facebook brand community pages.
The secondary aim is to study whether the engagement content on
Facebook brand community pages has a different impact on the purchase
intention of individuals residing in Portugal versus in the United States.
4.2. Research Procedure
The data collected were processed and analyzed using the statistical
analysis program Statistical Package for the Social Sciences (SPSS)—version
21 for Mac.
The sample and the issues related to Facebook and Facebook brand
community page usage habits were characterized using absolute and relative
frequencies (in percentages). The mean and the standard deviation were
utilized for the characterization of the scale scores.
The data was tested for normality using Skewness and kurtosis
coefficients. According to West, Finch, & Curran (1995), for absolute values of
skewness and kurtosis below 3 and 7 respectively, normality of the data is not
violated. In this study, the highest value for skewness was 0.65, and for
kurtosis was 0.67, therefore data normality can be assumed.
The internal consistency or reliability of the scales was analyzed using
Cronbach’s alpha coefficient.
The Student’s t-test for independent samples was used in the
purpose of this test is to determine whether the means of two independent
samples are significantly different (Marôco, 2011).
Linear regression models were used to analyze the relations between
continuous variables. These models were chosen because they allow the
study of functional dependency relations between one or more independent
variables and one dependent variable (Marôco, 2011). The requirements for
use of linear regression models were verified through analysis of the graphical
representations of residuals (normality and homogeneity of variances) and
variance inflation factor (VIF) (multicollinearity).
A significance level of 5% was determined as the decision-making
threshold for the results of the statistical tests.
4.3. Questionnaire Design
Data for this research was acquired through a structured questionnaire
with closed-ended questions. Some of the survey questions were adapted
from previous studies (Jahn & Kunz, 2012; Lee, 2009; Wilimzig, 2011). Each
dimension includes various items presented with responses in a 5-point Likert
scale. The calculation of each sub-scale’s score was obtained from the mean of
the items that it comprises, and could vary between a minimum of 1 and a
Table 1—Measurement scales.
Information
(Information on Product).
Facebook Fan page improves the quality of my purchase decision. (1) Wilimzig (2011)
Using a Facebook Fan page gives me better knowledge (information) of the product. (2)
I find information provided by a Facebook Fan page to be relevant. (3)
Facebook Fan page enables me to make product comparisons. (4)
Given that I have access to a Facebook Fan page, I intend to invest my time and effort to learn more about the product through it. (5) I refer to a Facebook Fan page whenever I need information on companies or products. (6)
Promotion (discounts and savings coupons)
I am a member of a Facebook Fan page to try to get discounts or coupons (1)
Zaichkowsky (1994) I am a member of a Facebook Fan page because I enjoy getting deals (2)
Promotions on a Facebook Fan page is important (3)
Promotions on a Facebook Fan page is valuable (4)
Promotions on a Facebook Fan page is relevant (5)
Participation on Games
Games in a Facebook Fan page are fun (1) Zaichkowsky (1994) Games in a Facebook Brand Community page are exciting (2)
Games in a Facebook Brand Community page are pleasant (3)
Games in a Facebook Brand Community page are entertaining (4)
Participation on
Sweepstakes
Sweepstake in a Facebook Fan Page is fun (1) Zaichkowsky (1994) Sweepstake in a Facebook Fan Page is exciting (2)
Sweepstake in a Facebook Fan Page is pleasant (3)
Sweepstake in a Facebook Fan Page is entertaining (4)
Level of Interaction
(How often to you…)
Watch videos (1) Bushelow (2011)
View photos (2)
Write on the page’s wall (post) (3)
Comment (on posts, photos, videos) (4)
Share (posts, photos, videos) (5)
Participate in games/entertainment (6)
Participate in sweepstakes (contests) (7)
Purchase Intention
Facebook Fan Page affects my intention to make a purchase. (1) Wilimzig (2011)
I intend to make a purchase after searching product information in a Facebook Fan Page. (2)
Facebook Fan Page affects my choice of product. (3)
I intend to use Facebook Fan Page while making a purchase decision. (4) I am likely to purchase a product recommended on a Facebook Fan Page. (5)
Being a member of a Facebook Fan Page makes me more likely to purchase that brand. (6)
The questionnaire was administered through the Internet, using the
Qualtrics platform. This medium was considered to be a highly effective and
quick way to reach a larger number of respondents.
Before the final administration of the questionnaires, a pretest was
conducted on 10 people to certify if the questionnaire was well written and if
the questions were well understood by respondents. We realized that some
individuals were not familiar with the term Facebook brand community page,
but they understood the meaning of Facebook fan page, which is similar but
not quite a synonym for the term Facebook brand community page. Therefore,
on the questionnaire beside the term Facebook brand community page, we
added the term Facebook fan for brand in parentheses. In addition, we
provided an example in the second question, which was a “skip logic”
question: “Do you ‘Like’ any Facebook brand community page (Facebook fan
page for brand) (e.g., Nike, Chanel, Starbucks, etc.)?” Other minor
adjustments were also made to the final questionnaire.
For the final administration of the questionnaire, several methods were
used to encourage users of Facebook to take the survey. Data collection was
carried out in August 2014 for a duration of 15 days.
4.4. Target Population and Sampling Design
The population for this research are members of Facebook residing in
Portugal and in the United States, who have “liked” at least one Facebook
brand community page (Facebook fan page). The reason behind the decision
fact, that United States was the birthplace of Facebook, and it is still, with no
big surprise, the number one country in the world in numbers of Facebook
users (Social Baker, 2014). On the other hand, Portugal has historically shown
great aptitude to adopt the new technologies (Conde, 2013). And according to
the site Social Baker (2014), Portugal has 4.7134 million Facebook users,
which makes Portugal the 39th country with more users in the largest social
network in the world. Therefore, it seems valuable to compare Facebook users
from Portugal with Facebook users from United States, which is the number
one country in the world, in terms of Facebook users.
For this research, a convenience sample was used to collect data for
quantitative analysis using SPSS. For the Portuguese population, emails and
Facebook messages with a link to the Qualtrics online survey, were send, and
the Graduate Office of ISEG at Lisboa University, also sent emails to the
university database inviting students to take the survey. For the United States
residents, emails and Facebook messages with a link to the Qualtrics online
survey were also sent to invite recipients to take the survey.
4.5. Internal Consistency
The questionnaire includes seven dimensions related to users’ interaction
with Facebook brand community pages and to their purchase intentions toward
those brands’ products.
The internal consistency or reliability of the dimension was analyzed
using Cronbach’s alpha coefficient. According to Pestana and Gajeiro (2008),
the answers that results from differences between respondents (i.e., the
answers differ not because the questionnaire is confusing and leads to
differing interpretations, but because the respondents have different opinions).
The Cronbach’s alpha coefficient presented in Table 1, and according to
Pestana and Gajeiro (2008), lead to the conclusion that all dimensions register
high levels of internal consistency. Only the “level of Interaction” dimension
registered Cronbach’s alpha coefficient below 0.9, but above 0.8, signifying
good internal consistency. All other dimensions have Cronbach’s alpha
coefficient above 0.9, leading to the conclusion that they all have high levels of
internal consistency.
When analyzing the explained variance and unidimensional loadings,
with the exception of dimension “level of Interaction”, which shows an
explained variance of 56.7%, with three of the items with unidimensional
loadings below 0.70, all other dimensions have values of the explained
variance over 70% with all the corresponding items with unidimensional
loadings over 0.80 or 0.90. According to Maroco (2011), these values are
Table 2—Cronbach’s alpha coefficient, explained variance and unidimensional loadings of the dimensions. Items/Scales Cronbach’s alpha coefficient Explained variance Unidimensional loadings
Type of interaction (5 items) 0.936 79,68%
I like to meet people on a Facebook Brand Community page 0.876 I interact with people on a Facebook Brand Community page 0.914 I speak my mind and contribute on a Facebook Brand Community
page
0.929
I bring value to the network on a Facebook Brand Community page 0.904 I share and learn from others on a Facebook Brand Community page 0.838
Information (6 items) 0.918 71,33%
Facebook Brand Community page improves the quality of my purchase decision
0.819
Using a Facebook Brand Community page gives me better knowledge (information) of the product
0.871
I find information provided by a Facebook Brand Community page to be relevant
0.836
Facebook Brand Community page enables me to make product comparisons
0.856
Given that I have access to a Facebook Brand Community page, I intend to invest my time and effort to learn more about the product through it
0.849
I refer to a Facebook Brand Community page whenever I need information on companies or products
0.836
Promotions (5 items) 0.924 77,62%
I am a member of a Facebook Brand Community page to try to get discounts or coupons
0.824
I am a member of a Facebook Brand Community page because I enjoy getting deals
0.852
Promotions on a Facebook Brand Community page is important 0.899 Promotions on a Facebook Brand Community page is valuable 0.925 Promotions on a Facebook brand community page is relevant 0.901
Games (4 items) 0.965 90,67%
Games in a Facebook Brand Community page are fun 0.934 Games in a Facebook Brand Community page are exciting 0.960 Games in a Facebook Brand Community page are pleasant 0.961 Games in a Facebook Brand Community page are entertaining 0.954
Sweepstakes (4 items) 0.964 90,33%
Sweepstake in a Facebook Brand Community is fun 0.948 Sweepstake in a Facebook Brand Community is exciting 0.953 Sweepstake in a Facebook Brand Community is pleasant 0.960 Sweepstake in a Facebook Brand Community is entertaining 0.941
Level of Interaction (7 items) 0.868 56,68%
Watch videos 0.700
View photos 0.691
Write on the page’s wall (post) 0.857 Comment (on posts, photos, videos) 0.855 Sharing (posts, photos, videos) 0.843 Participate in games/entertainment 0.676 Participating in sweepstakes (contests) 0.605
Purchase Intentions (6 items) 0.950 80,04%
Facebook Brand Community page affects my intention to make a purchase
0.887
I intend to make a purchase after searching product information in Facebook Brand Community page
0.909
Facebook Brand Community page affects my choice of product 0.920 I intend to use Facebook Brand Community page while making a
purchase decision
0.900
I am likely to purchase a product recommended on a Facebook Brand Community page
0.886
Been a member of a Facebook Brand Community page makes me more likely to purchase that brand
5. D
ATAA
NALYSIS ANDR
ESULTS5.1. Sample Characterization
The sample comprises 400 individuals with a Facebook account and
who “liked” at least one Facebook brand community page, 212 (53.0%) of
which are from the United States and 188 (47.0%) from Portugal (Table 2).
The global sample predominantly comprises women (56.5%) and
individuals between the ages of 25 and 34 (25.5%) and between the ages of
15 and 24 (22.3%). With regard to education, there is a predominance of
participants who are college/university graduates (31.0%), with some others
being in college/university (25.3%) or high school or the equivalent (20.3%).
In the comparison between the samples from Portugal and the United
States, there are no statistically significant differences regarding gender (χ2(1)
= 0.201; p = 0.654), but there are differences in terms of age (χ2(4) = 46.571;
p < 0.001) and education (χ2(5) = 24.361; p < 0.001). With regard to age, the
Portuguese sample is younger, registering higher frequencies in the lower age
classes and lower frequencies in the higher age classes when compared to the
American sample. In general, the Portuguese participants have higher levels of
education. In fact, 56.4% of the Portuguese participants have a level equal to
or above college/university graduate, compared to 36.8% in the American
Table 3—Gender, age and education variables.
Variable Categories
Total (N = 400)
Portugal (n = 188)
United States (n = 212)
Chi-Square Test n (%) n (%) n (%)
Gender Male 174 (43.5) 84 (44.7) 90 (42.5) χ2
(1) = 0.201
p = 0.654 Female 226 (56.5) 104 (55.3) 122 (57.5)
Age 15–24 89 (22.3) 59 (31.4) 30 (14.2)
χ2
(4) = 46.571
p < 0.001 25–34 102 (25.5) 58 (30.9) 44 (20.8)
35–44 77 (19.3) 33 (17.6) 44 (20.8) 45–54 71 (17.8) 30 (16.0) 41 (19.3) 55 and over 61 (15.3) 8 (4.3) 53 (25.0)
Education High school or equivalent 81 (20.3) 32 (17.0) 49 (23.1)
χ2
(5) = 24.361
p < 0.001 Vocational/technical school 34 (8.5) 19 (10.1) 15 (7.1)
Some college/university 101 (25.3) 31 (16.5) 70 (33.0) College/university graduate 124 (31.0) 68 (36.2) 56 (26.4) Master’s degree (MS) 55 (13.8) 36 (19.1) 19 (9.0) Doctoral degree (PhD) 5 (1.3) 2 (1.1) 3 (1.4)
5.2. Descriptive Analysis
Table 3 shows the frequencies of responses to the questions regarding
time spent on Facebook.
Looking at the global sample, 31.0% spend between 1 and 3 hours per
week on Facebook, 27.3% between 4 and 7 hours per week, and 26.8% spend
8 or more hours per week. Only 15.0% spend less than 1 hour per week on
Facebook. Comparing the frequencies of users from Portugal and the United
States (χ2(3) = 10.119; p = 0.018), a higher percentage of participants from the
American sample spend 8 or more hours per week on Facebook and a lower
percentage spend less than 3 hours per week, demonstrating that American
participants devote more time to Facebook than do the Portuguese
participants.
Regarding the question of how long they have been a member of a
respondents from the two countries (χ2(4) = 2.587; p = 0.629). Most have
“liked” a Facebook brand community page for over 3 years (39.3%) or between
2 and 3 years (19.0%).
The American participants are more active than the Portuguese in their
visits to Facebook brand community pages, and the differences are statistically
significant (χ2(6) = 22.025; p = 0.001). Among the Americans, 30.6% do so at
least once per day, while among the Portuguese that percentage is 21.3%.
Globally, 26.3% visit a Facebook brand community page at least once per day,
and 21.5% do so several times per week.
As for the time spent on Facebook brand community pages, 57.5% of
participants spend less than 30 minutes per day, and 42.5% spend 30 minutes
or more per day.
In addition, there are significant differences between the samples from
the United States and Portugal (χ2(4) = 23,314; p < 0.001), with the Americans
spending more time on Facebook brand community pages than the
Portuguese. Among the Portuguese, 31.9% spend 30 minutes per day or
Table 4—Facebook usage frequency.
Variable Categories
Total (N = 400)
Portugal (n = 188)
United States (n = 212)
Chi-Square Test n (%) n (%) n (%)
How many hours per week do you spend on Facebook?
Less than 1 hour 60 (15.0) 33 (17.6) 27 (12.7)
χ2
(3) = 10.119
p = 0.018 1–3 hours 124 (31.0) 66 (35.1) 58 (27.4)
4–7 hours 109 (27.3) 52 (27.7) 57 (26.9) 8 or more hours 107 (26.8) 37 (19.7) 70 (33.0)
How long ago did you “like” your first Facebook brand community page?
Less than 6 months 72 (18.0) 33 (17.6) 39 (18.4)
χ2
(4) = 2.587
p = 0.629 6 months–less than 1 year 35 (8.8) 14 (7.4) 21 (9.9)
1 year–less than 2 years 60 (15.0) 31 (16.5) 29 (13.7) 2 years–less than 3 years 76 (19.0) 40 (21.3) 36 (17.0) More than 3 years 157 (39.3) 70 (37.2) 87 (41.0)
How often do you visit a Facebook brand community page that you “like”?
Multiple times a day 56 (14.0) 18 (9.6) 38 (17.9)
χ2
(6) = 22.025
p = 0.001 Once daily 49 (12.3) 22 (11.7) 27 (12.7)
A couple of times a week 86 (21.5) 40 (21.3) 46 (21.7) Once a week 51 (12.8) 27 (14.4) 24 (11.3) Every couple of weeks 60 (15.0) 20 (10.6) 40 (18.9) Monthly 68 (17.0) 46 (24.5) 22 (10.4) Never 30 (7.5) 15 (8.0) 15 (7.1)
On a daily basis, approximately how much time on average do you spend on a Facebook brand community page?
Less than 30 minutes 230 (57.5) 128 (68.1) 102 (48.1)
χ2
(4) = 23.314
p < 0.001 30 minutes–less than 1 hour 88 (22.0) 34 (18.1) 54 (25.5)
1 hour–less than 3 hours 56 (14.0) 23 (12.2) 33 (15.6) 3 hours–less than 5 hours 16 (4.0) 2 (1.1) 14 (6.6)
More than 5 hours 10 (2.5) 1 (0.5) 9 (4.2)
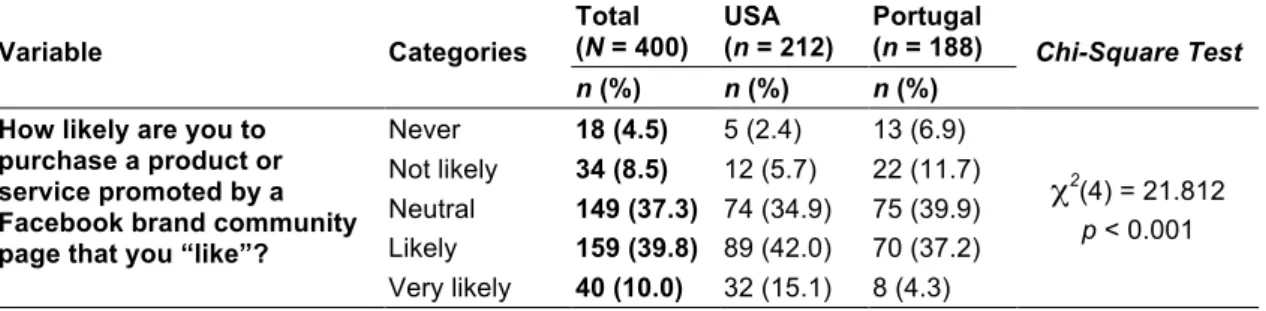
Participants were asked about their intention to purchase products or
services promoted by Facebook brand community pages: 48.8% consider it
likely or very likely, 13.0% responded that it is not likely or that they will never
do it, and 37.3% gave a neutral answer (Table 4). When comparing Portugal
and the United States, there are significant differences (χ2(4) = 21.812; p <
0.001), with 57.1% of Americans responding that it is likely or very likely,
Table 5—Purchase intention of a product or service promoted by a Facebook brand community page that they “like.”
Variable Categories
Total (N = 400)
USA (n = 212)
Portugal
(n = 188) Chi-Square Test
n (%) n (%) n (%) How likely are you to
purchase a product or service promoted by a Facebook brand community page that you “like”?
Never 18 (4.5) 5 (2.4) 13 (6.9)
χ2
(4) = 21.812
p < 0.001 Not likely 34 (8.5) 12 (5.7) 22 (11.7)
Neutral 149 (37.3) 74 (34.9) 75 (39.9) Likely 159 (39.8) 89 (42.0) 70 (37.2) Very likely 40 (10.0) 32 (15.1) 8 (4.3)
To assess the motivations that drove participants to “like” a Facebook
brand community page, a list of motivations was produced from which each
participant could select one or more (Table 5).
From the list of motivations presented, the most common answers
revealed that 56.5% of respondents wanted to know more about the company
and its products and services; 49.5% were interested in receiving price
promotions; and 44.0% love or are loyal users of the brand. Lower-ranking
motivations include participating in sweepstakes (32.5%), posting comments
(32.3%), interacting with other users (30.3%), and playing
games/entertainment (28.0%).
This trend is similar in both countries, but the percentages of
participants who indicated each of the motivations are always higher in the
American sample than in the Portuguese sample. The differences are only not
statistically significant for wanting to knowing more about the company and its
products and services (χ2(1) = 1.113; p = 0.292) but also for loving or being
loyal users of the brand (χ2(1) = 1.839; p = 0.175).
It is worth noting that 8.3% indicated “other motivations” for liking a
larger (χ2(1) = 14.590; p < 0.001) for the Portuguese sample (13.8%) than for
the American sample (3.3%).
Table 6—Motivations that led respondents to “like” a Facebook brand community page.
Answers
Total (N = 400)
USA (n = 212)
Portugal
(n = 188) Chi-Square Test
n (%) n (%) n (%)
To participate in sweepstakes 130 (32.5%) 90 (42.5%) 40 (21.3%) χ2
(1) = 20.368; p < 0.001 To receive price promotions 198 (49.5%) 115 (54.2%) 83 (44.1%) χ2
(1) = 4.063; p = 0.044 To play games/entertainment 112 (28.0%) 70 (33.0%) 42 (22.3%) χ2
(1) = 5.636; p = 0.018 To post comments 129 (32.3%) 82 (38.7%) 47 (25.0%) χ2
(1) = 8.533; p = 0.003 To interact with other brand users 121 (30.3%) 79 (37.3%) 42 (22.3%) χ2
(1) = 10.518; p = 0.001 To know more about the
company/products/services 226 (56.5%) 125 (59.0%) 101 (53.7%) χ 2
(1) = 1.113; p = 0.292
Love the brand/brand loyal user 176 (44.0%) 100 (47.2%) 76 (40.4%) χ2
(1) = 1.839; p = 0.175
Other 33 (8.3%) 7 (3.3%) 26 (13.8%) χ2
(1) = 14.590; p < 0.001
The score of each sub-scale in the questionnaire was obtained from the
mean of the items that it comprises and could vary between a minimum of 1
point and a maximum of 5 points. Table 6 presents the mean (M) and standard
deviation (SD) of each scale in the global sample, in the Portuguese
sub-sample, and in the American sub-sub-sample, as well as the level of significance of
the Student’s t-test for comparison between the means of the two countries.
The scales with the highest mean scores were “Promotions” (M = 3.50;
SD = 0.95) and “Information” (M = 3.41; SD = 0.84), followed by “Games” (M =
3.20; SD = 1.09), “Sweepstakes” (M = 3.20; SD = 0.97), “level of Interaction”
(M = 3.20; SD = 0.95), and “Purchase Intentions” (M = 3.20; SD = 0.92). The
“Type of Interaction” scale was the one that registered the lowest mean (M =
The analysis of the mean scores by country and the results of the
Student’s t-test lead to the conclusion that, in the sub-sample of American
respondents, the mean scores were higher than those of the Portuguese
sample in all scales, with statistically significant differences in all cases.
Table 7—Scores of the scales in the global sample and by country.
Scale
Global
(N = 400)
Portugal
(n = 188)
USA
(n = 212) Student’s t-test M (SD) M (SD) M (SD)
Type of interaction 3.00 (1.07) 2.75 (0.96) 3.22 (1.12) t(398) = 4.510; p < 0.001
Information 3.41 (0.84) 3.31 (0.79) 3.50 (0.87) t(398) = 2.265; p = 0.024
Promotions 3.50 (0.95) 3.30 (0.88) 3.68 (0.97) t(398) = 4.012; p < 0.001
Games 3.20 (1.09) 2.92 (1.05) 3.45 (1.06) t(398) = 4.995; p < 0.001
Sweepstakes 3.20 (0.97) 2.95 (0.87) 3.42 (1.00) t(398) = 4.943; p < 0.001
Level of Interaction 3.20 (0.95) 2.92 (0.87) 3.44 (0.96) t(398) = 4.704; p < 0.001
Purchase intentions 3.20 (0.92) 3.03 (0.86) 3.35 (0.95) t(398) = 3.400; p = 0.001
M: mean; SD: standard deviation
5.3. Regression models
Linear regression models were constructed in order to validate or refute
the research hypotheses. The choice for these models was due to the fact that
they allow the study of functional dependency relations between one or more
independent variables and one dependent variable (Marôco, 2011).
With regard to the requirements for the use of linear regression models,
the normality of residuals distribution was verified through observation of the
standardized residual histograms and normal probability plots. The
requirement of normality of residuals was met in all models constructed, with
the histograms presenting a shape relatively close to the normal curve and the
normal probability plot points showing no major deviations from the main
homogeneity of variances of residuals was verified through observation of the
dispersion diagram of observed values versus predicted values. In all
regressions, the plots show that residuals remain constant in relation to the
horizontal zero axis, displaying no increasing or decreasing trends and
confirming the requirement of homogeneity of variances of residuals. In order
to diagnose possible multicollinearity problems in the independent variables of
the regression models, the variance inflation factor (VIF) values were
analyzed. All regression models registered VIF values below 2, ensuring the
absence of multicollinearity problems in the independent variables (Marôco,
2011).
5.4. Hypotheses Testing
Regression analyses were conducted to test all of the hypotheses, in
which the dependent variable was “Purchase Intentions” and the independent
variables were “Information,” “Promotions,” “Games,” “Sweepstakes,” and
“Level of Interaction.” The hypotheses were tested in the overall (global)
sample (Table 7) and separately in the Portugal (Table 8) and USA (Table 9)
sub-samples.
The regression analysis is statistically significant (F(5; 394) = 175.135; p
< 0.001) and explains 69.0% (R2 = 0.690) of the variability in the “Purchase
Intention” variable.
In this regression analysis, the “Information” variable (β = 0.625; p <
0.001) is the one with the greatest influence on “Purchase Intentions.” The
variables also have a statistically significant influence on the “Purchase
Intentions” variable, but to a lower degree than does the “Information” variable.
The “Sweepstakes” (β = 0.061; p = 0.126) and “Level of Interaction” (β =
0.026; p = 0.460) variables have no statistically significant influence on
“Purchase Intention.”
Table 8—Results of the regression model (global sample).
Unstandardized Coefficient
Standardized
Coefficient Student’s t-test
B Stand. Error β t p
Constant −0.186 0.122 −1.528 0.127
Information 0.688 0.043 0.625 16.148 < 0.001
Promotions 0.156 0.037 0.160 4.171 < 0.001
Games 0.070 0.033 0.082 2.103 0.036
Sweepstakes 0.058 0.038 0.061 1.534 0.126
Level of Interaction 0.026 0.035 0.026 0.740 0.460
Model
Dependent variable: Purchase Intention R = 0.830; R2 = 0.690
F(5; 394) = 175.135; p < 0.001
In regard to the sample of Portugal, the regression analysis is
statistically significant (F(5; 182) = 62.626; p < 0.001) and explains 63.2% (R2
= 0.632) of the variability in “Purchase Intention.”
As in the overall sample, in the sample of Portugal, the variable
“Information” (β = 0.583; p < 0.001) also shows the greatest influence on
“Purchase Intentions.” In this case, the variable “Sweepstakes” (β = 0.162; p =
0.012) and the variable “Promotions” (β = 0.127; p = 0.030) also have a
significant influence on the “Purchase Intention.” The variable “Games”
(β = 0.018; p = 0.769) and the variable “Level of Interaction” (β = 0.048; p =
It is also important to note that the variable “Sweepstakes” in the
sample of respondents from Portugal has a significant effect on “Purchase
Intentions,” unlike the variable “Games,” which has no significant effect on
“Purchase Intentions.” This is opposite of the findings for the global sample.
Table 9—Results of the regression model (Portugal sample).
Unstandardized Coefficient
Standardized
Coefficient Student’s t-test
B Stand. Error β t p
Constant −0.140 0.196 −0.713 0.477
Information 0.637 0.064 0.583 9.939 < 0.001
Promotions 0.124 0.057 0.127 2.181 0.030
Games 0.015 0.050 0.018 0.294 0.769
Sweepstakes 0.160 0.063 0.162 2.523 0.012
Level of Interaction 0.047 0.053 0.048 0.895 0.372
Model
Dependent variable: Purchase Intentions R = 0.795; R2 = 0.632
F(5; 182) = 62.626; p < 0.001
In regard to the sample of U.S. respondents, the regression analysis is
also statistically significant (F(5; 206) = 109.002; p < 0.001) and explains
72.6% (R2 = 0.726) of the variability in “Purchase Intentions.”
As per this sample (U.S.), the variable “Information” (β = 0.670; p <
0.001) shows the greatest influence on “Purchase Intentions.” The variable
“Promotions” (β = 0.189; p < 0.001) and the variable “Games” (β = 0.114; p =
0.022) also have a significant influence on the variable “Purchase Intentions,”
but to a lower degree. The variable “Level of Interaction” (β = −0.018; p =
0.709) and the variable “Sweepstakes” (β = −0.012; p = 808) have no
Table 10—Results of the regression model (U.S. sample).
Unstandardized Coefficient
Standardized
Coefficient Student’s t-test
B Stand. Error β t p
Constant −0.158 0.165 −0.958 0.339
Information 0.733 0.060 0.670 12.165 < 0.001
Promotions 0.186 0.050 0.189 3.725 < 0.001
Games 0.103 0.045 0.114 2.309 0.022
Sweepstakes −0.011 0.047 -0.012 -0.243 0.808
Level of Interaction −0.018 0.048 -0.018 -0.373 0.709
Model
Dependent variable: Purchase Intentions R = 0.852; R2 = 0.726
F(5; 206) = 109.002; p < 0.001
Comparing the findings of the samples of Portugal and the United
States, we can conclude that in both samples the “Information” and
“Promotions” variables have a significant effect on “Purchase Intentions,” with
“Information” being most significant. Also, in both samples the variable “Level
of Interaction” has no significant effect on “Purchase Intentions.” However,
there are differences between the two country samples in the variables
“Games” and “Sweepstakes”: the variable “Games” has a significant effect on
“Purchase Intentions” in the U.S. sample but not in the Portugal sample, and
the opposite happens with the variable “Sweepstakes,” which has a significant
influence on “Purchase Intentions” in the Portugal sample but not in the U.S.
sample.
It is also noteworthy to mention that the independent variables
(information, promotions, participation in games, participation in sweepstakes,
and level of interactivity) considered in the regression analysis are better able
to explain the “Purchase Intention” variable in the U.S. sample (R2 = 0.726)
6. C
ONCLUSION ANDF
URTHERI
MPLICATIONS OF THES
TUDY6.1. Discussion
The findings of this research offer several interesting insights on the
relationship between different contents on Facebook brand community and
purchase intentions. The findings indicate that, there is strong evidence that
information on Facebook brand community leads to a positive effect on
purchase intention. There is also evidence that promotions may have a
positive effect on purchase intention for the global samples.
Although some previous research (e.g. Arnett et al., 2003; Animesh et
al., 2011) indicate a direct relationship between interaction on social media
and purchase intention, the result of this study does not support the notion that
an individual who has a high level of interaction with a Facebook brand
community page is more likely to purchase goods or services of that brand.
But, this result is consistent with the findings of Bushelow (2012), who
suggests there is no strong evidence that the amount of time an individual
interacts with a Facebook fan page affects brand loyalty or the likelihood that
an individual will purchase the product or service promoted by a fan page.
This study also provides insight into the question of whether there are
significant differences between Facebook brand community members residing
in Portugal versus in the United States. The results for both groups indicate
that information and promotion on Facebook brand community pages have a
It is interesting to note the differences between the two groups.
Participation in games has a significant effect on purchase intention for
individuals residing in the United States, but not for those residing in Portugal.
The opposite is true for participation in sweepstakes; it has a significant
influence on purchase intention for the residents of Portugal but not for the
residents of the United States.
6.2. Academic Implications
This study diverges from studies (e.g. Arnett et al., 2003; Animesh et
al., 2011) that indicate that higher level of customer engagement in the social
media context has a positive impact on purchase intention, thus supporting the
findings of Bushelow (2012). Therefore, more research is encouraged to
investigate relationship between high level of interaction and purchase
intention.
The findings that, there is a strong evidence that information on
Facebook brand community leads to a positive effect on purchase intention,
confirms the findings of Malmivaara (2011), which is also consistent with
Mclaughlin and Lee (2004) findings, that more than half of consumers join
brand communities looking for information. The evidence that promotions may
have a positive effect on purchase intentions for the global samples is also
6.3. Practical Implications
This research confirms the importance of information on Facebook
brand community pages and its effects on purchase intention, indicating that
marketers should start to pay more attention to the high-quality information on
companies’ Facebook brand community page. Therefore, Facebook brand
community pages can be an effective communication tool for brands to reach
their consumers.
According to Tiago and Verissimo (2014), business should embrace
social media as part of their integrated communication system, as a channel to
connect with stakeholders, and provide information to customers, that
ultimately will generate sales.
6.4. Limitations
This study has some limitations related to the convenience sample of
the researcher’s classmates, who were Facebook members and personal
contacts of the researcher and his friends. This could imply selection bias and
lack of representativeness. When studying the two countries separately, we
must take in consideration two important differences in the demographics of
the two countries, the age group and the education level (Table 2). With regard
to age, the Portuguese sample is younger, when compared to the American
sample. And as far has the education, in general, the Portuguese participants
have higher levels of education. In fact, 56.4% of the Portuguese participants
in the American sample. Therefore, the generalization for findings that indicate
differences and, or similarities of the two groups cannot be assumed.
Although the findings of this research can provide marketers with a
good indication of the importance of the different content on a Facebook brand
community page, generalization cannot be assumed.
6.5. Future Research
For future research on this interesting topic, the distribution of the
survey should target a more random and diverse population of Facebook
users. And in order to better understand the differences between user of
Facebook of Portugal and United States, a more uniform sampling of both
countries should be consider. It also may be beneficial to utilize qualitative
7. R
EFERENCES ANDB
IBLIOGRAPHYAmerican Marketing Association. (2013). No Title. American Marketing Assosiation. Retrieved November 11, 2013, from
http://www.marketingpower.com/_layouts/dictionary.aspx?dLetter=p
Animesh, A.P., Yang, S.B. and Oh, W. (2011), An odyssey into virtual words: exploring the impacts of technological and spatial environments on intention to purchase virtual products, MIS Quarterly, 35 (3), 780-810.
Arnett, D.B., German, S.D. and Hunt, S.D. (2003), The identity salience model of relationship marketing success: the case of non-profit marketing, Journal of Marketing, 67, 89-105.
Berthon, P. R., Pitt, L. F., Plangger, K., & Shapiro, D. (2012). Marketing meets Web 2.0, social media, and creative consumers: Implications for international
marketing strategy. Business Horizons, 55(3), 261–271. doi:10.1016/j.bushor.2012.01.007
Bhattacharya, C. B., & Sen, S. (2003). Consumer-company Identification: A
framework for understanding consumers ’ relationships with companies. Jornal of Marketing, 67(April), 76–88.
Bond, C. (2010). Engagement with social media and outcomes for brands: A
conceptual framework. In ANZMAC 2010 (pp. 1–8). Melbourne. Retrieved from http://anzmac2010.org/proceedings/pdf/anzmac10Final00478.pdf
Bushelow, E. E. (2012). Facebook pages and benefits to brands. The Elon Journal of
Undergraduate Research in Communications, 3(December 2011), 5–20.
Calder, B., Malthouse, E., Schaedel, U., 2009. An experimental study of the
relationship between online engagement and advertising effectiveness. Journal of
Interactive Marketing, 23(4), 321-331.
Conde, R. M. (2013). A relação entre os utilizadores e as marcas no facebook: TMN e
Vodafone em estudo. Universidade Católica Portuguesa.
Cotte, J., Chowdhury G., T., S., R., & Ricci, L. M. (2006). Pleasure or utility? Time planning style and web usage behaviors. Journal of Interactive Marketing, 20(1), 45–57. doi:10.1002/dir.20055