THE ROLE OF VENTURE CAPITALISTS IN THE IDENTIFICATION AND MEASUREMENT OF INTANGIBLE ASSETS
Leonardo L. Ribeiro*, FGV Business School Luis Fernando Tironi, IPEA
October, 2006
ABSTRACT
The increase in the importance of intangibles in business competitiveness has made investment selection more challenging to investors that, under high information asymmetry, tend to charge higher premiums to provide capital or simply deny it. Private Equity and Venture Capital (PE/VC) organizations developed contemporarily with the increase in the relevance of intangible assets in the economy. They form a specialized breed of financial intermediaries that are better prepared to deal with information asymmetry. This paper is the result of ten interviews with PE/VC organizations in Brazil. Its objective is to describe the selection process, criteria and indicators used by these organizations to identify and measure intangible assets, as well as the methods used to valuate prospective investments. Results show that PE/VC organizations rely on sophisticated methods to assess investment proposals, with specific criteria and indicators to assess the main classes of intangible assets. However, no value is given to these assets individually. The information gathered is used to understand the sources of cash flows and risks, which are then combined by discounted cash flow methods to estimate firm's value. Due to PE/VC organizations extensive experience with innovative Small and Medium-sized Enterprises (SMEs), we believe that shedding light on how PE/VC organizations deal with intangible assets brings important insights to the intangible assets debate.
1 - Introduction
During the last 25 years intangible assets (i.e., human capital, organizational capital and intellectual property rights) have surpassed tangible assets (i.e., physical and financial assets) as the most relevant value drivers for companies in the competitive environment (Lev, 2001). However, intangible assets are hard to identify and measure (Litan and Wallison, 2003), thus imposing high information asymmetry for innovative firms in general and the special segment of small and medium-sized enterprises (SMEs) in particular. When faced with uncertainties about the true value of a company, financiers tend to require higher costs to provide capital, making credit and specially equity prohibitively expensive for innovative SMEs (Botosan, 1997), with a negative impact in the efficient allocation of capital in the economy (Blair et al., 2001).
Trying to solve this problem, policy makers and regulators have been devising non-financial indicators that proxy for intangible assets (Blair et al., 2001). But the validity and usefulness of these indicators have not yet been fully tested. On the other hand, academics are performing several tests on the predictive
*
Leonardo L. Ribeiro; FGV Business School – Center for PE/VC Research, Av. 9 de Julho, 2029, 11th floor, Sao Paulo, SP, 01313-902, Brazil; (T) +55 11 3281-3459; (F) +55 11 3284-1789; [email protected].
power of financial indicators of innovation input (e.g., R&D expenditure) and both financial and non-financial indicators of innovation output (e.g., patents, percent of sales derived from new products) on performance measures (Rosenbuch et al., 2006).
Several studies have shown that, due to the lack of reliable drivers, investment analysts are: (i) relying on a few financial indicators (e.g., R&D expenditure) to estimate the innovativeness of the firms and its value (Ballardini et al. 2005); (ii) responding favorably to increases in non-financial indicators such as patents and market share (Mavrinac and Siesfield, 1998); (iii) reading the signals sent by the financial decisions of innovative company, which reveal the quality of their business, such as private equity placement announcements (Janney and Folta, 2003). However, most works have relied on listed companies and stock market investors. As one should expect, firms with the most severe information asymmetries do not even have access to the stock markets.
In order to identify what we believe to be the most relevant indicators of intangible assets for innovative SMEs, we recur to the new breed of financial intermediaries specialized in the selection and monitoring of non-listed innovative firms (Amit et al., 1998), the Private Equity and Venture Capital (PE/VC) organizations. This segment, which attracted huge sums of money during the Internet bubble, has accumulated many years of experience working with high growth companies (Gompers and Lerner, 2002). For each investment made, PE/VC organizations usually go through 100 business plans (Wright and Robbie, 1996). Furthermore, investment in unlisted SMEs is highly illiquid and requires active and attentive monitoring (Sahlman, 1990). Consequently, one should find experienced VCs as an important repository of sophisticated techniques for identifying and measuring intangible assets.
While there is a burgeoning literature on the selection process and criteria used by PE/VC organizations, with important contributions from Wells (1974), Tyebjee and Bruno (1984), MacMillan et al. (1987), Sandberg et al. (1988), Hisrich and Jankowicz (1990), Hall and Hofer (1993), Fried and Hisrich (1994) and Baum and Silverman (2004), none of the works approach the problem from the intangible asset measurement standpoint, nor present a comprehensive list of indicators used by the PE/VC industry in the identification and measurement of these assets.
The objective of this paper is to identify the process and criteria used by PE/VCs organizations to evaluate innovative SMEs. We interview a group of 10 organizations representative of the Brazilian PE/VC industry to obtain the financial and non-financial indicators used in the selection of portfolio companies, which have book-to-market varying from 2 to 10 (medium to large-sized business) and from 10 to 150 (smaller businesses in technology sectors). By asking information about portfolio companies individually, we gain insights on how development stage, industry sector and business strategy impact the assessment of intangible assets by PE/VC organizations.
Both the population and sample of VCs for this study are identified based on the Census of Private Equity and Venture Capital in Brazil ©, a survey performed by the Center for Private Equity and Venture Capital Research at Fundação Getúlio Vargas (GVcepe). Carvalho et al. (2006) present a complete description of this database.
subjective indicators of intangible assets are used to assess intellectual property rights and technology, human capital, relational capital (i.e., customer base and reputation) and organizational capital (i.e., innovativeness, internal processes and business model); (vi) due to the high subjectivity in human capital indicators, some managers rely on a more sophisticated framework to analyze human capital, which comprises top management, second-level substitutes, attraction of talented professionals and human capital management; (vii) smaller funds tend to specialize in terms of industries and regions as a mean to develop superior knowledge. On the other hand, bigger funds tend to have a broader focus and rely more on the quality and experience of the management team; (viii) PE/VC organizations do have a role in the identification and measurement of intangible assets, However, assets are not valued separately. They rather use the information on intangibles to better understand the sources of cash flows and risks. Firm or project valuation is done based on DCF and comparables methods.
2 - Literature Review
2.1 - Intangible Assets
In the beginning of the 1980s, S&P 500 companies had market value similar to their book value. In the hype of the Internet Bubble (2000), their market-to-book ratio reached 6/1 (Lev, 2001). While this can be partly explained by a steep increase in the value of physical and financial assets, it has become evident that accounting procedures have lost sight over the most relevant values drivers of companies in the New Economy.
According to Blair et al. (2001), intangible assets are goods and rights that are neither physically or financially embodied Thus, they are hard to identify, measure and manage. Only when they are bought in the market, intangible assets can be somewhat recognized in financial reports and balance sheets. Litan and Wallison (2003) discuss why internally generated intangible assets are not considered by the generally accepted accounting principles (GAAP). Due to their heterogeneity, they cannot be easily bought and sold in organized markets. There is also a lack of objective assessment methods to value intangibles, which could be independently audited.
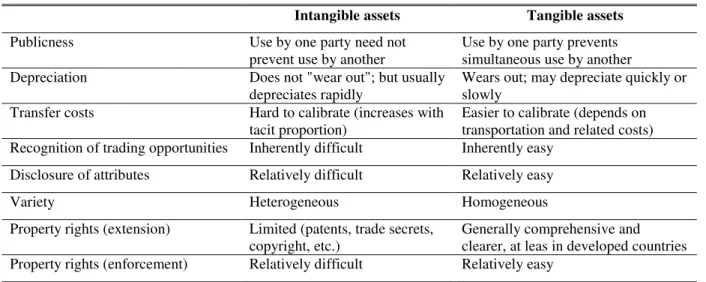
According to Teece (2000), tangible and intangible assets are different in terms of: publicness, depreciation, transfer costs, ease of recognition of trading opportunities, disclosure of attributes, variety, extension and enforcement of property rights. Table 1 summarizes their main differences.
Table 1 – Difference Between Intangible and Tangible Assets
Intangible assets Tangible assets
Publicness Use by one party need not
prevent use by another
Use by one party prevents simultaneous use by another Depreciation Does not "wear out"; but usually
depreciates rapidly
Wears out; may depreciate quickly or slowly
Transfer costs Hard to calibrate (increases with tacit proportion)
Easier to calibrate (depends on transportation and related costs) Recognition of trading opportunities Inherently difficult Inherently easy
Disclosure of attributes Relatively difficult Relatively easy
Variety Heterogeneous Homogeneous
Property rights (extension) Limited (patents, trade secrets, copyright, etc.)
Generally comprehensive and clearer, at leas in developed countries Property rights (enforcement) Relatively difficult Relatively easy
To Blair et al. (2001), the lack of appropriate measurement techniques of intangible assets has important impact in the economy: (i) errors in the national accounts (e.g., GDP); (ii) increased volatility in the price of financial assets; (iii) reduced investor confidence in the efficiency of markets; (iv) inefficient allocation of capital between industries; (v) inefficient allocation of capital within firms; (vi) difficulty in setting fair and efficient tributary policies.
Blair et al. (2001) employ property rights concepts and definitions to classify intangible assets in three categories: (i) those that can be owned and negotiated: intellectual property rights and contracts enforced by the law (e.g., patents, trademarks, copyrighted material, software codes, databases, customer base, agreements, licenses, franchises, production quotas, non-competing clauses with main executives); (ii) those that can be controlled but cannot be sold separately: organizational or structural assets (e.g., organizational culture, proprietary management processes, R&D processes, communication systems and innovativeness); and (iii) those that cannot be owned but can be influenced: human and relational capital (e.g., managerial ability, team cohesion, workers' specialized skills, consumer satisfaction, strategic alliances, reputation, relationship networks, as well as consumer perception of product and service quality).
According to Teece (2000), assets are not the solely source of value. Companies also vary in terms of its ability to intelligently articulate the use of its difficult to replicate intangible assets (e.g., competence and intellectual capital, reputation, brand and consumer relationship) to create sustainable competitive advantage. This ability is often called dynamic capability and is most often mastered by entrepreneurial companies with lean hierarchies, clear vision, well-delineated incentive structures and great autonomy of its departments and professionals. These companies can react more quickly to fast market changes.
2.2 - Beyond Balance Sheets and Financial Reports
Given the lack of accounting techniques to measure and value intangible assets, investors and other information users have three alternatives when faced with intangible-intensive companies: (i) estimate the economic impact of certain expenses (e.g., R&D expenditure) in the generation or enhancement of intangible assets (e.g., innovativeness), in the hopes that it will eventually gives firms competitive advantage (e.g., innovative products) to generate superior cash flows; (ii) monitor the evolution of non-financial indicators (e.g., market share, patent fillings) that may be linked to the critical success factors of a given industry; and (iii) read the signals sent by companies' financial decisions (e.g., announcement of a private placement).
The use of past financial information to estimate value creation is a common strategy used by market investors. Ballardini et al. (2005) employed meta-analysis to combine the coefficient of several independently estimated regressions. They have shown that market investors tend to react positively to increases in R&D expenditure.
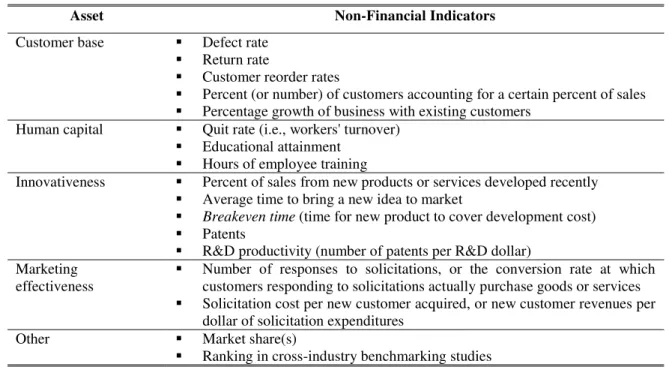
Table 2 – Intangible Assets and their Non-Financial Indicators
Asset Non-Financial Indicators
Customer base Defect rate
Return rate
Customer reorder rates
Percent (or number) of customers accounting for a certain percent of sales
Percentage growth of business with existing customers Human capital Quit rate (i.e., workers' turnover)
Educational attainment
Hours of employee training
Innovativeness Percent of sales from new products or services developed recently
Average time to bring a new idea to market
Breakeven time (time for new product to cover development cost)
Patents
R&D productivity (number of patents per R&D dollar) Marketing
effectiveness
Number of responses to solicitations, or the conversion rate at which customers responding to solicitations actually purchase goods or services
Solicitation cost per new customer acquired, or new customer revenues per dollar of solicitation expenditures
Other Market share(s)
Ranking in cross-industry benchmarking studies
Source: Adapted from Elliott (1992); Elliott and Jacobson (1994); PWC (2000); AICPA (2000); and Litan and Wallison (2003).
While there are numerous financial indicators to measure and monitor firm performance, Taylor (2000) shows that market investors are rather frustrated by the quality and quantity of non-financial information available to them. According to Coleman and Eccles (1997), market investors believe that companies have not been able to effectively report information on seven key indicators for investment decision-making: market share, workers' productivity, new product development, customer relationship, quality of services and products, R&D productivity and intellectual property.
Given the lack of sufficient information to identify and assess intangible assets, be it through financial expenses, or non-financial indicators, investors may resort to a third strategy: read the signals sent by the company in its major financial decisions. This technique is especially useful for companies that heavily rely on intangible assets to create value (e.g., companies in the biotechnology, software and high-tech sectors). These companies would be reluctant to disclose information on their intangible assets for fear that their competitors would use it against them (Deeds et al., 1997). Thus, signaling may be an interesting strategy for SMEs in technological industries that face higher cost of capital (Teece, 1996).
Companies that generate most of its value from intangible assets tend to face greater difficulty to convey its intrinsic value to the market. Gu and Wang (2005), show that analysts tend to make more mistakes when trying to predict earnings of companies that have higher than average proportion of intangible assets than the industry's average, especially when technology-based1 intangible assets are new and unique. This information asymmetry has a perverse effect in cost of capital (Botosan, 1997), preventing companies with potentially good projects to receive funding. Two problems emerge: (i) adverse selection: faced by high information asymmetry investors require higher expected returns to provide capital. This drives good companies to look for alternative means of financing. Only the worst companies are willing to pay high prices to raise capital; (ii) moral hazard: due to high cost of capital, entrepreneurs may take more risks. Also, knowing that investors do not have the necessary skills to effectively monitor the use of resources, entrepreneurs may act opportunistically.
2.3 - Venture capital: investment process and screening criteria
Between early 1980s and late 1990s, a new and important segment of the capital markets quickly evolved to become one of the most relevant catalysts of business creation and renewal in the U.S.: the Private Equity an Venture Capital industry. It is important to recognize that this growth occurred simultaneously with the increase in the relative value of intangible assets. Similar to the U.S., Europe and several emerging markets, Brazil has a PE/VC industry, which is composed of 65 financial intermediaries (i.e. PE/VC organizations) with US$ 5.07 billion under management. Their aim is to finance non-listed companies with relevant growth opportunities (Carvalho et al., 2006).
PE/VC is an alternative source of capital to companies that are not fully served by credit or public equity markets. Since PE/VC organizations are active in the screening and monitoring of their investment, they tend to better mitigate the inherent risks of companies that lack financial history and have few or no tangible assets to be offered as collateral.
After careful screening of investment proposals (i.e. business plans), PE/VC managers negotiate the price and the conditions for the investment, which takes place in the form of shares, convertible debt and options. After a few years of monitoring and value adding, the PE/VC organization seeks to liquidate its holdings by offering their shares of portfolio companies in the stock market or to strategic buyer seeking to integrate the company with its operation. While they are less attractive, other exit mechanisms (e.g., share buybacks and secondary sales) may take place. At the end of the investment cycle, the objective is to return capital back to investors with capital gains.
PE/VC investment can be grouped according to the development stage of portfolio companies. Venture Capital (VC) usually refers to investment in early-stage companies (e.g., seed capital and start-ups). These are usually made in innovative SMEs operating in software, biotechnology, IT and other high-tech industries. Private Equity (PE) refers to the whole class of non-listed investments, but can also designate buyout type of investment directed to more developed companies.
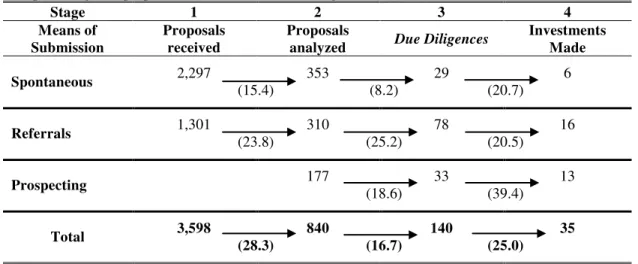
Each year, PE/VC organizations receive hundreds of investment proposals. After a diligent screening process, only around 1% receive funding (Wright and Robbie, 1996). In a recent survey, the same ratio was found in Brazil (Carvalho et al., 2006), as it can be seen in Table 3. The selectiveness of these investments is mainly due to its illiquid nature. Once the money is invested, a few years may pass by before an exit takes place. It is common to have PE/VC investments maturing in between three to ten
1
years. It means that a wrong investment choice will most likely result in the loss of capital and/or a conflicting relationship with the entrepreneurial team.
Table 3 – Project Selection rates in PE/VC in Brazil
Number of proposals (e.g. business plans) received, by means, number of proposals thoroughly analyzed, number of proposals undergoing due diligence and number of investments done in 2004 in Brazil for the universe of 71 PE/VC organizations with offices in the country. Figures in parentheses are percentages of proposals that moved from one stage to the next.
Stage 1 2 3 4
Means of Submission
Proposals received
Proposals
analyzed Due Diligences
Investments Made
Spontaneous 2,297 353 29 6
(15.4) (8.2) (20.7)
Referrals 1,301 310 78 16
(23.8) (25.2) (20.5)
Prospecting 177 33 13
(18.6) (39.4)
Total 3,598 840 140 35
(28.3) (16.7) (25.0)
Source: Carvalho et al. (2006)
While PE/VC investments are extremely risky, PE/VC expected returns are sensibly higher than stock market's. The quest for returns starts when PE/VC managers look for companies whose growth opportunities justify the high screening and monitoring costs of PE/VC investments. Thus, the ability to identify future winners is a key success factor in the PE/VC industry. Microsoft, Compaq, Fedex, Apple, Sun, Amazon, Lotus, Cisco, Staples, Netscape, eBay, JetBlue, Intel, Amgen, Medtronic, Oracle and Google are a few PE/VC success cases that emerged when the U.S. PE/VC pool was no greater than 1% of the country's GDP.
As Kortum and Lerner (2000) show, PE/VC investments have a positive impact on innovation. The authors examined the influence of PE/VC in the number of patent fillings in the U.S., in 20 different industries for a period of 30 years. Results suggest that PE/VC investments are strongly correlated to the number of patent fillings. Also, PE/VC might be responsible for financing 8% of all innovation occurred in the 1983-1992 period, while it represented no more than 3% of U.S. R&D expenditure.
The extensive experience of PE/VC organizations in the screening and monitoring of companies with the above mentioned characteristics suggest that the PE/VC industry has developed superior processes and techniques to identify, measure, value and monitor intangible assets. According to Amit et al. (1998), PE/VC organizations are well suited to handle problems that stem from high information asymmetry, like hidden information (that generate adverse selection problems) and hidden action (which implies moral hazard). Due to learning effect, PE/VC managers benefit exponentially from the great number of business analyzed (Hall and Hofer, 1993). Thus, it is expected that PE/VC managers screening and monitoring skills get better with the number of analysis and deals closed.
Fried and Hisrich (1994) identify 15 selection criteria and group them in three categories: concept, management and financial return. Concept refers to the overall strategy of the business and the business model itself. Management is synonymous with human capital in general and top management team in particular. Return refers to the possibility to realize a high return on investment (ROI) by selling the shares with a gain within the appropriate timeframe. It is noteworthy recalling that PE/VC is a temporary sort of investment. Table 4 shows a complete listing of these criteria.
Table 4 – Selection Criteria Used by PE/VC Organizations
Category Selection Criteria
Concept Earnings growth potetial due to:
o Market growth
o Increasing market share o Significant cost cutting
Innovation that works already or can be brought to market within three years
Substantial competitive advantage or be in a relatively non-competitive industry
Reasonable capital requirements
Management Personal integrity
Success in prior jobs
Ability to identify risks and develop plans for dealing with these risks
Hardworking
Flexibility
Thorough understanding of the business
Lidership in good times but also under extreme pressure
General management experience
Returns Provide exit opportunity
Potential for a high rate of return
Potential for a high absolute return
Source: Adapted from Fried and Hisrich (1994)
To assess selection criteria with care and minimize information costs, the selection process usually employed by PE/VC organizations can be described as in Figure 1. According to Fried and Hisrich (1994), the process is divided in six stages and takes an average of 97 days to be completed (with a standard-deviation of 45 days). A total of 130 working hours (with a standard-deviation of 100 hours) is consumed. However, the use of both financial and non-financial resources with trips, market researches, audits and so on is gradually increased as target-companies advance further into the selection process. Likewise, the likelihood of receiving investment also increases.
The first stage is called origination. Business plans get to PE/VC organizations spontaneously, through referrals, or are actively prospected by PE/VC managers. While spontaneous candidacy is usually the source of most proposals, it is considered as low quality source, that generates few investments (Carvalho et al., 2006). Table 3 shows that only about 0,26% of spontaneous candidacies received by Brazilian PE/VC organizations in 2004 turned into investments that same year. PE/VC managers seem to prefer referrals, which appear with a success rate of 1,23% in Table 3. Those who present the PE/VC manager with an investment proposal tend to preserve their reputation. Moreover, referrals usually take into consideration the focus of the PE/VC organization in terms of industry, region and development stage.
To reach its objectives, the PE/VC organization is forced to get information with both the entrepreneurial team and external sources, in order to combine them with available information to obtain a clearer view of the business model and the people running the business. Normally, managers get in touch with clients (actual and prospective ones), market specialists and other portfolio entrepreneurs to verify the perceived quality and value of the company's products and services. Market research may be used. For the technology due diligence, consultants and technology business partners may be used. Financial projections made by the entrepreneurial team are also analyzed. It is the opportunity to verify if the entrepreneurs understand their business as well as its main threats and opportunities.
The second phase starts with PE/VC managers getting emotionally attached to the business idea and the team (Fried and Hisrich, 1994). Assessment continues, but the time spent in assessment activities increases dramatically. From now on, the focus is on finding deal breakers and ways to avoid them.
The closing of the investment starts when the legal and financial structure is detailed in the term sheet. Despite all effort, a great number of proposals are still rejected at this point. According to Fried and Hisrich (1994), there is still a 20% failure rate in the closing phase. Carvalho et al. (2006) show that this figure is sensibly higher in Brazil, where only 25% of due diligences performed in 2004 generated investments in the same year.
Figure 1 – Venture Capital Investment Process
ORIGINAT ION VC FIRM-SPECIFIC
SCREEN
GENERIC SCREEN
FIRST-PHASE EVALUAT ION
SECOND-PHASE
EVALUAT ION CLOSING
REJECTED Investment
Proposal
Investment Proposal
Source: Fried and Hisrich (1994)
3 - Method
This work is an exploratory study of the process, techniques and criteria employed by PE/VC organizations in Brazil to identify, measure, value and monitor intangible assets in innovative SMEs. A series of ten interviews were performed with a group of individual PE/VC organization selected from the universe of 65 PE/VC organizations with offices in Brazil. The selection was made based on the experience of the organization with innovative SME investing (specially in the segments of IT and biotechnology). An effort was made to diversify the sample in terms of geographic location, industry and size.
Table 5 – Sample of Interviewed Organizations
Organization Headquarters Main investment focus
Axial Participações São Paulo SMEs with Sustainable business practices in the following
industries: functional foods, environmental technology services and biomass products.
Axxon Group Rio de Janeiro Medium-sized companies. No specific industry focus
CRP Companhia de Participações
Porto Alegre SMEs in the Southern Region. No specific focus
Eccelera São Paulo SMEs in the IT sector
e-platform São Paulo SMEs in the IT sector
FIR Capital Partners Belo Horizonte SMEs in the IT and biotechnology sectors
GP Investimentos São Paulo Broad focus
Jardim Botianico Partners (Fundo Novarum)
Belo Horizonte SMEs in the IT, biotech, new materials, eco-business, agribusiness and biotechnology
Rio Bravo Investimentos
São Paulo Focus in the following industries: services, logistics, IT, telecommunications, life sciences and new materials, regional development and cinema
Votorantim Novos Negócios
São Paulo Life sciences and IT
The interviews were conducted based on a structured questionnaire composed of four topics: (i) PE/VC organization and team profile and characteristics; (ii) investment portfolio; (iii) techniques and criteria to identify and assess intangible assets in the screening and monitoring phases; (iv) mechanisms and institutions that facilitate assessment of intangible assets.
Each interview took an average of 1h30. In eight organizations, only one manager was interviewed (five partners, two directors and one senior analyst). In one case, the two managing partners were interviewed in sequence. In yet another organization, CEO, COO and one analyst provided all information needed. A total of 13 professionals were met.
While there was a great deal of overlap between different interviews, we were able to identify am emphasize special techniques and criteria that seemed to be unique to each organization. This technique resulted in aggregated data that represent the best practices in each of the participating organizations.
4 - Results
4.1 - Origination of deals
Origination is the starting phase of the investment process for every PE/VC organization. Investment proposal are found by four different means: (i) spontaneous candidacy; (ii) referrals; (iii) active prospecting; and (iv) internal business development. Next, we discuss each mean separately:
In spontaneous candidacy, entrepreneurs bring investment proposals to the PE/VC managers directly. Telephone, mail, e-mail and online forms are used. Several organizations keep online forms to receive summarized business plans in a more standardized fashion. This allows for inter-firm comparison and reduction in the selection costs. Executive summary, a quick analysis of competitive advantages and a simplified financial statement are commonly asked for. Normally, the first item to be analyzed is the executive summary.
While spontaneous candidacy generates a lot of investment proposals, only a small portion ends up receiving any investment. A great number of organizations have never invested in proposals originated this way. The attraction of good investment proposals depends on the visibility (e.g., media presence) and the reputation the organization enjoys in the industry of preference.
Referrals
PE/VC organizations work to establish networks with professionals that are well informed about the organization's interests and preferences. These professionals usually provide PE/VC organizations with investment proposals that match fund's focus more precisely. Referrals are usually made by: (i) specialized service providers (e.g., advisors and M&A boutiques); (ii) banks; (iii) other PE/VC organizations (usually as co-investment opportunities); (iv) law firms; (v) auditors; (vi) board members related to the organization; (vii) funds' investors; (viii) portfolio companies' executives; (ix) alumni and former work collaborators. Where trustful relationship exists, the proposal success rate tends to be higher. Sometimes, PE/VC organization create incentives for good referrals by paying success fees.
Active prospecting
It is common for PE/VC organizations to procure market research and perform target-market monitoring to search for good investment opportunities. Managers then get in touch with the most attractive of those companies to present themselves, get more information and maybe schedule a first meeting. The active prospecting of PE/VC organizations in usually done by means of: (i) business magazines and newspapers; (ii) business directories (e.g., directory of biggest companies in Brazil); (iii) local newspapers from preferred areas; (iv) alumni associations; (v) industry associations; (vi) business incubators; (vii) research institutions (e.g. Fapesp); (viii) graduate courses in technological fields; (ix) databases (e.g. Serasa); (x) class associations; (xi) chambers of commerce; and (xii) governmental bodies to foster innovation and entrepreneurship: Endeavor, The Brazilian Small Business Administration (SEBRAE) and the Ministry of Science and Technology Finacing Arm (Finep); and (x) others sources. As one interviewee stated, we try look where our competitors are not looking at yet.
A different approach consists of performing market research analysis for the industries of interest. Companies that distinguish themselves from the crowd are contacted. However, since these companies were not looking for PE/VC investment, they often do not have a business plan to submit. The plan is usually constructed collaboratively while the process advances through the selection process.
Internal business development
To serve portfolio companies in a continuous basis and promote learning, several organizations tend to organize in such way that the manager responsible for the business origination will probably lead the screening, negotiation and structuring phases. He will also take responsibility for monitoring (e.g., acting as a board director). This practice allows the PE/VC manager to accumulate knowledge about the company and its market, allowing him to effectively monitor and ads-value by advising the company strategically.
To keep an organized history of deals, some organizations keep updated databases, allowing for the organization to assess the overall performance of the selection process and check whether any of the following variables impacts the success of the deal flow: (i) mean of origination (i.e., spontaneous candidacy, referrals or prospecting; (ii) source or referrer; (iii) research institute with which the business is related (especially in the case of technology ventures); and (iv) PE/VC manager who originated the deal. This database is also useful to keep track of contacts made with companies over time and register managers' opinions. It is common for each fund of the same organization to have its own database of deals.
4.2 - Selection process
Similar to the U.S. PE/VC industry, the Brazilian PE/VC organizations interviewed use a well-defined investment process to minimize the costs involved in the screening of investment proposal and maximize the chances of making good investment decisions. The process is composed of four main phases: (i) qualification; (ii) preliminary analysis; (iii) detailed analysis; and (iv) due diligence. The process allows the PE/VC organization to increase the screening costs gradually, as the investment proposal goes from one phase to the other. A great number of proposals are analyzed superficially (e.g., the executive summary is read) and only a handful of due diligences are made. To gather several points of view, the process is collaborative, including other PE/VC managers, an investment committee and a few specialized service providers (e.g., consultants, auditors, lawyers).
Qualification
At the first phase of the selection process, also called qualification phase, proposals that do not fit with the funds' focus (i.e., industry, size, development stage, geographic location, investment thesis and technology) are rejected. The remaining proposals are analyzed. As suggested by interviewees, the smaller the fund/organization, the more its focus can be precisely defined. Big funds would find it difficult, especially in a relatively small market such as in Brazil, to allocate all its resources within a specific industry or region.
Analysis
When the opportunity matches the fund's investment focus, managers start the analysis phase, which is divided into two: preliminary analysis and detailed analysis. Generally speaking, both phases share essentially the same selection criteria. However the depth of analysis increases significantly during the detailed phase. Another difference between the two phases is the emphasis on different criteria. While human capital is important thorough the whole process, competition analysis is more often performed during detailed analysis phase.
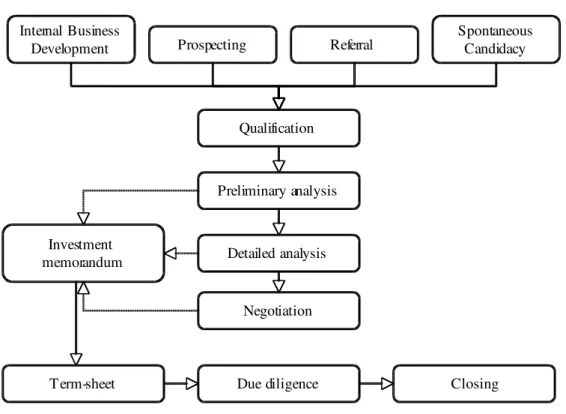
Figure 2 presents the selection process most often employed by organizations. It starts with the origination of deals (with four means) and passes through the qualification phase, analysis (preliminary and detailed) and due diligence. From the detailed analysis on, managers usually rely on the investment committee to get approval for the deal. The investment memorandum consolidates all relevant information obtained since the preliminary analysis. It eventually generates the term-sheet that is presented to entrepreneurs after a successful negotiation.
Figure 2 – PE/VC Investment Process
Qualification Internal Business
Development Referral
Preliminary analysis
Negotiation Investment
memorandum
Term-sheet Due diligence Closing
Spontaneous Candidacy Prospecting
Detailed analysis
4.2.1 - Preliminary analysis
The preliminary analysis is backed by information provided by the company (e.g., business plan and financial reports) and is complemented with market data and brief conversations with the entrepreneurial team and selected stakeholders. A quick visit to the company may take place. In this phase, PE/VC managers try to identify market attractiveness, understand its customers (actual and potential), identify risks and assess the management team. For bigger investments, an analysis of financial data and exit routes starts early in the process.
As a result of the preliminary analysis, a summarized document is generated (i.e., investment memorandum). The use of formal documents seems to be more common to PE/VC funds with a great number of shareholders and little discretion over investment decision-making.
subsequent phase. Sometimes, the entrepreneurs are invited to make a brief presentation to the investment committee. However, bigger funds or funds where managers have more discretion over investment decision-making, does not consult with the investment committee until latter in the process. As it can be seen, the preliminary analysis is already a collaborative task that aggregates the opinion of several collaborators with diverse backgrounds.
4.2.2 - Detailed analysis
The decision to enter the detailed analysis phase implies in a severe increase in the cost to assess intangible assets. To protect itself against a loss of these sunk costs, PE/VC managers may ask entrepreneurs to sign confidentiality and exclusivity agreements. While it gives entrepreneurs some protection over sensible information, it also protects the PE/VC organization by preventing the entrepreneurs from starting an auction with other investors, usually for a period of three months.
The detailed analysis is a very intense phase that lasts for two to four months. Sometimes, the business plan is rewritten in collaboration with entrepreneurs. While information is mostly obtained with the entrepreneurial team or their advisors (e.g., M&A boutiques), PE/VC managers start a stronger involvement with customers, suppliers and other stakeholders. Consultants are usually hired to perform specific tasks such as technology or business model assessment. At this stage, team, technology, market, financial projections and business model are the most relevant criteria. Risks and strategies to deal with them are carefully considered.
An internal due diligence may be performed, especially when PE/VC managers have prior auditing experience. The objective is to identify the most visible accounting, tributary and labor liabilities and contingencies. Paying special attention to informal business practices makes strong sense in a country where 40% of the economy is informal (World Bank, 2005). Also, PE/VC managers do rely on balance sheets to foresee the impact of a few accounts (e.g., receivables and deferred taxes) in future cash flow generation.
The contact with entrepreneurs increases significantly during the detailed analysis. At least one organization mentioned that part of the PE/VC team actually moves into the company's offices to perform all analysis. This approach has the advantage of making the PE/VC team get more socially involved with the entrepreneurial team and get a feeling of corporate and organizational climate. This makes subjective information be more easily obtained and confirmed. However, the greater involvement with target company executives may also affect the managers' critical view, making it vital to have other PE/VC managers taking part in the evaluation. The results determine whether the investment proposal will be presented to the investment committee for a final decision.
4.2.3 - Due diligence
Once the investment committee decides to go forward with the investment and the terms of investment have been thoughtfully discussed with the entrepreneurial team, a due diligence takes place to evaluate all contingencies and liabilities in the accounting, legal (i.e., key contracts, existence of licenses, regulatory impact), labor and environmental areas. Eventually, a technological due diligence or a business model assessment can be made.
by the company and successful due diligence that generates investment are paid by the PE/VC organization.
4.3 - Criteria and indicators of the screening process
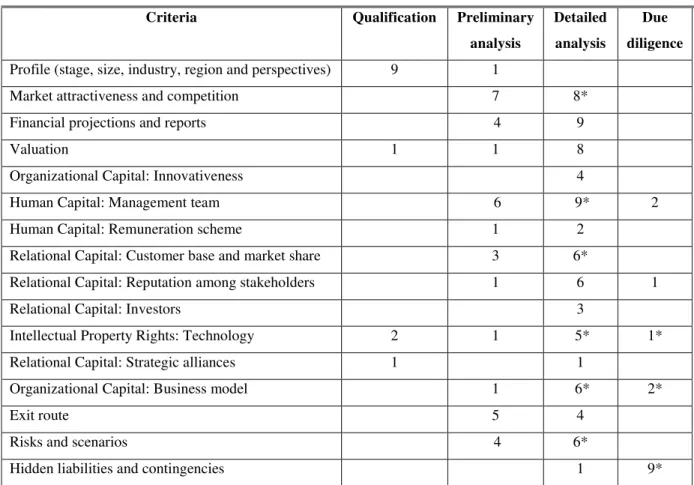
During the screening phase, PE/VC managers assess several aspects of a firm. These evaluation criteria are usually linked to intangible assets. The main objective is to identify the existence of competitive advantage that allows companies to grow earning at very high rates, generating returns to the fund. Table 6 presents the main criteria as well as the phase of the process in which these criteria are taken into consideration. The value inside each cell represents the number of organizations that clearly mentioned evaluating the corresponding criterion (lines) at each phase (columns). The use of asterisk means that at least one organization hires external consultants, auditors or lawyers to provide ad hoc opinion on that criterion.
Table 6 – Selection Criteria Along the Process
Criteria Qualification Preliminary
analysis
Detailed
analysis
Due
diligence
Profile (stage, size, industry, region and perspectives) 9 1
Market attractiveness and competition 7 8*
Financial projections and reports 4 9
Valuation 1 1 8
Organizational Capital: Innovativeness 4
Human Capital: Management team 6 9* 2
Human Capital: Remuneration scheme 1 2
Relational Capital: Customer base and market share 3 6*
Relational Capital: Reputation among stakeholders 1 6 1
Relational Capital: Investors 3
Intellectual Property Rights: Technology 2 1 5* 1*
Relational Capital: Strategic alliances 1 1
Organizational Capital: Business model 1 6* 2*
Exit route 5 4
Risks and scenarios 4 6*
Hidden liabilities and contingencies 1 9*
Numbers inside cells represent number of organizations that expressed the necessity to perform an evaluation of the criteria in the corresponding phase. * Indicates assessment made by external consultants by at least one organization.
number and the importance of selection criteria increase in the detailed analysis phase, especially those of internal aspects of he company, to include: technology, innovativeness, internal processes, strategic alliances, financial projections and reports, valuation and business model.
Finally, at the due diligence phase, hidden liabilities and contingencies are under scrutiny, while business model, technology, team and reputation are still evaluated by a few organizations.
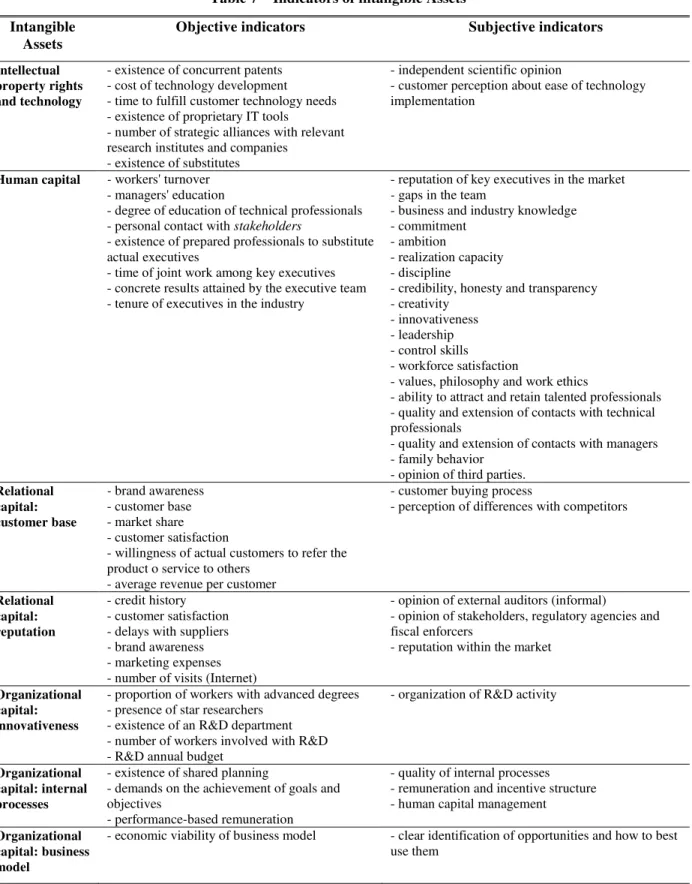
4.3.1 - Indicators of intangible assets
In the evaluation of each criterion, PE/VC managers evaluate several intangible assets. This is done by the means of objective and subjective indicators. Objective indicators as well as subjective indicators coped with a rich experience of PE/VC managers allow for a direct comparison with other companies. Table 7 presents the main indicators mentioned during interviews.
Indicators may vary according to industry. For instance, in the service industry, workers' turnover is extremely relevant. For example, in the "contact center" industry, payroll may represent 70% of expenses. It is common that these companies have thousands of workers. If turnover rates are reduced by a small percentage, training costs will be reduced, productivity will most likely increase, firing and hiring costs will decline. In the case of retail, the average revenue per customer (an indicator of relational capital) is of great relevance.
As it is expected to find in the PE/VC industry, human capital is the most important factor to be analyzed, but it has the most subjective indicators. For this reason, a few PE/VC managers are now using psychologists to make a through assessment of entrepreneurs and management teams. Another means to cope with the inherent difficulty of human capital assessment is the uo use of a framework in which human capital is divided into four criteria: (i) quality of management team; (ii) existence of substitutes to the management team; (iii) attraction of talented professionals; and (iv) human capital management.
The quality of the top management has to be carefully analyzed. It is better to count on the exiting team rather than trying to complement it with outsiders. Mutual trust and a shared work philosophy is key. Among the main questions to be answered are: (i) For how long is top management executives working together?; (ii) What have they achieved as a team?; (iii) What is the extent of their experience in the industry?; (iv) How good is their reputation in the market?; (v) Can management be trusted?; (vi) Do they have the ability and skills to implement the business plan and generate projected cash flows?
Whenever there are gaps in the management tea, it is important to have a team of substitutes to top management positions. The lack of insiders prepared to take on executive positions increases the perceived dependence of the PE/VC organization on the existing management team. Replacing executives and building a new team involve the following challenges: (i) hiring risks; (ii) matching risk; (iii) time to get used to the business model and gain legitimacy. Faced with the lack of substitutes, the company and/or the PE/VC organization is forced to hire external executives in the market. At this moment, company reputation as a good place to work comes into play, in the form of the ability to attract talented professionals.
Finally, having good human capital management practices allows the company to use the talent of its workforce to perform better. To get a sense of how human capital is managed, PE/VC can check the number of managers that posses clear goals to be reached.
Table 7 – Indicators of intangible Assets
Intangible Assets
Objective indicators Subjective indicators
Intellectual property rights and technology
- existence of concurrent patents - cost of technology development - time to fulfill customer technology needs - existence of proprietary IT tools
- number of strategic alliances with relevant research institutes and companies
- existence of substitutes
- independent scientific opinion
- customer perception about ease of technology implementation
Human capital - workers' turnover - managers' education
- degree of education of technical professionals - personal contact with stakeholders
- existence of prepared professionals to substitute actual executives
- time of joint work among key executives - concrete results attained by the executive team - tenure of executives in the industry
- reputation of key executives in the market - gaps in the team
- business and industry knowledge - commitment
- ambition
- realization capacity - discipline
- credibility, honesty and transparency - creativity
- innovativeness - leadership - control skills
- workforce satisfaction
- values, philosophy and work ethics
- ability to attract and retain talented professionals - quality and extension of contacts with technical professionals
- quality and extension of contacts with managers - family behavior
- opinion of third parties. Relational
capital: customer base
- brand awareness - customer base - market share - customer satisfaction
- willingness of actual customers to refer the product o service to others
- average revenue per customer
- customer buying process
- perception of differences with competitors
Relational capital: reputation
- credit history - customer satisfaction - delays with suppliers
- brand awareness - marketing expenses - number of visits (Internet)
- opinion of external auditors (informal)
- opinion of stakeholders, regulatory agencies and fiscal enforcers
- reputation within the market
Organizational capital: innovativeness
- proportion of workers with advanced degrees - presence of star researchers
- existence of an R&D department - number of workers involved with R&D - R&D annual budget
- organization of R&D activity
Organizational capital: internal processes
- existence of shared planning
- demands on the achievement of goals and objectives
- performance-based remuneration
- quality of internal processes - remuneration and incentive structure - human capital management
Organizational capital: business model
4.4 - Use of specialized consultants
PE/VC organizations tend to have small teams and flat hierarchies. Managers are usually generalists and have a rather broad business-related view on portfolio companies. Thus, the evaluation of certain criteria may require special consultants. Consultants are called during the detailed analysis phase to perform technology, business model and market assessments. The PE/VC organization usually keeps a network of specialists that are called to act on an ad hoc basis. The existence of such networks creates incentives for consultants to perform well. Sometimes, specialists take part in technical advisory committees or may become shareholders of portfolio companies.
More recently, PE/VC organizations are relying on the service of psychologists to reveal the psychological profile of main executives and the alignment of interests with their shareholders. The most common method employed is the DISC, developed by William Marston. Results may be use to check on business related skills like: ability to execute corporate strategies, business ethics, corporate strategy drafting skills, innovativeness, commercial skills, managerial skills, alignment of interests with shareholders.
4.5 - Valuation Models
Valuing target companies is an essential step in the selection process. Without a proper valuation, PE/VC manager cannot estimate the potential return of their investments or perform sensibility analysis with certain assumptions taken. Two approaches are commonly used: (i) discounted cash flows (DCF). This approach depends on the good estimation of revenues, costs, expenses and investments. A discount factor must be estimated and applied to calculate the present value of future cash flows. This exercise requires that several assumptions be establish based on the information gathered during the selection process. As PE/VC managers gain more information, cash flow and risk estimation may vary, resulting in different valuations over time; and (ii) comparables. The use of comparables can vary from EBITDA multiples to the number of clicks in webpage banners. The choice depends on the industry in which the company operates. The more it is difficult to estimate future earnings, the more this method becomes attractive.
PE/VC tend to use both DCF and comparable valuation methods simultaneously to gain a better perception of firm value. It is hard to forecast earnings in 5 to 10 years. In this occasion, natural present value of forecasted cash flows are calculated until the last year of forecasts. The terminal value is estimated on comparables (e.g., a multiple of EBITDA).
Scenario analysis is an important tool of the valuation method, to check how firm value varies according to changes in key-variables and assumptions (e.g., timing, multiple applied). PE/VC managers usually rely on scenario analysis.
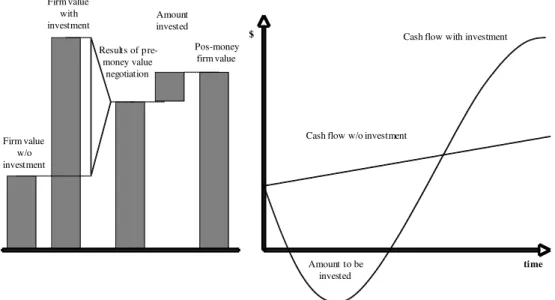
While the valuation of innovative SMEs suggests that intangible assets be identified and measured, PE/VC organizations do not value intangible assets separately. The focus is on the bundle of assets (i.e., the firm) and its cash flow generation capacity, as it can be seen in Figure 3.
Figure 3 – PE/VC Framework to Valuation and Negotiation of Investments
Firm value w/o investment
Firm value with investment
$
time Results of
pre-money value negotiation
Amount invested
Amount to be invested
Cash flow with investment
Cash flow w/o investment Pos-money
firm value
As Figure 3 shows, the negotiation between PE/VC organizations and entrepreneurs results in a price that values the company somewhere between its value w/o investment and the value with investment. The value added by the investment (linked to good projects to be executed) is most often divided among the parties, ensuing a pre-money value of the firm, which summed up with invested capital equals to the post-money value.
While traditional firm valuation methods are used by almost all PE/VC organizations interviewed, at least one PE/VC organization has its proprietary method of biotechnology projects valuation. Based on DCF techniques, the method takes into consideration all phases of biotech products life cycle (e.g., research, development, commercialization). Real options typical of the biotechnology industry are also taken into consideration. During the monitoring phase, when scientific and commercial knowledge builds-up and uncertainties are eliminated, managers rerun the method to see how value evolves. Box 1 presents the method in greater detail.
Case: Valuing biotechnology projects in ten steps
One of the PE/VC organizations participating in this study has significant holdings in two biotechnology companies that produce genetically modified organisms for specialty (e.g., orange, eucalyptus and sugar cane) and global crops (e.g., soybean). Projects can have market potential of US$ 500 million or higher. However, the time and risks to put these innovations in the market are very long, making investment extremely risky. For this reason, the PE/VC organization will only execute a project if its revenue generation potential is at least 20 times investment. In this context, the assessment of projects is an essential activity an follows a scientific method with ten steps:
1. Gains brought by technology to producers: Managers try to model the financials of a producer running non-modified organisms. All costs, expenses and revenue per acre are estimated, to calculate profit per acre. The model is then rerun adding the difference in productivity and costs brought by the new technology. A new profit per acre is found. The difference between the two profits equals the gain brought by the innovation to the typical producer per acre.
crop. The number is multiplied by the gain brought by the technology per acre. This is the financial gain brought by the technological development. Technology adoption curve must be estimated based on the profile of customers. Only pioneers will adopt the new technology right in the beginning. Most will wait for others to fully test it. A few customers will never adopt it or the costs to serve them will be prohibitively. Potential market share is estimated at 50% after five years.
3. Pricing: Theoretically, the maximum price that could be charged per acre would be equal the gain brought by the technology to the producer (step 1). However, producers need a return in the form of higher profits to adopt the new technology. Gains will have to be divided among producers an the R&D and distribution value-chain supporting the new product. Usually, these gains are divided equally.
4. Present value: Based in the first three steps, managers could estimate the revenues that the new technology could bring to the biotech company. Now, the cash flows of these revenues need to be discounted by the cost of capital to calculate its net present value in the launching date (generally 10 years after the beginning of R&D efforts).
5. Technological barriers: The critical question is that the new technology does not exist. It takes time to develop it. All barriers must be identified and estimated. The existing obstacles are of laboratorial, regulatory and commercial nature. For example: (i) discovering the right gene; (ii) inserting the gene into the plant; (iii) getting expected results with the plants; (iv) getting commercial approval; (v) being exposed to regulatory issues; and (vi) being successful commercializing it. In fact, each project has its own barriers identified by a group of scientists and managers, based on empirical knowledge. Moreover, each obstacle has its success rate estimated. Once the investment is made, probabilities are estimated twice a year by the board, assisted by a business analyst. The regulatory barrier is considered as the biggest threat for biotech products, since it impacts the project when all effort and investment has been already made. Political issues of a country like Brazil and countries that consume the agricultural goods have great influence.
6. NPV of revenues: Probabilities of success are multiplied one by one to reach overall success probability for the project. This number, multiplied by the market potential, represents the expected revenue for the project.
7. NPV of costs and expenses: All costs and expenses are budgeted and multiplied by the probability that the project will advance enough in the R&D and distribution process as to make use of the activities that generate them. For example, distribution costs will not be incurred if the technology is not successful in field tests.
8. Project's NPV: NPV of costs and expenses is deducted from revenue NPV. Only positive NPV projects receive investment.
9. Value of real options*: The above-mentioned steps consider the existence of one path only. However, biotechnology projects usually allow several paths to be taken. Also, until the project comes to an end, managers hold important abandonment and expansion options. Mathematical models can value all these options.
10. Monitoring value: Besides revision of probabilities and assumptions on a frequent basis, managers rerun the valuation model whenever an obstacle gets passed by. All costs and expenses incurred up to this point are brought to present dates and the obstacle are no longer considered in the NPV of the revenues, revealing the value that was added by the successful R&D activities.
*
4.6 - Risk factors
Risk factors need to be discovered and measured by PE/VC managers during the selection phase. Normally, risk factors are not properly included in business plans. Knowing them is essential because: (i) they need to be mitigated; and (ii) they need to be measured to estimate the risk premium/discount rate that is applied in valuation.
While it can be very subjective, risk measurement is an important task in PE/VC investing. Past experience surely helps in the estimation of risk factors and their relative importance, so a discount rate can be calculated and used in the valuation method. Risk factors change from one type of business to the other, as well as by stage. A few of the most important risk factors mentioned by the interviewees are:
Technological risk
Companies that seek PE/VC tend to employ new technologies in their products or services. These technologies may not be completely mastered by the firm. For example, chemical and biological process that work in laboratories may not respond well to scaling-up. Risks in dealing with unexpected situations may delay revenue generation and/or increase costs of research, development, production or commercialization of products. Radical innovations represent an extreme case of technological risk. The firm may not be sure about the existence of competing technologies. A temporary success in the market may be erased by the arrival of a newer and superior technology.
Risks in the business model
According to Lev (2003), business model is the orchestration of the value chain (from suppliers to customers passing by marketing and operations decision) to maximize firm value. According to experienced PE/VC managers, chances are that the business model presented in the business plans will need to evolve before the investment is made or while the firm is part of the PE/VC portfolio. Significant changes in the firm's market will force a revision of the business model. Also, the execution of a business model depends on external factors such as that customers and suppliers accept prices and conditions. The higher the dependence on third parties is, the bigger the risks in the business model.
Management risk
Considered as the most relevant source of risk, it is present in all sizes of companies but becomes crucial to start-ups. A change in the management team is usually a delicate and slow process, especially when there is a lack of prepared professionals to take management position as substitutes of former executives. Without good candidates from within the firm, the company will face a few challenges to recruit and incorporate outsiders: (i) attraction of talented professionals; (ii) time to get to know the business and get necessary information; (iii) matching with existing team.
Exit risk
PE/VC investments have exit perspective. O obtain superior returns, PE/VC managers will need to sell their shares with gains in the stock markets, to strategic buyers or to the entrepreneurs themselves. Given that the most profitable deals take place by IPOs and strategic sales, the risks are: (i) existence of potential buyers; (ii) strategic alignment with potential buyer; (iii) history of similar transactions; (iv) entrepreneurs willing to sell their business; and (v) in the case of IPOs, good market conditions. The timing is an important aspect of exit, as it has a strong impact on return on investment.
Other sources of risk mentioned in the interviews are: (i) diversification risk. Linked to the degree of homogeneity of the portfolio; (ii) market risk. Includes the concentration of revenues with few clients, realization of market growth, arrival of competitors and regulation issues; (iii) financial risk. Changes in foreign exchange rates, interest rates and so on.
5 - Concluding Remarks
Due to their ability to deal with intangible assets, PE/VC organizations have an important and crescent role in the economy. Companies with high levels of intangible assets to total assets in general and innovative SMEs in particular are exposed to high information asymmetry.
This paper investigates the investment selection practices of a sample of PE/VC organizations in Brazil. As it can be seen, because PE/VC organizations work with non-listed companies, the work they perform in order to find good deals is fundamentally different from the work of traditional investors that search for companies in the stock markets and enjoys lots of publicly available information and liquidity.
Note that PE/VC operates in a very illiquid market, with limited access to information. During the selection phase, they need to obtain sufficient information to tell good projects from bad projects and make a proper valuation based on discounted cash flows and comparables.
Understanding the sources of projected cash flows and estimating risks depends on the examination of intangible assets. Evaluating intangibles is done based on several criteria and indicators (objective and subjective ones). These criteria are assessed during the four phases of the selection process.
6 - References
American Institute of Certified Public Accountants – AICPA. (2000) Improved Business Reporting.
Amit, R., J. Brander, & C. Zott. (1998) "Why Do Venture Capital Firms Exist? Theory and Canadian Evidence." Journal of Business Venturing 13: 441-466.
Ballardini, F., A. Malpiero, R. Oriani, M. Sobrero, & A. Zammit. (2005) "Do Stock Markets Value Innovation? A Meta-Analysis." Paper presented at the Academy of Management Meeting, Honolulu, August 5-10.
Baum, J., & B. Silverman. (2004) "Picking winners or building them? Alliance, Intellectual, and Human Capital as Selection Criteria in Venture Financing and Performance of Biotechnology Startups.
Journal of Business Venturing 19: 411-436.
Beatty, R. (1989) "Auditor Reputation and the Pricing of Initial Public Offerings." Accounting Review 64: 693-699.
Blair, M., G. Hoffman, & S. Tamburo. (2001) "Clarifying Intellectual Property Rights for the New Economy." Georgetown Law and Economics Research Paper 274038.
Botosan, C. (1997) "Disclosure Level and the Cost of Equity Capital." The Accounting Review 72(3): 323-349.
Carter, R., & S. Manaster. (1990) "Initial Public Offerings and Underwriter Reputation." Journal of Finance 45: 1045-1067.
Carvalho, A., L. Ribeiro, & C. Furtado. (2006) Private Equity and Venture Capital in Brazil – 1st Census. São Paulo: Editora Saraiva.
Coleman, I., & R. Eccles. (1997) Pursuing Value: Reporting Gaps in the United Kingdom. PriceWaterhouseCoopers.
Crepon, B., E. Duguet, & J. Mairesse. (1998) "Research, innovation and productivity: an econometric analysis at the firm level." Economics of Innovation and New Technology 7:115-158.
Deeds, D., D. Decarolis, & J. Coombs. (1997) "The Impact of Firm-Specific Capabilities on the Amount of Capital Raised in an Initial Public Offering: Evidence from the Biotechnology Industry. Journal of Business Venturing 12: 31-46.
Elliott, R. (1992) "The Third Wave Breaks on the Shores of Accounting." Accounting Horizons 6(2).
Eliott, R., & P. Jacobson. (1994) "Costs and Benefits of Business Information Disclosure." Accounting Horizons 8(4).
Fried, V., & R. Hisrich. (1994) "Toward a Model of Venture Capital Investment Decision Making."
Financial Management 23(3): 28-37.