www.epjournal.net – 2007. 5(2): 428-441
¯¯¯¯¯¯¯¯¯¯¯¯¯¯¯¯¯¯¯¯¯¯¯¯¯¯¯¯
Original Article
Looking for Ms. Right: Allocating Attention to Facilitate Mate Choice
Decisions
Kelly D. Suschinsky, Department of Psychology, University of Saskatchewan, Saskatoon, SK, CANADA. *current address: Department of Psychology, University of Lethbridge, Lethbridge, AB, CANADA. Email:
Lorin J. Elias, Department of Psychology, University of Saskatchewan, Saskatoon, SK, CANADA.
Daniel Brian Krupp, Department of Psychology, Neuroscience & Behaviour, McMaster University, Hamilton, ON, CANADA
Abstract: Through various signals, the human body provides information that may be used
by receivers to make decisions about mate value. Here, we investigate whether there exists a complementary psychological system designed to selectively attend to these signals in order to choose, and direct effort toward the acquisition of, a potential mate. We presented young men with three images of the same woman (six women in total) simultaneously, varying the waist-to-hip ratio (WHR) of each image while holding other traits constant. While participants chose their preferred image, we monitored visual attention using an infrared eye-tracker. We found that participants focused their attention selectively on body regions known to provide reproductive information in a manner consistent with the research hypothesis: Reproductively relevant body regions, especially the head and breasts, received the most visual attention. Likewise, images with lower WHRs and reproductively relevant regions in images with lower WHRs received the most visual attention and were chosen as most attractive. Finally, irrespective of WHR size, participants fixated more often and for longer durations on the images that they selected as most attractive.
Keywords: visual attention, female physical attractiveness, mate choice, infrared
eye-tracker
¯ ¯ ¯ ¯ ¯ ¯ ¯ ¯ ¯ ¯ ¯ ¯ ¯ ¯ ¯ ¯ ¯ ¯ ¯ ¯ ¯ ¯ ¯ ¯ ¯ ¯ ¯ ¯ ¯ ¯ ¯ ¯ ¯ ¯ ¯ ¯ ¯ ¯ ¯ ¯ ¯ ¯ ¯ ¯ ¯ ¯ ¯ ¯ ¯ ¯ ¯ ¯ ¯ ¯ ¯ ¯ ¯ ¯ ¯ ¯ ¯ ¯ ¯ ¯ ¯ ¯ ¯ ¯ ¯ ¯ ¯ ¯ ¯ ¯ ¯ ¯ ¯ ¯ ¯ ¯ ¯ ¯
Theoretically, organisms capable of making accurate valuations of potential mates would be at a reproductive advantage over their conspecifics. Proper valuation requires that the organism forage for useful information about reproductive characters (e.g., sex and age) and make use of this information to choose a mate from the larger pool of conspecifics and to allocate effort toward actualizing the choice. A history of selection for reproductive information foraging would thus result in preferences for processing those signals that provided reliable information about variables relevant to a prospective mate’s quality in ancestral environments, such as fecundity, fertility, and health. More specifically, preferences should evolve for valuable and efficient signals, here defined as cues to information that would have improved the accuracy of a decision in the selective environment (the value criterion), where the cues were statistically reliable, more readily accessed, and more easily used (the efficiency criterion). So defined, the signals themselves do not have to be the direct products of selection, but may be incidental to other aspects of adaptive design, such that they “leak” information.
Several aspects of the human body provide information useful for the assessment of a potential mate, and preferences for these traits vary in corresponding ways. The face, for instance, provides cues to present health (Jones et al., 2005), survivorship (Henderson and Anglin, 2003), developmental stability (Perrett, Penton-Voak, Lee, Rowland, and Edwards, 1999), and genetic relatedness (DeBruine, 2005). The distribution of body fat, which affects the waist-to-hip ratio (WHR), provides information about age, health, fertility, and sexual behavior (Hughes and Gallup, 2003; Jasieńska, Ziomkiewicz, Ellison, Lipson, and Thune, 2004; Kaye, Folsom, Prineas, Potter, and Gapstur, 1990; Singh, 1993, 2002; van Anders and Hampson, 2005). Likewise, breast size and shape are associated with important reproductive characteristics, including age, fertility and fecundity (Howard and Gusterson, 2000; Jasienska et al., 2004; Møller, Soler, and Thornhill, 1995).
Although information is crucial to adaptive decision-making, only so much is actually relevant to the task (Dall, Giraldeau, Olsson, McNamara, and Stephens, 2005); even so, individuals tend to encounter information at rates considerably higher than their capacity to make full use of it (Dukas, 2002). Attentional resources are necessary for discriminating useful from irrelevant information, but they are limited and so should be allocated selectively. Selective attention can result in an optimal decision-making system: individuals able to filter out background information will make decisions rapidly and expend less energy in the process.
This foraging example points to the central uses of attention to select a choice among a set of objects (e.g., edible prey against a background of inedible ones) and to allocating effort toward securing that choice. Thus, attention can be seen as a mechanism facilitating both choice and acquisition. Several predictions follow from this hypothesis. First, individuals will selectively attend to valuable information, or more precisely, to historically efficient signals of valuable information. Second, estimates of attentional allocation will be positively associated with the choices made by the individual: an individual should filter out less desirable choices by allocating greater attention to the more desirable ones in the set. Third, individuals will make use of one or both types of selective attention mechanisms (stimulus- and spatially-driven), as the decision requires. Thus, individuals will focus on variable (and informative) signals to make a choice, but will also focus more attention on their choice as a means of allocating effort toward its acquisition.
Because attention is a fundamental means of foraging for information, and it is allocated automatically and selectively, it can provide a window onto the processes underlying the choice, and can also be a more accurate and less obtrusive measure of preferences than standard verbal elicitation procedures, such as questionnaire methods, or other techniques that require conscious decision-making (Krupp, in press). Quinsey and colleagues (Harris, Rice, Quinsey, and Chaplin, 1996; Quinsey, Ketsetzis, Earls, and Karamanoukian, 1996; Silverthorne and Quinsey, 2000) have shown that people viewing images dwell longer on those that match their preferences for age and biological sex (inferred from self-report or from measures of vasocongestive genital response). Likewise, participants devote considerably more attention to faces, genitals, and the overall body than to clothing or background when viewing images of heterosexual couples engaged in explicit sexual acts (Rupp and Wallen, 2007). Moreover, performance on an attentional task is affected by the sex and sexual orientation of the subject and the sex of the stimulus image preceding the task (Jiang, Costello, Fang, Huang, and He, 2006). Stimuli in these studies are typically presented sequentially, however, so the function of attention in this context is difficult to elucidate; the differential allocation of attention when there are competing stimuli would provide a clearer demonstration of the use of attention in mate choice and acquisition decisions.
We tested the hypothesis that attention facilitates the allocation of effort for both choice and acquisition in the mating domain by investigating whether visual attention would be allocated (i) to a variable, reproductively relevant signal (stimulus-selective attention for mate choice), (ii) to other invariant, but still reproductively relevant signals (spatially-selective attention for mate acquisition by narrowing focus on the choice), and (iii) as a function of attractiveness choices. Since visual signals are generally more important to male than to female mate choice decisions among humans (Symons, 1979) and since young men face steep competition for mates (Wilson and Daly, 1985), we investigated the allocation of attention to female body regions in a mate preference task among young men. Using an infrared eye-tracker, we measured attentional allocation by the number and mean “dwell time” of visual fixations to particular body areas (known as regions of interest, or ROIs) depicted in a stimulus or across all stimuli (Duncan, Ward, and Shapiro, 1994).
per trial (three images per set from a total of six image sets of different women). In order to gauge stimulus-selective attention, images within sets had been digitally manipulated to differ by WHR size (Henss, 2000), while all other elements of the images were held constant within sets to estimate spatially-selective attention. In order to elicit selective attention, we imposed a relatively short window of stimulus exposure (20s) as a timing constraint. Following from the hypothesis above, we predicted that: (i) attention would be allocated to the waist and hips ROI (stimulus-selective attention); (ii) the head, chest, and waist and hips ROIs (i.e., those presumed to provide more reproductive information) would receive the most visual attention (spatially-selective attention), relative to the legs ROI1; (iii) images with lower WHRs and putatively reproductively relevant ROIs in images with lower WHRs would receive the most visual attention (spatially-selective attention), relative to other images in the set; and (iv) there would be a positive association between attentional allocation and attractiveness choices.
Materials and Methods
Participants
Thirty-two undergraduate male psychology students (Mean age = 19.7 years, SD = 2.1) participated for course credit. All participants were heterosexual as identified by their response to a question regarding sexual orientation (i.e., heterosexual, homosexual, or bisexual) on a biographic questionnaire.
Materials
A questionnaire was administered to the participants to determine basic biographic characteristics. Photographic stimuli were taken from Henss (2000).2 Stimuli consisted of six original color photographs of clothed females that had been digitally manipulated to tighten and widen the waist of each photograph, thereby creating a total of 18 stimuli. The photographs with lower WHRs had a mean WHR of 0.71 (range = 0.68 to 0.74). The original photographs depicted a mean WHR of 0.75 (range = 0.70 to 0.79). Lastly, photographs with higher WHRs had a mean WHR of 0.78 (range = 0.71 to 0.85). The stimuli were presented via a Sceptre 19” SVGA computer monitor running at 1024 X 768 resolution positioned approximately 60 centimeters from the participant. Eye–movements of the participant’s dominant eye were monitored during each experimental trial using an SMI–REDII iView infrared eye monitoring system. Samples of eye position were taken at 60 Hz, and the system had a spatial resolution accurate to within 0.5 degrees of visual angle. The eye–tracking system and the stimulus administration program were operated by separate computers, but the two computers were interfaced via a parallel port connection, so as to ensure accurate timing of stimulus presentation and data collection.
Procedure
the researcher determined the participant’s dominant eye by asking each participant to cup his hands to form a small hole while keeping his arms extended. Each participant was then asked to locate a distant object through the hole formed by his hands, and to slowly bring his hands to his face, keeping the object centered in the hole. The researcher observed which eye the hole in each participant’s hands rested on, and recorded it as the dominant eye.
Once the dominant eye had been determined, each participant underwent a nine-point calibration process: Participants were requested to follow a white dot on a computer screen with their eyes, in order for the eye-tracker to accurately measure each individual’s eye movements. Upon successful calibration, a set of instructions appeared on the testing monitor in front of the participant outlining the experimental task. Participants were instructed to look at the photographs in whatever manner was necessary in order to judge the attractiveness of the stimuli. Participants were also informed that the researcher could not associate their eye movements with the stimuli during testing, so as to encourage the participants to look at the images as naturally as possible.
The experimental task involved the simultaneous presentation of three color images of a young woman that were identical in every respect except for WHR size. Across six 20-second trials (each trial representing a set of images of a different woman), stimulus locations were counterbalanced according to WHR size. The participant was asked to identify the photograph he found to be the most attractive by a button press. Upon the completion of the final trial, each participant was debriefed.
Data Analysis
The eye-tracker was used to determine which image and which region of the image received the most attention. The images were divided into four different regions that were equal in size across the three matched images in each set (i.e., the three photographs that differed solely on WHR size): head/neck, shoulders/chest, waist and hips, and legs (i.e., anything below the hips of the photograph). Because the images differed in actual size, a mean of the relative proportion of each region was calculated.3 The head region comprised 30% of the image (range = 0.24 to 0.35 cm), the chest region 24% (range = 0.17 to 0.27 cm), the waist and hips region 26% (range = 0.21 to 0.32 cm), and the legs region 20% (range = 0.05 to 0.30 cm). The data for the three measures (most attractive image, mean number of fixations per region per WHR size, and mean dwell time per region per WHR size) were analyzed separately. A Friedman’s chi square was used to analyze the first measure and repeated-measures ANOVAs were performed for the latter measures. Given that there were multiple trials for each condition, the number of fixations and the dwell time per region in each WHR stimulus was averaged across the six trials to provide composite scores (e.g., mean number of fixations and mean dwell time of the head of low WHR, head of medium WHR, head of high WHR, etc.) Data from one of the 32 participants could not be scored because the file was corrupted.
Attractiveness Choices
Out of a total of 186 trials, the images with the lowest WHR were selected significantly more often (51.6%) than the medium WHRs (30.1%) or the highest WHRs (18.3%; Friedman’s chi square, χ2(5)=19.98, p < 0.001, Nemenyi’s post-hoc test, p < 0.001).
Measures of Visual Attention
Wilcoxon signed ranks tests on standardized values of observed mean number of fixations against standardized values of observed mean dwell time show that the distributions of the two dependent measures do not differ significantly at any WHR size (all ps > .53) or body region (all ps > .70). Thus, the distributions of individual scores on the two dependent measures are approximately identical in relation to the WHR Size and Body Region variables.
Regarding both mean number of fixations and mean dwell time, the analyses for the main effect of WHR Size do not violate the assumption of sphericity, so the statistics reported are not adjusted. However, the analyses of Body Region and the WHR Size x Body Region interactions do violate sphericity (for both sets of analyses, Mauchly’s W < .35, p < .005), so we report Greenhouse-Geisser adjustments for them and, for all effects, trend analyses that are not contingent on assuming sphericity (Tabachnick and Fidell, 2001). The profile and interaction plots for all analyses are presented in Figures 1 and 2.
Mean Number of Fixations
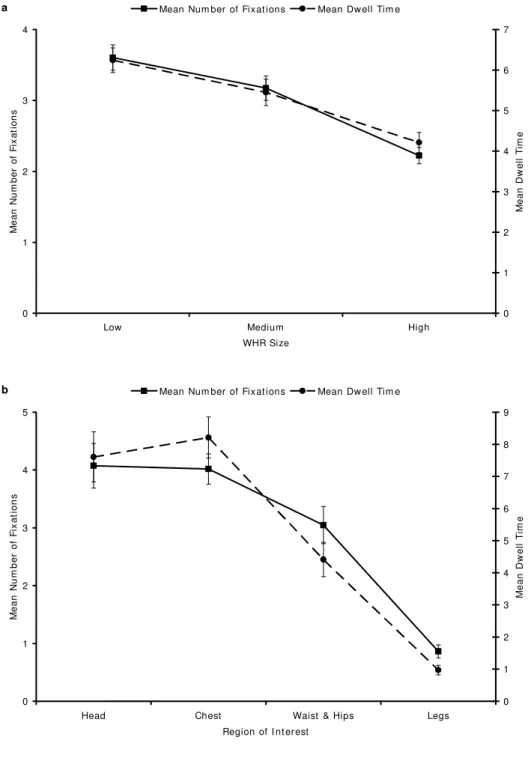
For the purposes of this study, a fixation was defined as the visual exploration of an area of 128 pixels square for a duration of more than 50 ms. There was a significant main effect of WHR Size on mean number of fixations (F(2, 60) = 82.82, p < .001). As predicted, there was a significant linear component to the trend in the mean number of fixations across WHR sizes (F(1, 30) = 126.57, p < .001). However, there was also a significant quadratic component to this trend (F(1, 30) = 10.00, p = .004). Figure 1a portrays the estimated marginal means and standard errors for this main effect (i.e., the predicted values based on the associated model). There was a significant main effect of Body Region as well (F(1.71, 51.28) = 27.10, p < .001), with significant linear (F(1, 30) = 56.42, p < .001) and quadratic (F(1, 30) = 9.82, p = .004) components; see Figure 1b for the estimated marginal means and standard errors.
WHR images received a similar number of fixations, with the exception of the chest: the chest region of the low WHR images received significantly more fixations than the chest region of the medium-sized WHR images (t(30) = 5.96, p < .001). All body regions in the medium-sized WHR images received significantly more fixations relative to the high WHR images (p ≤ .001 for all tests), with the exception of the legs. The estimated marginal means and standard errors for this interaction are depicted in Figure 2a.
Figure 1. Estimated marginal means and standard errors for mean number of fixations and mean dwell time (a) across WHR sizes and (b) body regions.
0 1 2 3 4
Low Medium High
WHR Size M e a n N u m b e r o f F ix a ti o n s 0 1 2 3 4 5 6 7 M e a n D w e ll T im e
Mean Num ber of Fix at ions Mean Dw ell Tim e a 0 1 2 3 4 5
Head Chest Waist & Hips Legs
Region of I nt erest
M e a n N u m b e r o f F ix a ti o n s 0 1 2 3 4 5 6 7 8 9 M e a n D w e ll T im e
Mean Num ber of Fixat ions Mean Dw ell Tim e
Figure 2. Estimated marginal means and standard errors for (a) mean number of fixations and (b) mean dwell time across body regions at different WHR sizes.
0 1 2 3 4 5 6 7
Head Chest Waist & Hips Legs
Region of I nt erest
M
e
a
n
N
u
m
b
e
r
o
f
F
ix
a
ti
o
n
s
Low WHR Medium WHR High WHR a
0 2 4 6 8 10 12
Head Chest Waist & Hips Legs
Region of I nt erest
M
e
a
n
D
w
e
ll
T
im
e
images they did not select as most attractive. Our results indicate that men looked significantly more often at the images they had selected as most attractive relative to the other images (t(30) = 6.20, p < .001).
Mean Dwell Time
There was a significant main effect of WHR Size on mean dwell time (F(2, 60) = 32.05, p < .001). As predicted, there was a significant linear component to the trend in the mean dwell time across WHR sizes (F(1, 30) = 56.73, p < .001). Figure 1a portrays the estimated marginal means and standard errors for this main effect. There was a significant main effect of Body Region as well (F(1.73, 51.90) = 31.42, p < .001), with significant linear (F(1, 30) = 78.70, p < .001), quadratic (F(1, 30) = 7.69, p = .009), and cubic (F(1, 30) = 6.60, p = .015) components; see Figure 1b for the estimated marginal means and standard errors.
Lastly, there was a significant WHR Size x Body Region interaction (F(3.06, 91.70) = 5.31, p = .002). Although this interaction had a significant linear x linear component to the trend (F(1, 30) = 11.03, p = .002), there were also significant linear x quadratic (F(1, 30) = 5.27, p = .029) and quadratic x cubic (F(1, 30) = 13.48, p = .001) components. Paired-samples t-tests revealed that, in comparison to the high WHR images, the low WHR images received significantly more attention, in terms of mean dwell time, on all ROIs (p ≤ .008 for all tests), with the exception of the legs. The chest region of the low WHR images received significantly more attention than that of the medium WHR images (t(30) = 5.63, p < .001), but no other significant differences were found. The medium-sized WHR images received significantly more attention to head (t(30) = 3.66, p = .001) and waist and hips (t(30) = 5.03, p < .001) ROIs, relative to the high WHR images. The estimated marginal means and standard errors for this interaction are depicted in Figure 2b.
Difference scores were again computed for dwell time in an identical manner to that described for number of fixations. Again, participants dwelled for significantly longer amounts of time on the images they had selected as most attractive, in comparison to those images they had not selected (t(30) = 4.27, p < .001).
Discussion
respective sets. Another indication that visual attention is devoted at least in part to the WHR was that lower WHR images were selected as most attractive more often than images with higher WHRs. Interestingly, although our results corroborate the findings of Singh (1993) and Henss (2000) that the WHR affects male preferences, men appear to devote relatively little focused attention to this region; we return to this point below. Lastly, images selected as most attractive, regardless of WHR size, received more attention than those images that had not been selected as most attractive, suggesting that visual attention functions not only to facilitate mate choice decisions, but also potentially the acquisition of said choice.
Several alternative hypotheses that might explain our results warrant consideration. First, it is possible that the relative size of an ROI on the screen drove the effects, such that larger ROIs took longer to scan and were more likely to be fixated upon by chance. However, this account is unlikely for two reasons. Participants dwelled on the chest ROI in the small WHR images for a whole order of magnitude longer than on the legs ROI in the same images (see Figure 2b), even though these two ROIs differed in size by only a factor of 1.5. Moreover, despite the head ROI being larger than the chest and the waist and hips ROIs, the head and chest ROIs consistently received similar amounts of attention. These same results rule out a second alternative hypothesis, that there was a vertical scanning bias directing our results. As the chest ROI was often equal to and, in some instances, even surpassed the head ROI in attentional allocation, a scanning bias is not apparent. Finally, stimulus-selective attention could not have driven the effects alone, because more attention was paid to two of the invariant ROIs (head and chest) than to the variable one (waist and hips), but less to the final invariant region (legs). Thus, the participants were not merely using a “find the difference between the images” strategy to compare the images. In conclusion, we submit that the pattern of results observed is difficult to explain in the absence of the hypothesis that stimulus- and spatially-selective attention are used to both choose a mate and to allocate effort to acquiring this choice. Although we sampled only men in the current study, we suspect this hypothesis will hold true among women as well, though they might rely less on visual signals or on different visual signals altogether.
of reproductive age, but may be inefficient for discriminating among individuals once the options have been thus restricted. On the other hand, certain signals may draw upon attentional resources to a greater degree because, though they are valuable, they are difficult to process. There may, of course, be a tradeoff between the efficiency of a signal and its value once decoded, but it is reasonable to suppose that signals, signalers and receivers are co-adapted to a good degree (as in theories of “sensory drive”; Endler, 1992), so we do not expect much attention to be allocated to inefficient signals unless they are relatively valuable. Regardless, there remain a number of unanswered questions in the domain of human mate choice, and the study of attention (among other cognitive systems) may prove a fruitful means of pursuing these questions.
Notes
1 It remains equivocal whether leg characters are truly less efficient signals than the other
ROIs studied here. It may be that they have been empirically scrutinized less often,
although it may also be that they are highly redundant (e.g., Snijder et al., 2003; Snijder et al., 2004) or are generally less informative. Nevertheless, this prediction provides a more conservative test of our hypothesis, because if the leg ROI does provide a valuable and efficient signal, it too would be the focus of attention.
2 As noted in the text, images were taken from Henss (2000). The images depicted female
models, clothed in either bathing suits or dresses. Henss does not describe the age of the models, although they all appear to be youthful and are likely in their early 20s. Body regions are shown fully, with the exception of the legs. The relative proportion of each image devoted to each body region is listed in the text.
3 On average, images were 14.43 cm high (range = 10.5 to 20.3 cm) and 8.8 cm wide
(range = 4.8 to 13.5 cm).
4 Due to technical failure, data could not be retrieved for the first trial of the experiment.
However, we have no reason to believe that the pattern of results would vary significantly between individual trials.
Acknowledgements:
The authors wish to thank Martin Lalumière for helpful comments on several drafts, as well as Martin Daly, Lisa DeBruine, Ben Jones, Sari van Anders, and Margo Wilson for providing suggestions. This work was supported by fellowships from the Social Sciences and Humanities Research Council of Canada to KDS and DBK, and a Natural Sciences and Engineering Research Council of Canada grant to LJE.
References
Dall, S. R. X., Giraldeau, L.-A., Olsson, O., McNamara, J. M., and Stephens, D. W. (2005). Information and its use by animals in evolutionary ecology. Trends in Ecology and Evolution, 20, 187-193.
DeBruine, L. M. (2005). Trustworthy but not lust-worthy: Context-specific effects of facial resemblance. Proceedings of the Royal Society, Series B: Biological Sciences, 272, 919-922.
Dukas, R. (2002). Behavioural and ecological consequences of limited attention. Philosophical Transactions of the Royal Society, Series B: Biological Sciences, 357, 1539-1547.
Duncan, J., Ward, R., and Shapiro, K. (1994). Direct measurement of attentional dwell time in human vision. Nature, 369, 313-315.
Endler, J. A. (1992). Signals, signal Conditions, and the direction of evolution. American Naturalist, 139 (suppl.), S125-S153.
Harris, G. T., Rice, M. E., Quinsey, V. L., and Chaplin, T. C. (1996). Viewing time as a measure of sexual interest among child molesters and normal heterosexual men. Behaviour Research and Therapy, 34, 389-394.
Henderson, J. J. A. and Anglin, J. M. (2003). Facial attractiveness predicts longevity. Evolution and Human Behavior, 24, 351-356.
Henss, R. (2000). Waist–to–hip ratio and female attractiveness: Evidence from photographic stimuli and methodological considerations. Personality and Individual Differences, 28, 501–513.
Howard, B. A., and Gusterson, B. A. (2000). Human breast development. Journal of Mammary Gland Biology and Neoplasia, 5, 119-137.
Hughes, S. M., and Gallup, G. G., Jr. (2003). Sex differences in morphological predictors of sexual behavior: Shoulder to hip and waist to hip ratios. Evolution and Human Behavior, 24, 173-178.
Jasieńska, G., Ziomkiewicz, A., Ellison, P. T., Lipson, S. F., and Thune, I. (2004). Large breasts and narrow waists indicate high reproductive potential in women. Proceedings of the Royal Society of London, Series B: Biological Sciences, 271, 1213-1217.
Jiang, Y., Costello, P., Fang, F., Huang, M., and He, S. (2006). A gender- and sexual orientation-dependent spatial attentional effect of invisible images. Proceedings of the National Academy of Sciences, 103, 17048-17052.
Jones, B. C., Perrett, D. I., Little, A. C., Boothroyd, L., Cornwell, R. E., Feinberg, D. R., et al. (2005). Menstrual cycle, pregnancy and oral contraceptive use alter attraction to apparent health in faces. Proceedings of the Royal Society of London, Series B: Biological Sciences, 272, 347-354.
Kaye, S. A., Folsom, A. R., Prineas, R. J., Potter, J. D., and Gapstur, S. M. (1990). The association of body fat distribution with lifestyle and reproductive factors in a population study of postmenopausal women. International Journal of Obesity, 14, 583-591.
visual attention to adaptive design. Archives of Sexual Behavior.
Møller, A. P., Soler, M., and Thornhill, R. (1995). Breast asymmetry, sexual selection, and human reproductive success. Ethology and Sociobiology, 16, 207-219.
Perrett, D. I., Burt, D. M., Penton-Voak, I. S., Lee, K. D., Rowland, D. A., and Edwards, R. (1999). Symmetry and human facial attractiveness. Evolution and Human Behavior, 20, 295-307.
Rupp, H. A., and Wallen, K. (2007). Sex differences in viewing sexual stimuli: An eye- tracking study in men and women. Hormones and Behavior, 51, 524-533.
Quinsey, V. L.,Ketsetzis, M., Earls, C., and Karamanoukian, A. (1996).Viewing time as a measure of sexual interest. Ethology and Sociobiology, 17, 341-354.
Silverthorne, Z. A., and Quinsey, V. L. (2000). Sexual partner age preferences of homosexual and heterosexual men and women. Archives of Sexual Behavior, 29, 67-76.
Singh, D. (1993). Adaptive significance of female physical attractiveness: Role of waist– to–hip ratio. Journal of Personality and Social Psychology, 65, 293–307.
Singh, D. (2002). Female mate value at a glance: Relationship of waist-to-hip ratio to health, fecundity, and attractiveness. Neuroendocrinology Letters, Special Issue (Suppl. 4), 23, 81-91.
Snijder, M. B., Dekker, J. M., Visser, M., Bouter, L. M., Stehouwer, C. D. A., Yudkin, J. S., et al. (2004). Trunk fat and leg fat have independent and opposite associations with fasting and postload glucose levels: The Hoorn study. Diabetes Care, 27, 372-377.
Snijder, M. B., Dekker, J. M., Visser, M., Yudkin, J. S., Stehouwer, C. D. A., Bouter, L. M., et al.(2003). Larger thigh and hip circumferences are associated with better glucose tolerance: The Hoorn study. Obesity Research, 11, 104-111.
Symons, D. (1979). The evolution of human sexuality. New York: Oxford University Press. Tabachnick B. G., and Fidell, L. S. (2001). Using multivariate statistics (4th ed.). Boston:
Allyn and Bacon.
van Anders, S. M., and Hampson, E. (2005). Waist-to-hip ratio is positively associated with bioavailable testosterone but negatively associated with sexual desire in healthy premenopausal women. Psychosomatic Medicine, 67, 246–250.