http://dx.doi.org/10.1590/1980-57642018dn12-040009
Applicability of the Test of Variables of
Attention – T.O.V.A in Brazilian adults
Cláudia M. Memória1, Henrique C.S. Muela2,3, Natália C. Moraes1, Valéria A. Costa-Hong2,Michel F. Machado2, Ricardo Nitrini1, Luiz A. Bortolotto2, Monica S. Yassuda1
ABSTRACT. The functioning of attention is complex, a primordial function in several cognitive processes and of great interest to neuropsychology. The Test of Variables of Attention (T.O.V.A) is a continuous computerized performance test that evaluates some attention components such as response time to a stimulus and errors due to inattention and impulsivity. Objective: 1) To evaluate the applicability of T.O.V.A in Brazilian adults; 2) To analyze the differences in performance between genders, age ranges, and levels of education; 3) To examine the association between T.O.V.A variables and other attention and cognitive screening tests. Methods: The T.O.V.A was applied to 63 healthy adults (24 to 78 years of age) who also underwent the Mini-Mental State Examination (MMSE), Montreal Cognitive Assessment (MoCA), Digit Span and Digit Symbol (Wechsler Intelligence Scale for Adults – WAIS-III) and the Trail Making Test. Results: the T.O.V.A was little influenced by age or education, but was influenced by gender. The correlations between some T.O.V.A variables and the Digit Symbol and Trail Making test were weak (r-values between 0.2 and 0.4), but significant (p<0.05). There was no correlation with the Digit Span test. Conclusion: The T.O.V.A showed good applicability and proved adequate for evaluating attentional processes in adults.
Key words: attention, computerized evaluation, adults, elderly.
APLICABILIDADE DO TESTE DE VARIÁVEIS DE ATENÇÃO – T.O.V.A EM ADULTOS BRASILEIROS
RESUMO. O funcionamento da atenção é complexo, função primordial em diversos processos cognitivos e de grande interesse para a neuropsicologia. O Teste de Variáveis de Atenção (T.O.V.A) é um teste computadorizado de desempenho contínuo que avalia alguns componentes de atenção, como tempo de resposta a um estímulo e erros por desatenção e impulsividade. Objetivo: 1) Avaliar a aplicabilidade do T.O.V.A em adultos brasileiros; 2) Analisar as diferenças de desempenho entre os gêneros, faixas etárias e níveis de escolaridade; 3) Examinar a associação entre as variáveis T.O.V.A e outros testes de atenção e triagem cognitiva. Métodos: O TOVA foi aplicado a 63 adultos saudáveis (24 a 78 anos) submetidos ao Mini-Exame do Estado Mental (MEEM), Montreal Cognitive Assessment (MoCA), Digit Span e Digit Symbol (Wechsler Intelligence Scale for Adults – WAIS-III) e o Trail Making Test. Resultados: T.O.V.A teve pouca influência da idade e escolaridade, mas foi influenciado pelo gênero. As correlações entre algumas variáveis T.O.V.A e o símbolo Digit e o teste Trail Making foram fracas (valores de r entre 0,2 e 0,4), mas significativas (p <0,05). Não houve correlação com o teste Digit Span. Conclusão: T.O.V.A apresentou boa aplicabilidade e foi adequado para avaliar os processos de atenção em adultos.
Palavras-chave: atenção, avaliação informatizada, adultos, idosos.
I
n most models, attention is portrayed as a complex system that allows the individual to filter relevant and irrelevant information,maintain and process mental representa-tions, and monitor and modulate responses to stimuli. Attention, therefore, usually refers
This study was conducted at the Department of Neurology, University of São Paulo, São Paulo, SP, Brazil.
1Department of Neurology, University of São Paulo, São Paulo, SP, Brazil. 2Heart Institute (Incor), Hypertension Unit, University of São Paulo, São Paulo, SP, Brazil. 3Department of Physiology, Faculty of Medicine, Agostinho Neto University, Luanda, Angola.
Cláudia Maia Memória. Neurology Department / Faculty of Medicine of the University of São Paulo – Av. Dr. Enéas Carvalho de Aguiar Avenue, 155 – 05403-000 São Paulo SP – Brazil. E-mail: [email protected]
Disclosure: The authors report no conflicts of interest.
to a multifactorial set of processes that goes beyond the simple ability to encode information. Attention includes several processes, such as sensory selection (filter, focus, alternation), response selection (response intention, initiative and inhibition, active change and executive control), and attentional capacity (effort, sustained per-formance, alertness).1 Attentional deficits can therefore
affect one or more of these processes and can be classi-fied according to their particularities.
Frequently, the Digit Span,2,3 a subtest of the
Wechsler Scale is used to assess auditory-verbal atten-tion. However, it is a short-term and uninformative task on fatigue, inhibition and attentional oscillations throughout the execution time. To take into account these aspects, Continuous Performance Tests (CPT,) such as the Test of Variables of Attention (T.O.V.A)4 would be
more appropriate for examining sustained attention and providing data on the other parameters.
The T.O.V.A is a 21-minute computerized test in which a simple geometric stimulus is used to measure the response to visual stimuli. It can be used in serial evaluations and assists in the detection of attention disorders. The test involves the presentation of two distinct situations: the display of a target stimulus (a small square in the upper part presented within a larger square), upon which the individual must press the microswitch, and the presence of a different stimulus (a small square in the lower part within a larger square) for which the subject must not press the microswitch. Being computerized battery, it offers advantages such as ease of application and handling, less influence of the exam-iner, automatic generation of report with results, and accuracy in recording of reaction time (±1 millisecond).
This test can also be used to monitor the response to drug treatment because it has negligible test-retest effects.4 US standards for the T.O.V.A are based on
data from 1,596 individuals aged 4 to 80 years, with a shorter version of the test available for pre-school chil-dren.4 However, few studies have been performed on the
T.O.V.A in adults.
Additionally, the test is expected to be little influ-enced by education because the instructions and stimuli involved in the test are simple. The test has been mainly used as a clinical outcome variable for interventions aimed at reducing symptoms in ADHD5 while few
stud-ies have used it as a diagnostic tool for attention deficit in adults.6,7
No studies conducted in Brazil on the T.O.V.A were found. Thus, the objectives of the present study were: 1) to evaluate the applicability of the T.O.V.A in Brazil-ian adults without chronic diseases; 2) to investigate
whether the T.O.V.A scores vary between the sexes, age groups and education; and 3) to investigate the associa-tion between the scores generated by the T.O.V.A and other attention tests.
METHODS
Participants
The sample consisted of 63 adults with a mean age of 52.05 (±14.43) years and a mean educational level of 13.13 (±4) years. Participants were individuals included in the CHEST-BR study,8 in which subjects without
cardiovascular disease underwent a complete clinical evaluation, laboratory tests, ergometric test and echo-cardiogram. Subjects were included in the study if no change was evident on these assessments. Participants who were hypertensive, diabetic, smokers or in chronic use of alcohol were excluded.
Instruments
TEST OF VARIABLES OF ATTENTION (T.O.V.A)
The test starts with a three-minute training phase,4
where the participant is instructed to press the micro-switch in the presence of a target stimulus.
The participant is not informed about the struc-ture of the test and usually does not know that the test consists of two parts: during the first half of the test (lasting 10 minutes), the target appears in 22.5% of the trials. During the second half (same length of time), the target appears in 77.5% of the trials. The increas-ing frequency of the target implies that the examinee must respond more quickly. When the subject does not respond to the target, this response is called an error of omission and is a measure of inattention; and when the examinee responds to a non-target, the response is called a commission error and considered a measure of impulsiveness.4,9 Thus, the first half of the test is
designed to maximize the demand for sustained atten-tion (and induces omission errors), while the second half calls for inhibitory control (and induces commission errors).10
In addition to the primary variables, the T.O.V.A generates secondary variables that include variability in response time (consistency), response time, the D-prime, and an attentional performance score. The measures are outlined below:
the actual number of targets displayed from the number of anticipatory responses to the targets.
• Commission Errors: considered a measure of impulsivity or behavioral disinhibition. The subject is unable to inhibit the response and incorrectly responds to a non-target stimulus, pressing the button when a non-target is displayed. The commission score is cal-culated as the ratio between the number of incorrect responses to the non-targets and the subtraction of the actual number of non-targets presented from the num-ber of anticipatory responses made to non-target stimuli.
• Response time variability: a measure of time differ-ences for correct responses given by the subject, denot-ing the consistency in the speed of correct responses. The faster the subject, the lower the variability.
• Response time: the average time a subject takes to respond correctly to a target by pressing the micro-switch from the moment the target is presented. The response time score is the average of the response times (correct responses), calculated as the sum of all times divided by the number of correct responses to the tar-get, expressed in milliseconds (ms) for each quartile, half and total time of the test.
• D-prime: a response sensitivity score that reflects the ratio between the rate of correct responses and the rate of “false alarm”. It is considered a measure of decrease in performance over time, that is, the rate of decline of performance throughout the task. This mea-sure is derived from the Signal Detection Theory and helps to distinguish individuals without impairment from those diagnosed with attention disorders.11 The
score reflects the accuracy in discriminating between target (signal) and non-target (noise) and is interpreted as a measure of perceptual sensitivity.
• Attentional Performance Index: the result of the comparison of the performances of the studied subjects on the T.O.V.A versus an American sample identified as having ADHD. Positive indices are suggestive of no attention impairment. The formula used to derive the score is as follows: response time in z score (1st half of the test) + D-prime in z score (2nd half of the test) + variability in response time in z score (total). In sub-jects with ADHD, the index is expected to be negative, although not specific to this disorder because attentional impairments may be present in various conditions.4
The T.O.V.A has some criteria invalidating the test run: response time or variability equal to zero in any quartile of the test, interruption of the test by the exam-inee, excessive anticipatory responses and 100% omis-sion/commission errors in any quartile of the test. More information is available on the www.tovatest.com.
Each subject completed the T.O.V.A, along with the following tests: Digit Span and Digit Symbol - subtests of the Wechsler Intelligence Scale for Adults,2 Trail
Making Test - TMT Parts A and B,12 Verbal Fluency Test
(animals),13 Boston Naming Test,14 Rey Auditory Verbal
Learning Test – RAVLT,15 Rey’s Complex Figure,16 Brief
Cognitive Screening Battery,17 Clock Drawing Test.18 The
above tests were chosen in congruence with the recom-mendations of the National Institute of Neurological Dis-orders and Stroke - Canadian Stroke Network Vascular Cog-nitive Impairment Harmonization Standards,19 but only
the neuropsychological tests related to the attentional processes and measures of global cognition were shown in the results.
Procedures
The local ethics committee approved the protocol, and all participants agreed by signing the Informed Consent Form (ICF).
The clinical evaluation with ergometric test, echo-cardiogram and application of the neuropsychological battery lasted about 150 minutes and was performed at the INCOR. Cardiologists were responsible for the clini-cal evaluation. The neuropsychologiclini-cal battery lasted about 90 minutes and was applied by neuropsycholo-gists. Although the T.O.V.A was self-administered, the examiner remained present for any unforeseen events.
Statistical analyses
The sample was divided between men and women to assess whether there were gender differences in the T.O.V.A variables. Two age groups were then created to differentiate young/middle-aged adults from elderly subjects (<60 years and ≥60 years), and two educational levels (≤11 years and >11 years of education, usually corresponding to complete secondary education). The Mann-Whitney test was used to analyze the differences between age and education groups, given none of the variables had a normal distribution, as tested with the Shapiro-Wilks test. Additionally, Spearman correlations were performed to evaluate the association between T.O.V.A variables and the other attention and global cognition tests. R software version 3.4.3 was used for statistical analyses. Statistical significance was set at 5%.
RESULTS
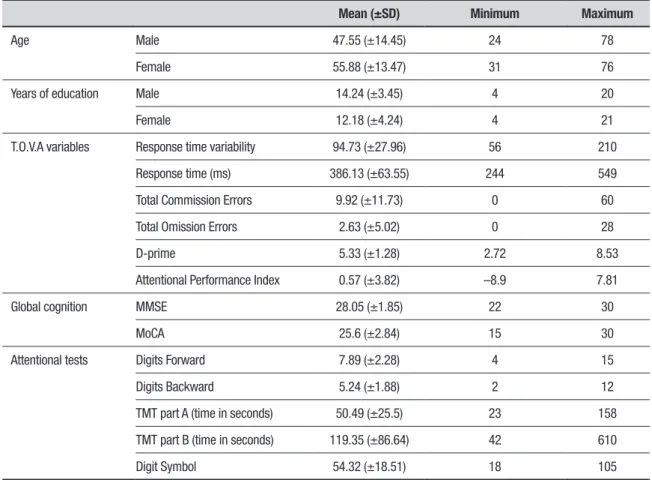
Table 1. Demographic data, T.O.V.A variables and other cognitive tests for the total sample (n=63), presenting means and standard devia-tions with value ranges.
Mean (±SD) Minimum Maximum
Age Male 47.55 (±14.45) 24 78
Female 55.88 (±13.47) 31 76
Years of education Male 14.24 (±3.45) 4 20
Female 12.18 (±4.24) 4 21
T.O.V.A variables Response time variability 94.73 (±27.96) 56 210
Response time (ms) 386.13 (±63.55) 244 549
Total Commission Errors 9.92 (±11.73) 0 60
Total Omission Errors 2.63 (±5.02) 0 28
D-prime 5.33 (±1.28) 2.72 8.53
Attentional Performance Index 0.57 (±3.82) –8.9 7.81
Global cognition MMSE 28.05 (±1.85) 22 30
MoCA 25.6 (±2.84) 15 30
Attentional tests Digits Forward 7.89 (±2.28) 4 15
Digits Backward 5.24 (±1.88) 2 12
TMT part A (time in seconds) 50.49 (±25.5) 23 158
TMT part B (time in seconds) 119.35 (±86.64) 42 610
Digit Symbol 54.32 (±18.51) 18 105
SD: standard deviation; p-values refer to the Spearman correlation test; MMSE: Mini Mental State Examination; MoCA: Montreal Cognitive Assessment; TMT: Trail Making Test.
A difference between the sexes was observed on the T.O.V.A for the variables Response Time and Omission Errors (p<0.05) (Table 2).
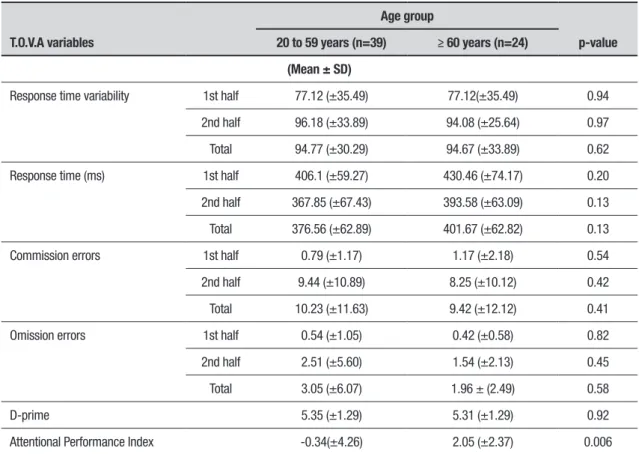
Table 3 shows that there was no significant differ-ence between the age groups examined, except for the Attentional Performance Index (p<0.05).
There were no significant differences on the T.O.V.A in relation to the educational levels (p>0.05) (Table 4).
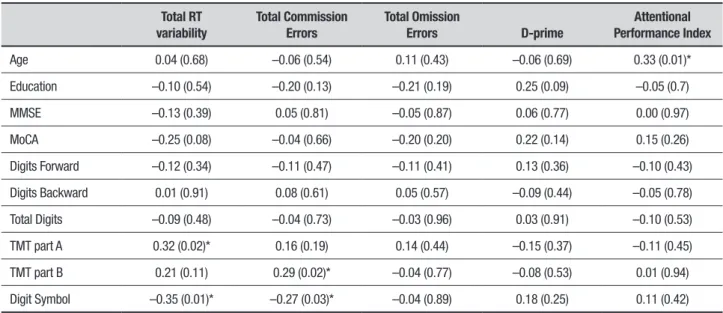
The analyses indicated significant, although weak, correlations (r-values from 0.2 to 0.4) between the Gen-eral Attention Index and age; between Total Response Time Variability and scores on the Trail Making Test part A and Digit Symbol; and between Total Commis-sion Errors and scores on the Trail Making Test part B and Digit Symbol (Table 5).
DISCUSSION
The objective of the present study was to evaluate the applicability of the T.O.V.A in Brazilian adults without chronic diseases and to examine their scores on vari-ables such as sex, age group and education. The asso-ciation between the scores generated by the T.O.V.A and
other attention tests was also examined. The results indicated that, on most variables, the T.O.V.A was little influenced by age or education. For some specific measures (Response Time and Omission Errors), there were significant differences between the sexes.
In the original T.O.V.A standardization study,4 the
test was applied to a sample of 250 adults aged 20-89 years and differences between the sexes were observed. Men were faster in response time and made more omis-sion and commisomis-sion errors. This finding was partially replicated in our study, as women were significantly slower in response time, but made more omission errors than men. These divergent findings may be explained by the fact that, in the present sample, the women were older than the men. Future studies are needed to address this apparent inconsistency in the TOVA differences related to sex.
In a review on continuous performance tasks,20 half
Table 2. Performance on T.O.V.A variables by sex (n=63).
T.O.V.A variables
Sex
p-value
Male (n=29) Female (n=34)
Response time variability 1st half 75.07 (±34.06) 72.76 (±19.83) 0.67
2nd half 90.55 (±21.48) 99.5 (±36.78) 0.60
Total 91.17 (±21.48) 97.76 (±32.51) 0.64
Response time (ms) 1st half 388.66 (±53.29) 438.18 (±67.63) 0.001
2nd half 355.55 (±68.43) 396.50 (±59.49) 0.014
Total 363 (±62.28) 405.85 (±58.54) 0.007
Commission errors 1st half 1 (±1.1) 0.88 (±1.98) 0.074
2nd half 9.38 (±11.74) 8.65 (±9.56) 1
Total 10.38 (±12.51) 9.53 (±11.74) 0.73
Omission errors 1st half 0.38 (±0.73) 0.59 (±1.02) 0.36
2nd half 1.31 (±3.11) 2.85 (±5.52) 0.01
Total 1.69 (±3.43) 3.44 ± (5.99) 0.02
D-prime 5.66 (±1.21) 5.05 (±1.29) 0.059
Attentional Performance Index 0.69 (±3.21) 0.43 (±4.49) 0.927
ms: milliseconds. p-values refer to the Mann-Whitney test.
Table 3. Performance on T.O.V.A variables by age group (n=63).
T.O.V.A variables
Age group
p-value
20 to 59 years (n=39) ≥ 60 years (n=24)
(Mean ± SD)
Response time variability 1st half 77.12 (±35.49) 77.12(±35.49) 0.94
2nd half 96.18 (±33.89) 94.08 (±25.64) 0.97
Total 94.77 (±30.29) 94.67 (±33.89) 0.62
Response time (ms) 1st half 406.1 (±59.27) 430.46 (±74.17) 0.20
2nd half 367.85 (±67.43) 393.58 (±63.09) 0.13
Total 376.56 (±62.89) 401.67 (±62.82) 0.13
Commission errors 1st half 0.79 (±1.17) 1.17 (±2.18) 0.54
2nd half 9.44 (±10.89) 8.25 (±10.12) 0.42
Total 10.23 (±11.63) 9.42 (±12.12) 0.41
Omission errors 1st half 0.54 (±1.05) 0.42 (±0.58) 0.82
2nd half 2.51 (±5.60) 1.54 (±2.13) 0.45
Total 3.05 (±6.07) 1.96 ± (2.49) 0.58
D-prime 5.35 (±1.29) 5.31 (±1.29) 0.92
Attentional Performance Index -0.34(±4.26) 2.05 (±2.37) 0.006
Table 4. Performance on T.O.V.A variables by educational level (n=63).
T.O.V.A variables Schooling ≤ 11 (n=27) Schooling > 11 (n=36) p-value
Mean (±SD)
Response time variability 1st half 76.74 (±35.38) 71.64 (±18.96) 0.95
2nd half 96.74 (±37.74) 94.36 (±24.9) 0.66
Total 96.89 (±34.3) 93.11 (±22.46) 0.98
Response time (ms) 1st half 420.15 (±72.77) 411.81 (±72.77) 0.79
2nd half 376.33 (±59.29) 378.64 (±72.24) 0.96
Total 386.04 (±60.02) 386.19 (±66.93) 0.92
Commission errors 1st half 1.26 (±2.12) 0.69 (±1.09) 0.17
2nd half 10.3 (±10.43) 8 (±10.66) 0.17
Total 11.56 (±12.07) 8.69 (±11.48) 0.13
Omission errors 1st half 0.67 (±1.11) 0.36 (±0.68) 0.24
2nd half 2.78 (±6.05) 1.67 (±3.13) 0.30
Total 3.44 (±6.53) 2.03 (±3.47) 0.27
D-prime 5.02 (±1.18) 5.56 (±1.32) 0.09
Attentional Performance Index 0.87 (±4.16) 0.34 (±3.59) 0.30
ms: milliseconds; p-value refers to the Mann-Whitney test.
Table 5. Spearman correlation (p-value) between T.O.V.A variables and age, education, cognitive traits and attention tests.
Total RT variability
Total Commission Errors
Total Omission
Errors D-prime
Attentional Performance Index
Age 0.04 (0.68) –0.06 (0.54) 0.11 (0.43) –0.06 (0.69) 0.33 (0.01)*
Education –0.10 (0.54) –0.20 (0.13) –0.21 (0.19) 0.25 (0.09) –0.05 (0.7)
MMSE –0.13 (0.39) 0.05 (0.81) –0.05 (0.87) 0.06 (0.77) 0.00 (0.97)
MoCA –0.25 (0.08) –0.04 (0.66) –0.20 (0.20) 0.22 (0.14) 0.15 (0.26)
Digits Forward –0.12 (0.34) –0.11 (0.47) –0.11 (0.41) 0.13 (0.36) –0.10 (0.43)
Digits Backward 0.01 (0.91) 0.08 (0.61) 0.05 (0.57) –0.09 (0.44) –0.05 (0.78)
Total Digits –0.09 (0.48) –0.04 (0.73) –0.03 (0.96) 0.03 (0.91) –0.10 (0.53)
TMT part A 0.32 (0.02)* 0.16 (0.19) 0.14 (0.44) –0.15 (0.37) –0.11 (0.45)
TMT part B 0.21 (0.11) 0.29 (0.02)* –0.04 (0.77) –0.08 (0.53) 0.01 (0.94)
Digit Symbol –0.35 (0.01)* –0.27 (0.03)* –0.04 (0.89) 0.18 (0.25) 0.11 (0.42)
tests lasting more than 40 minutes. Other studies cited in this review21,22 found similar performance for
sus-tained attention among young and old people, depend-ing on the reference variable (e.g. response time, rate of correct responses, type of stimulus used).
The authors of the T.O.V.A affirm that the test is slightly influenced by education.4 Possibly, this is the
case because of the low complexity of the task and because it uses a non-language dependent stimulus.23
The Trail Making Test, Digit Span and Digit Symbol tests are subject to greater influence of education;24 the
low influence of education on the T.O.V.A in our find-ings may represent an advantage in relation to other instruments.
The Attentional Performance Index reflects the comparative performance of the subject relative to an American clinical sample with ADHD, where positive indices are suggestive of no attention impairment. A proportion (36.5%) of the present sample had a negative Attentional Performance Index. The criterion adopted to define our population as healthy was the absence of chronic diseases (such as hypertension and diabetes). However, conditions associated with attentional impair-ments such as traumatic brain injury, depression, anxi-ety, substance abuse, medication, learning disorders and sleep disorders,4 were not fully controlled. Moreover,
some degree of attentional deficit is possible without necessarily manifesting as major functional losses. In a previously published study involving the present study sample, a similar percentage of individuals had scores suggestive of cognitive decline, varying according to the parameter used (7% for the MMSE, 25% on the MoCA, and 24% on the neuropsychological evaluation).25
Consistent with previous studies,10,26 the correlations
of T.O.V.A variables with tests that evaluate attention were negligible or weak. Among those with statistical significance, the performance on the Trail Making Test Part A,24 whose measures are more related to speed and
sustained attention, correlated positively with the
vari-able that expresses consistency in response time (vari-ability) and negatively with the Digit Symbol test (a measure of psychomotor speed). Increased variability in the response time and in Trail Making Test scores reflect slower performance of the subject.
There was an association of the variable Commission Errors with the Digit Symbol test and the Trail Mak-ing Test Part B (negative and positive, respectively). Both attentional tests and commission errors are tasks requiring flexibility and inhibitory control.
However, no significant correlations were observed on the Digits Span test, a traditional test that evaluates attentional amplitude and cognitive flexibility, even on separate analysis of forward and backward order or total score (calculated as the sum of the two parts). In sum-mary, the correlation analyses suggest that the T.O.V.A and Digit Span test assess different aspects of atten-tion; the T.O.V.A has a greater contribution of alertness than other aspects related to the Digit Span test, such as operational memory.24
In conclusion, the T.O.V.A showed good applicability and was adequate for evaluating attentional processes in adults. Because this is a computerized test, it offers advantages such as precision of the measures evalu-ated, number of variables generevalu-ated, and automation of results. Furthermore, the test proved to be little influ-enced by education or age.
The study had limitations related to the small size of the sample and the fact that a specific instrument to track attention complaints was not applied. How-ever, the Attention Performance Index suggested that a percentage of the participants may present attentional changes according to the T.O.V.A. Future studies should be performed with more comprehensive samples that allow generalizality to other populations.
Author contributions. All the authors have contributed to
the manuscript preparation and conceptualization and agreed to Dementia & Neuropsychologia submission.
REFERENCES
1. Miller EK, Cohen JD. An Integrative Theory Of Prefrontal Cortex Function. Annu Rev Neurosci. 2001;24:167-202.
2. Wechsler D. Manual para Administração e Avaliação, Versão Bras.: Elizabeth do Nascimento. São Paulo: Casa do Psicólogo; 2004. 3. Mesquita C, Coutinho G, Mattos, P. Perfil neuropsicológico de adultos
com queixas de desatenção: diferenças entre portadores de TDAH e controles clínicos. Rev Psiq Clín. 2010;37(5):212-5.
4. Leark RA, Dupuy TR, Greenberg LM, Kindschi CL, Hughes SJ. T.O.V.A. professional manual: Test of Variables of Attention Continuous Perfor-mance Test. Los Alamitos, CA: The T.O.V.A Company; 2016. 5. Cowley B, Holmström É, Juurmaa K, Kovarskis L, Krause CM. Computer
Enabled Neuroplasticity Treatment: A Clinical Trial of a Novel Design for Neurofeedback Therapy in Adult ADHD. Front Hum Neurosci. 2016;10:205.
6. Grane VA, Endestad T, Pinto AF, Solbakk AK. Attentional control and subjective executive function in treatment-naive adults with Attention Deficit Hyperactivity Disorder. PLoS One. 2014; 9(12): e115227. 7. Parasnis I, Samar VJ, Berent GP. Deaf adults without attention deficit
hyperactivity disorder display reduced perceptual sensitivity and elevated impulsivity on the Test of Variables of Attention (T.O.V.A.). J Speech Lang Hear Res. 2003;46(5):1166-83.
8. Antelmi, I, Chuang EY, Grupi CJ, Latorre MRDO, Mansur AJ. Heart rate recovery after treadmill electrocardiographic exercise stress test and 24-hour heart rate variability in healthy individuals. Arq Bras Cardiol. 2008; 90(6):380-5.
10. Greenberg LM, Waldman ID. Developmental normative data on the test of variables of attention (T.O.V.A.). J Child Psychol Psychiatry. 1993;34(6): 1019-30.
11. Mussgay L, Hertwig R. Signal detection indices in schizophrenics on a visual, auditory, and bimodal continuous performance test. Schizoph Res. 1990;3:303-10.
12. Ricker JH, Axelrod BN. Analysis of an oral paradigm for the Trail Making Test. Assessment 1994;1:47-51.
13. Brucki, SMD, Rocha MSG. Category fluency test: effects of age, gender and education on total scores, clustering and switching in Brazilian Portuguese – speaking subjects. Braz J Med Biolog Res. 2004;37(12): 1771-7.
14. Radanovic M, Mansur LL, Scaff M. Normative data for the brazilian population in the Boston diagnostic aphasia examination: influence of schooling. Braz J Med Biol Res. 2004;37(11):1731-8.
15. Malloy-Diniz LF, Cruz MF, Torres VM, Cosenza RM. O teste de aprendi-zagem auditivo-verbal de Rey: normas para uma população brasileira. Rev Bras Neurol. 2000;36(3):79-83.
16. Rey, A. Figuras Complexas de Rey: teste de cópia e de reprodução de memória de figuras Geométricas Complexas. Manual. In: Oliveira, M.S. (org), Revisão técnica. Rey T, Franco LC (tradutoras). São Paulo: Casa do Psicólogo; 1998.
17. Nitrini R, Caramelli P, Porto CS, Fichman HC, Formigoni AP, Carthery-Goulart MT et al. Brief cognitive battery in the diagnosis of mild Alzheim-er’s disease in subjects with medium and high levels of education. Dement Neuropsychol. 2007;1:32-6.
18. Schulman K, Shedletsky R, Silver I. The challenge of time: clock-drawing and cognitive function in old age. Int J Geriatr Psychiatry 1986;1:135-41. 19. Hachinski V, Iade C, Petersen RC, Breteler MM, Nyenhuis DL, Black SE,
et al. National Institute of Neurological Disorders and Stroke – Canadian Stroke Network Vascular Cognitive Impairment Harmonization Stan-dards. Stroke 2006;37:2220-41.
20. Staub B, Doignon-Camus N, Després O, Bonnefond A. Sustained atten-tion in the elderly: What do we know and what does it tell us about cognitive aging? Ageing Res Rev. 2013;12:459-68.
21. Bunce D, Sisa L. Age differences in perceived workload across a short vigil. Ergonomics. 2002;45(13):949-60.
22. Jackson JD, Balota DA. Mind-wandering in younger and older adults: converging evidence from the sustained attention to response task and reading for comprehension. Psychol Aging 2011;27(1):106-19. 23. Forbes GB. Clinical utility of the Test of Variables of Attention (T.O.V.A.)
in the diagnosis of attention-deficit/hyperactivity disorder. J Clin Psychol. 1998;54(4):461-7.
24. Strauss E, Sherman EMS, Spreen O. A compendium of neuropsycho-logical tests: Administration, Norms, and Commentary. 3rd ed. New York: Oxford University Press; 2006.
25. Muela HC, Costa-Hong VA, Yassuda MS, Moraes NC, Memória CM, Machado MF, et al. Hypertension Severity Is Associated With Impaired Cognitive Performance. J Am Heart Assoc. 2017. doi: 10.1161/JAHA. 116.004579.