Submitted8 March 2016 Accepted 8 December 2016 Published19 January 2017
Corresponding author Lana Garmire,
Academic editor Jun Chen
Additional Information and Declarations can be found on page 14
DOI10.7717/peerj.2888
Copyright 2017 Zhu et al.
Distributed under
Creative Commons CC-BY 4.0
OPEN ACCESS
Detecting heterogeneity in single-cell
RNA-Seq data by non-negative matrix
factorization
Xun Zhu1,2, Travers Ching1,2, Xinghua Pan3, Sherman M. Weissman3and Lana Garmire1
1Epidemiology Program, University of Hawaii Cancer Center, Honolulu, HI, United States
2Molecular Biosciences and Bioengineering Graduate Program, University of Hawaii at Manoa, Honolulu,
United States
3Department of Genetics, Yale University, New Haven, CT, United States
ABSTRACT
Single-cell RNA-Sequencing (scRNA-Seq) is a fast-evolving technology that enables the understanding of biological processes at an unprecedentedly high resolution. However, well-suited bioinformatics tools to analyze the data generated from this new technology are still lacking. Here we investigate the performance of non-negative matrix factorization (NMF) method to analyze a wide variety of scRNA-Seq datasets, ranging from mouse hematopoietic stem cells to human glioblastoma data. In comparison to other unsupervised clustering methods including K-means and hierarchical clustering, NMF has higher accuracy in separating similar groups in various datasets. We ranked genes by their importance scores (D-scores) in separating these groups, and discovered that NMF uniquely identifies genes expressed at intermediate levels as top-ranked genes. Finally, we show that in conjugation with the modularity detection method FEM, NMF reveals meaningful protein-protein interaction modules. In summary, we propose that NMF is a desirable method to analyze heterogeneous single-cell RNA-Seq data. The NMF based subpopulation detection package is available at: https:
//github.com/lanagarmire/NMFEM.
SubjectsBioinformatics, Genomics
Keywords Single-cell, RNA-Seq, Heterogeneity, Non-negative matrix factorization, Modularity, Clustering, Subpopulation, Single cell sequencing, Single cell, Feature gene
INTRODUCTION
the hypothesis of inter-blastomere differences in 2- and 4-cell mouse embryos (Biase, Cao & Zhong, 2014). Indeed, scRNA-Seq has already made profound impacts on our understanding of the diversity, complexity, and irregularity of biological activities in cells. It will continue to provide more transformative insights in the near future (Pan, 2014; Poirion et al., 2016).
However, relative to the experimental technology, the bioinformatics tools to analyze scRNA-Seq data are still lagging behind. Recently, various methods have been developed to detect subpopulations (or sub-clusters) within a group of cells using scRNA-Seq data, including scLVM (Buettner et al., 2015), BackSpin (Zeisel et al., 2015), PAGODA (Fan et al., 2016), and SEURAT (Macosko et al., 2015). These new computational tools are evidence that understanding scRNA-Seq heterogeneity is of paramount importance. Moreover, once the subpopulations are identified, it is very crucial to find the gene expression signatures that are characteristic of each subpopulation (subclass), in order to reveal the subline biological mechanisms.
Population-level RNA-Seq differential expression analysis, such as DESeq2 (Love, Huber & Anders, 2014) and edgeR (Robinson, McCarthy & Smyth, 2010), are designed to compare pre-labeled classes. However, it is questionable if they are desirable to identify subpopulations in scRNA-Seq data. Recently, a couple of methods have been reported in the scRNA-Seq analysis domain (Brennecke et al., 2013;McDavid et al., 2013;Kharchenko, Silberstein & Scadden, 2014). For example, a statistical variance model based on gamma distribution was developed to account for the high technical noise occurring in scRNA-seq experiments, such that genes with high squared correlation of variations (CV2) relative to mean expression were identified as ‘‘significantly differentially expressed’’ between two conditions (Brennecke et al., 2013). Another Bayesian approach was proposed for scRNA-Seq differential expression analysis, by utilizing a probabilistic model of expression-magnitude distortions that were commonly observed in noisy single-cell experiments (Kharchenko, Silberstein & Scadden, 2014). This method later was used for classification of sensory neurons using scRNA-Seq (Usoskin et al., 2014). On the other hand, an R package, Monocle, was developed recently for single-cell lineage construction (Trapnell et al., 2014).
(subpopulations); (3) identification of protein-protein interaction modules around the important genes, based on a modified implementation of Functional Epigenetic Modules (FEM) (Jiao, Widschwendter & Teschendorff, 2014). We organized the NMF workflow into a streamlined modularity detection R package called NMFEM.
MATERIALS & METHODS
Datasets
Five scRNA-Seq datasets are used in this study. For the first four datasets that don’t have UMI, normalized fragments per kilo-base per million reads (FPKM) is calculated and used as input to the clustering methods. For the last dataset (iPSC) where UMI technique is adopted, we used the author provided ‘‘molecule counts’’ as the input.
Mouse lung epithelial cells
scRNA-Seq data were retrieved from the original 201 samples of lung distal epithelial cells of embryonic mouse (GSE52583) (Treutlein et al., 2014). The original dataset contains cells collected from four time points: E14.5, E16.5, E18.5 and AT2. After filtering (the procedure is detailed in the ‘‘Sample and Gene Filtering’’ section below), 201 single-cell samples and 4,594 genes are used in downstream analysis. The closest pair of groups, which consists of 45 cells from E14.5 and 27 cells from E16.5 was used for unsupervised clustering comparison.
Mouse HSCs and MPP1s
scRNA-Seq data were extracted from mouse hematopoietic stem cells (HSCs) and early multipotent progenitors (MPP1s). The data were pre-processed into the format of a FPKM expression profile (Table S1), which include 59 HSCs and 53 MPP1 single cells. After filtering, 95 samples and 2,887 genes were used in downstream analysis.
Glioblastoma
scRNA-Seq data were retrieved from the original 875 samples of glioblastoma tumor cells in 5 patients (MGH26, MGH28, MGH29, MGH30, and MGH31), along with population and cell line controls (GSE57872) (Patel et al., 2014). After filtering, 419 single-cell samples and 6,996 genes were used in downstream analysis. The closest pair of groups, which consists of 80 cells from patient MGH29 and 73 cells from MGH31 was used for unsupervised clustering comparison.
Mouse bone marrow
scRNA-Seq data were extracted from mouse macrophage DC progenitors (MDPs), common DC progenitors (CDPs), and Pre-DCs (GSE60781) (Schlitzer et al., 2015). We used the FPKM table provided by the authors. After filtering, 242 single-cell samples and 5,489 genes are used in downstream analysis. The closest pair of groups, which consists of 59 MDPs and 89 CDPs was used for the unsupervised clustering comparison.
Human induced pluripotent stem cell lines
random sequence UMI were attached to the transcripts in order to avoid amplification bias. We used the molecule counts provided by the authors. After filtering, 864 single-cell samples and 9,750 genes are used in downstream analysis. The closest pair of groups, which consists of 288 cells from individual NA19098 and 288 cells from individual NA19239 was used for the unsupervised clustering comparison.
Single-cell RNA-Seq analysis
Read alignment
We downloaded the public datasets from NCBI The Gene Expression Omnibus (GEO) database (Edgar, Domrachev & Lash, 2002;Barrett et al., 2013), and retrieved the SRA files from The Sequence Read Archive (SRA) (Leinonen et al., 2011). We used thefastq-dump
tool from SRA Toolkit to convert the SRA files into two pair-end FASTQ files. We applied
FastQC for quality control and TopHat2 (Kim et al., 2013) for alignment to the reference genomes. The ready-to-use genome sequences and annotation files were downloaded from Illumina iGenomes page (http://support.illumina.com/sequencing/sequencing_software/
igenome.html). For human build hg19 was used, and for mouse genome build mm10 was
used (Karolchik et al., 2014).
Read counting
We usedfeatureCounts(Liao, Smyth & Shi, 2014) to map and count the aligned BAM files to the RefSeq transcriptomes from the pre-built packages on Illumina iGenome website above. We used the options to count fragments instead of reads; paired-end distance was checked byfeatureCountswhen assigning fragments to meta-features or features. We only took into account of fragments that have both ends aligned successfully and discarded chimeric fragments. Fragments mapped to multiple locations were counted. The command is ‘‘featureCounts -pPBCM –primary -T 6 -a <gtf_ file>-o <output_ file><bam_ file>.’’
Normalization of counts
We used reads per kilo base per million (FPKM) to represent the gene expression level, where the length of each gene was calculated by UCSC RefSeq annotation table, by concatenating all the exons. We normalized the data using DESeq2.
Sample and gene filtering
Samples expressing housekeeping genes with geometric average FPKM lower than 4 were deemed abnormal and removed. Genes that were not expressed at all in over 70% of the cells were removed.
Closest pair identification
The closest pair of groups among the samples is defined as the pair that has the smallest distance between the two groups’ centroids, on the 2-dimentional correlation t-SNE plot. The correlation t-SNE is the t-SNE method (Van der Maaten & Hinton, 2008) performed on the correlation distance between two samplesxandy:
dc x,y
=1−cor x,y
Non-negative matrix factorization (NMF)
We used the R-package implementation of NMF (Gaujoux & Seoighe, 2010) to perform NMF analysis. NMF is mathematically approximated by:A≈WH, whereA(nbym) is the matrix representing the scRNA-Seq profile in this report,W is a slim weight matrix (n
byk, wheren≫k),H is a wide matrix (k bym, wherem≫k), and all three of them are non-negative (Brunet et al., 2004). The column vectors inW are calledmeta-genes, which are higher-level abstraction of the original gene expression pattern. For genei, theloadings
are thekvalues inW at rowi. We used the method ‘‘brunet’’ to solve the approximation ofA, which employs the multiplicative iterative algorithm described by the following rules:
Hau←Hau
P i(WWHiaV)iuiu
P kWka
Wia←Wia
P u
HauAiu
(WH)iu
P vHav
.
The initialization ofHauandWiawas generated as random seed matrices drawn from a uniform distribution within the same range as the entries in the matrixA. Since the starting matrices were randomized, we conducted an average of 30 simulations for each NMF run to obtain the consensus clustering results. We used Kullback–Leibler divergence (KL-divergence) as the distance function, as it has significantly better performance theorized inYang et al. (2011). The clustering results of all possiblek’s (usually ranging from 2 to 5, as higherkvalues require exponentially more time to run) were listed andkwas chosen when the best cophenetic correlation coefficient is achieved, as proposed inBrunet et al. (2004).
D-score
To rank the importance of genes using the two matrices factorized by NMF, we define D-score as follow: The D-score for geneiis defined as:
Di=λWi,1−(1−λ)Wi,2
.
The balancing factorλis determined by the rule that a gene uniformly expressed across all samples should have D-score 0. This score is a slight modification of the gene ranking method using discriminant NMF proposed earlier (Jia et al., 2015).
Other packages used for detecting significant or important genes
DE methods for bulk-level RNA-Seq: we used two most popular bulk-level RNA-Seq methods: DESeq2 and edgeR, to compare on the results of DE genes.
detected DE genes in qPCR results of single cells. We selected the 500 genes with the lowest likelihood ratio testp-value using Hurdle Model provided by the package, as recommended by the authors (McDavid et al., 2013).
Additionally, we experimented if introducing t-SNE, a dimension reduction method that was recently successfully applied to scRNA-Seq, would improve the results of NMF. We used the C++accelerated R-package Rtsne (V 0.10), based on the original C++ implementation (Van der Maaten, 2013).
Module detection package
We used Functional Epigenetic Modules (FEM) R package (Jiao, Widschwendter & Teschendorff, 2014) for module detection. FEM utilizes an expansion algorithm based on the z-score of the expression level, by using a list of seed genes as the starting point. It selects the top modules based onp-values calculated by a Monte Carlo method.
We modified the source code of the FEM package and changed the process of the seed gene selection. Instead of selecting the seed genes based on the z-score of the expression level, we directly plugged in a list of genes as the seed genes, which were generated from each of the compared method for important gene detection.
Measuring the performance of unsupervised clustering methods
Pair-wise Rand measure for clustering between the test and the reference is defined by
R= TP+TN
TP+FP+FN+TN
in which the four quantitiesTP,FP,FN, andTNare cardinals of the four sets of pairs.T/F
means true/false based on the reference, andP/N means positive/negative results from the test. Specifically, a positive result (P) refers to a pair of samples clustered in the same group by the tested method; a true positive (TP) or true negative (TN) result represents the case where the agreements between the test and the reference clustering is reached (Rand, 1971).
Modularity detection and pathway analysis
We used Functional Epigenetic Modules (FEM) package (Jiao, Widschwendter & Teschendorff, 2014) implemented in R for module detection. FEM utilizes SpinGlass
algorithm (Reichardt & Bornholdt, 2006) based on the z-score of the expression level, by using a list of seed genes as the starting points. It selects the top modules based onp-values calculated from a Monte Carlo method. We modified the source code of the package to allow seed genes generated from other methods (NMF, DESeq2, edgeR, SCDE, MAST and Monocle) that detect significant or important genes. In each case, we used top 500 most important genes as the seeds for FEM. We next compared biological meanings of the resulting modules by Gene Ontology (GO) or Kyoto Encyclopedia of Genes and Genomes (KEGG) pathway enrichment analysis, implemented as DAVID Web Service in R (Huang, Sherman & Lempicki, 2008;Huang, Sherman & Lempicki, 2009).
Data and code availability
FASTQ
Files Alignment
Raw Counts
Table
Quality Control
Normalized FPKM
Cell Group Detection Feature
Genes
NMF
Functional Modules
(FEM)
PPI Modules
BAM
Files Counting
Filtered Counts
Table Normalization
NMF
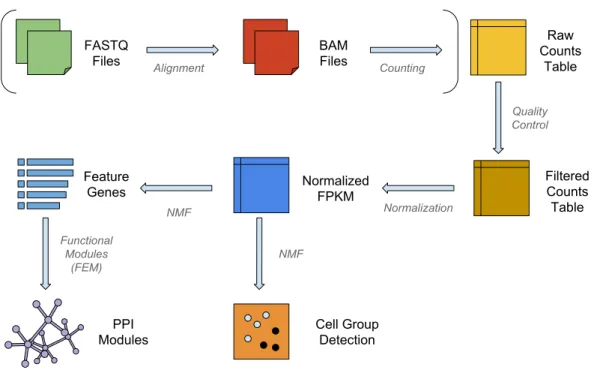
Figure 1 The workflow of NMFEM.The input can be either FASTQ files or a raw counts table. If FASTQ files are used, they are aligned using TopHat and counted using FeatureCounts (steps shown in brackets). The input or calculated raw counts table are filtered by samples and genes, converted into FPKMs using gene lengths, and normalized by samples. We then run NMF method on them to detect groups of cells, and find the feature genes separating the detected groups. Finally, we feed the feature genes as seed genes in FEM, and generate PPI gene modules that contain highly differentially expressed genes.
Omnibus (GEO) repository with accession codesGSE57872,GSE52583,GSE60781, and
GSE77288, respectively. The code used for the package NMFEM can be found athttps:
//github.com/lanagarmire/NMFEM, andhttps://github.com/lanagarmire/NMFEM_extra.
RESULTS
The workflow for a typical single-cell analysis using NMF is shown inFig. 1. Briefly, the pipeline can take raw reads from FASTQ files, align and count them to the transcriptome; or it can use raw count data directly as the input matrix. The input data matrix is then subject to quality control and normalization steps. NMF then operates on the normalized matrix, clusters the samples into subpopulations (or subclasses) and enlists the feature genes that separate the subpopulations. In order to display the insightful biological modules and hotspots in the interactome, the feature genes are then used as seeds for a functional modularity detection algorithm FEM (Jiao, Widschwendter & Teschendorff, 2014).
NMF accurately clusters scRNA-Seq data among similar populations
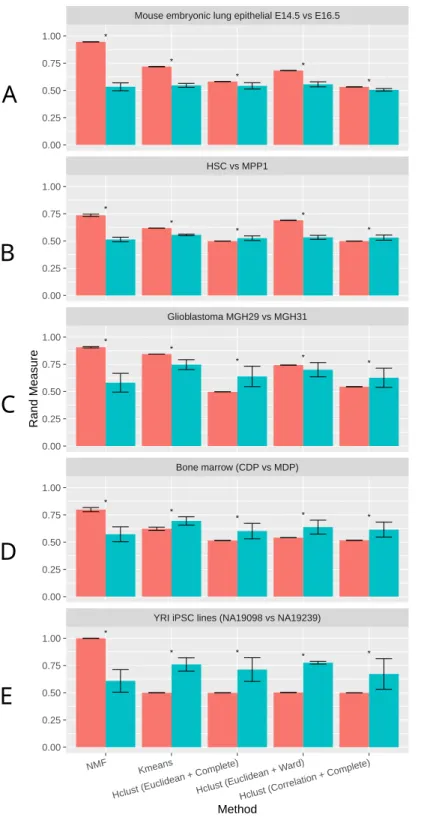
Correlation Metric & Complete Linkage (Correlation+Complete). To draw unbiased conclusions, we tested these clustering methods on five datasets, including a mouse embryonic lung epithelial dataset (Treutlein et al., 2014), a mouse hematopoietic stem cell (HSC) and multipotent progenitor (MPP) cell dataset (Table S1), a human glioblastoma dataset (Patel et al., 2014), a mouse bone marrow dendritic cells dataset (Schlitzer et al., 2015), and lastly a human induced pluripotent stem cell (iPSC) dataset with unique molecular identifier (UMI) counts (Tung et al., 2016). A good clustering method should be able to separate groups that are most similar, therefore we selected the closet two groups in each dataset (Methods).
As shown in Fig. 2, NMF consistently achieves the highest performance among all methods compared, as measured by the Rand Index measure (Methods). Indeed, despite the high level of similarity between each pair of groups, NMF achieves an average Rand measure of 0.88 among the five datasets. In particular, it has an impressive Rand measure of 0.95 in the mouse embryonic lung epithelial dataset (Fig. 2A) and almost 1.00 in the UMI iPSC dataset (Fig. 2E). In contrast, K-means and the three variations of hierarchical clustering (Euclidean+Complete, Euclidean+Ward, and Correlation+Complete) all have significantly (p-value < 0.05) lower averaged Rand measures of 0.66, 0.52, 0.66, and 0.52, respectively (Fig. 2). Most of the wrongly clustered samples by K-means are located between the two clusters in the Euclidean space (Fig. S1A). And hierarchical clustering methods can be heavily affected by individual outliers (Figs. S1B–S1D).
t-SNE is a commonly used dimension reduction method that exaggerates the differences between populations (Van der Maaten & Hinton, 2008), and was previously used in combination with other clustering methods on scRNA-Seq data (Van der Maaten & Hinton, 2008;Bushati et al., 2011;Junker et al., 2014). Therefore, we investigated the effect of t-SNE preprocessing on NMF and other compared methods next. Interestingly, NMF performs significantly worse after t-SNE preprocessing (Fig. 2). We speculate that the more significant decrease in accuracy by NMF is attributed to the fact that NMF is not a distance-based method, and the reduction of features after t-SNE interferes with NMF’s ability to conduct component decomposition more drastically than other methods.
NMF discovers biologically meaningful genes to separate subpopulations
One major advantage of NMF over many other unsupervised clustering methods such as K-means, is its ability to simultaneously identify genes that are characteristic to each subpopulations. We use the discriminative metric called D-score, based the previous rank-2 discriminant NMF implementation (Jia et al., rank-2015). Briefly, D-score is a non-negative number, and the more positive a gene’s D-score is, the more unique this gene is expressed in a subpopulation (Methods). We ranked the top genes in NMF by D-score in the descending order, and sought prior literature reports to validate the utilities of NMF empirically.
* *
* *
*
* *
* *
*
*
* *
* *
*
* *
* *
*
* *
* *
Mouse embryonic lung epithelial E14.5 vs E16.5
HSC vs MPP1
Glioblastoma MGH29 vs MGH31
Bone marrow (CDP vs MDP)
YRI iPSC lines (NA19098 vs NA19239)
0.00 0.25 0.50 0.75 1.00
0.00 0.25 0.50 0.75 1.00
0.00 0.25 0.50 0.75 1.00
0.00 0.25 0.50 0.75 1.00
0.00 0.25 0.50 0.75 1.00
NMF Kmeans
Hclust (Euclidean + Complet
e)
Hclust (Euclidean + Ward)
Hclust (Corre
lation + Complet e)
Method
Rand
Measure
A
B
C
D
E
Surfactant Associated 2(Sfta2) ranked 4th by NMF, was recently identified as an expression QTL (eQTL) gene during early lung development (George et al., 2016). Additionally, we examined top genes differentiating the subsets of AT1 vs. AT2 samples as reported originally (Treutlein et al., 2014). Impressively, the four genes Hopx, Ager, Egfl6, and Sftpc which were marker genes reported in the original report, have ranks of 1st, 12th, 23rd and 27th among the top genes according to NMF.
Similarly, in the HSC vs. MPP1 dataset, many of the top-ranked genes were previously noted as either differentially expressed between the two types of cells or characteristic to one of the two types. For example, Cysteine Rich Protein 1(Crip1), ranked 2nd by NMF D-score, is found to be expressed lower in Hdac3 knock-out cells undergoing HSC and MPP differentiation (Summers et al., 2013).Regulator of G-Protein Signaling 2(Rgs2), ranked 3rd by NMF, was noted to be differentially expressed in HSCs (Phillips et al., 2000;Li & Akashi, 2003;Park et al., 2003).SKI-Like Proto-Oncogene(Skil), ranked 8th by NMF, was shown to play important roles in hematopoietic development (Pearson-White et al., 1995).
For the MGH29 and MGH31 glioblastoma patient data (Patel et al., 2014), although we could not obtain definite clinical subtypes based on the original paper, we did observe that many top genes identified had previously been related to various types of cancers. For example,Chromosome 8 Open Reading Frame 4(C8orf4), ranked 9th by NMF, was identified as ‘‘Thyroid cancer 1(TC1)’’ (Panebianco et al., 2015;Zhang et al., 2015;Zhu et al., 2015;Huang et al., 2016).Epidermal Growth Factor Receptor (EGFR), a gene ranked 31st by NMF, has elevated expression from MGH29 to MGH31. EGFR is a well-known growth factor receptor noted for its critical role on cell division control. Moreover, three top genes EZR (ranked 12th), TUBB (ranked 27th), and RDX (ranked 36th), were shown to be involved in organization and regulation of morphological characteristics of breast cancer cells including cell shape and membrane to membrane docking (Kopp et al., 2016).
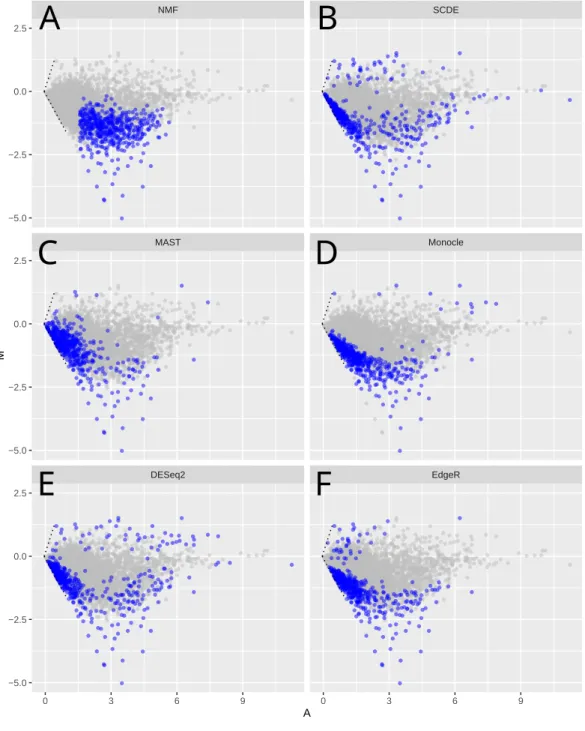
Comparison of important genes from NMF and other methods
To further understand the patterns recognized by NMF, we compared the top ranked genes identified by NMF with the those by other recent scRNA-Seq analysis methods, including Monocle (Trapnell et al., 2014), MAST (McDavid et al., 2013) as well as SCDE (Kharchenko, Silberstein & Scadden, 2014) (Treutlein et al., 2014). In addition, we included DESeq2 and edgeR, two differential expression (DE) methods commonly used in bulk RNA-Seq analysis.
NMF SCDE
MAST Monocle
DESeq2 EdgeR
−5.0
−2.5 0.0 2.5
−5.0
−2.5 0.0 2.5
−5.0
−2.5 0.0 2.5
0 3 6 9 0 3 6 9
A
M
A
B
C
D
E
F
45%, 31%, 27% and 18% genes below FPKM=1, respectively. The same pattern has been observed in the HSC vs. MPP, glioblastoma, and bone marrow dataset (Figs. S4A–S4C). Lowly expressed genes usually have relatively higher levels of noise (Brennecke et al., 2013), evident by comparing the CV2 levels between genes selected by different methods (Fig. S5), and their apparent differential expression may be less reliable.
We further tested whether such intermediately expressed genes identified by NMF are robust and unlikely a result of random sampling. We performed additional runs with each run deliberately dropping one sample from the dataset. The results show that the top 500 genes have over 95% probability to re-appear in this top 500 list, compared to less than 2% probability for any other non-top genes (Fig. S6). The reason that NMF tends to avoid lowly expressed genes is that D-score considers absolute expression level of a gene, rather than the relative expression level (see ‘Methods’). The lower its expression level, the less likely a gene is selected as a feature gene by NMF. On the other hand, very highly expressed genes are more likely to be expressed across all cells. They do not generate large differences in their meta-gene loadings, and will not achieve high D-score as well.
Modularity detection with NMF based framework
We next asked if the important genes detected by NMF convey unique and meaningful biological functions. Previously, a community detection method based on SpinGlass
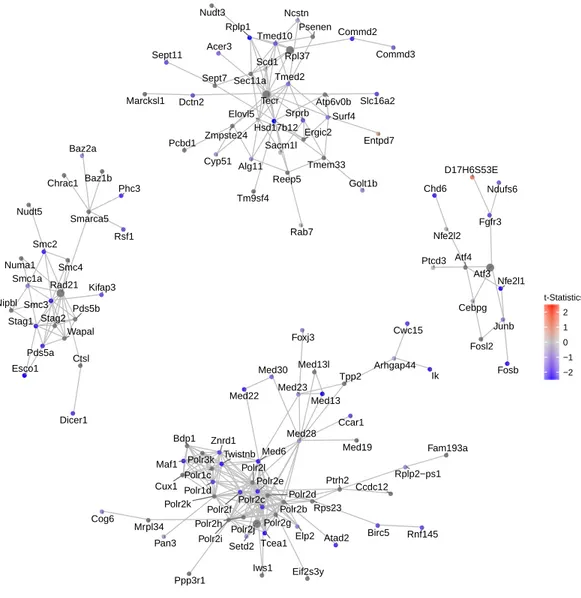
algorithm named FEM has been reported to detect functional modules on protein-protein interaction (PPI) networks (Jiao, Widschwendter & Teschendorff, 2014). Inspired by this approach, we used the 500 top genes selected by NMF as seed genes, and ran vertex-initializedSpinGlassmodels on the PPI network. Modified from FEM, here each vertex (gene) is weighted byt-statistics measuring the expression level (rather than DNA methylation) changes. In order to assess the robustness of the method, we performed random permutations on the data and calculated the p-value for each module. The top four modules for mouse embryonic lung epithelial cells dataset are shown inFig. 4. We conducted the same procedure on HSC vs. MPP1, glioblastoma, and bone marrow datasets (Figs. S4D–S4F).
Consistent with the down-regulating trend of all genes from E14.5 to E16.5 (Fig. 3), these top four modules exhibit strong down-regulation as well. Five hub genes are identified: Rad21, Atf3,Polr2j, Tecr andRpl37, among which Tecr andRpl37 are in the same module. These modules are involved in chromosome structural maintenance (seed Rad21), transcription activation (seedAtf3), RNA polymerase (seedPolr2j), and ribosome component and various enzyme coding genes (Tecr andRpl37). The fact that the top modules are all related to transcription and translation is interesting, as it explains the observed global gene expression down-regulation observed earlier (Fig. 3).
DISCUSSION & CONCLUSIONS
● ● ● ● ● ● ● ● ● ● ● ● ● ● ● ● ● ● ● ● ● ● ● ● ● ● ● ● ● ●● ● ● ● ● ● ● ● ● ● ● ● ● ● ● ● ● ● ● ● ● ● ● ● ● ● ● ● ● ● ● ● ● ● ● ● ● ● ● ● ● ● ● ● ● ● ● ● ● ● ● ● ● ● ● ● ● ● ● ● ● ● ● ● ● ● ● ● ● ● ● ● ● ● ● ● ● ● ● ● ● ● ● ● ● ● ● ● ● ● ● Arhgap44 Atad2 Bdp1 Birc5 Ccar1 Ccdc12 Cog6 Cux1 Cwc15 Eif2s3y Elp2 Fam193a Foxj3 Ik Iws1 Maf1 Med13 Med13l Med19 Med22 Med23 Med28 Med30 Med6 Mrpl34 Pan3 Polr1c Polr1d Polr2b Polr2c Polr2d Polr2e Polr2f Polr2g Polr2h Polr2i Polr2j Polr2k Polr2l Polr3k Ppp3r1 Ptrh2 Rnf145 Rplp2−ps1 Rps23 Setd2 Tcea1 Tpp2 Twistnb Znrd1 Baz1b Baz2a Chrac1 Ctsl Dicer1 Esco1 Kifap3 Nipbl Nudt5 Numa1 Pds5a Pds5b Phc3 Rad21 Rsf1 Smarca5 Smc1a Smc2 Smc3 Smc4 Stag1 Stag2 Wapal Atf3 Atf4 Cebpg Chd6 D17H6S53E Fgfr3 Fosb Fosl2 Junb Ndufs6 Nfe2l1 Nfe2l2 Ptcd3 Acer3 Alg11 Atp6v0b Commd2 Commd3 Cyp51 Dctn2 Elovl5 Entpd7 Ergic2 Golt1b Hsd17b12 Marcksl1 Ncstn Nudt3 Pcbd1 Psenen Rab7 Reep5 Rpl37 Rplp1 Sacm1l Scd1 Sec11a Sept11 Sept7 Slc16a2 Srprb Surf4 Tecr Tm9sf4 Tmed10 Tmed2 Tmem33 Zmpste24 −2 −1 0 1 2 t-Statistics
Figure 4 Network of top 5 modules using the seed genes generated by NMF.Shown are module de-tection results in the FEM package, using the top 500 most important genes detected by NMF inFig. 3. scRNA-Seq data in the mouse lung distal epithelial cell E14.5 vs. E16.5 samples are compared, where the red and blue colors indicate up- and down-regulation of genes in E16.5 relative to E14.5, respectively. The top five modules are selected by thep-values calculated from the internal Monte Carlo method in the FEM package.
the general expression pattern changes may be very suitable for scRNA-Seq subpopulation identification. Previous applications of NMF to fields such as face reorganization (Rajapakse, Tan & Rajapakse, 2004), image compression (Yuan & Oja, 2005;Monga & Mıh¸cak, 2007) and sound decomposition (Smaragdis, 2004), have been proven successful. Here we propose to utilize NMF as a suitable method for scRNA-Seq analysis.
additional ability to extract feature genes may allow it to serve as the direct substitute to other commonly used unsupervised methods. It should be noted however, that this benefit of NMF diminishes when the classes are drastically different. Also, the fact that it has the tendency to select more highly expressed and correlated genes implies that it might miss biologically important genes (such as transcription factors) that have low expression levels (Tian et al., 2011).
Another caveat of our secondary data analysis on public data set, is that there are batch effects that confound the patterns recognized by NMF (or any other subpopulation detection methods). In these experiments, groups of samples are sequenced in different runs, thus technical variation may confound the biological variation (Hicks, Teng & Irizarry, 2015). We calculated the confoundedness of the three datasets (mouse embryonic lung epithelial, glioblastoma and bone marrow datasets) where experimental information is available, and found that confounding accounts 92.8%, 98.9% and 100%, respectively. However, since NMF is able to identify some previously validated biological results, it is reasonable to believe that NMF still has the power to detect biological factors. It is nonetheless paramount to design experiments well so that such confounding effects can be minimized in the future scRNA-Seq studies.
Moreover, the best combinatory approaches for scRNA-Seq subpopulation identification will continue to be an interesting area of research. For example, a few normalization methods have been proposed for RNA-Seq experiments lately, including RUV (Risso et al., 2014) and GRM (Ding et al., 2015). These normalization methods may have additional impact on the results of clustering. More rigorous source of variation (SOV) analysis to identify the best combinations of analysis steps will be an interesting follow-up project.
In summary, we have demonstrated that NMF is a method capable of accomplishing various tasks in scRNA-Seq data analysis, from reclassifying populations of single cells to revealing meaningful genes and modules of biological significance. We expect the new workflow proposed here will have valuable applications in the field of scRNA-Seq bioinformatics analysis.
ACKNOWLEDGEMENTS
We would like to thank our colleagues Kumardeep Chaudhary and Olivier Poirion for reading the manuscript and providing valuable suggestions.
ADDITIONAL INFORMATION AND DECLARATIONS
Funding
This research was supported by grants K01ES025434 awarded by NIEHS through funds provided by the trans-NIH Big Data to Knowledge (BD2K) initiative (http:
//www.bd2k.nih.gov), P20 COBRE GM103457 awarded by NIH/NIGMS, NICHD R01
Grant Disclosures
The following grant information was disclosed by the authors: NIEHS: K01ES025434.
NIH/NIGMS: P20 COBRE GM103457.
Hawaii Community Foundation: NICHD R01 HD084633, NLM R01LM012373, 14ADVC-64566.
Competing Interests
The authors declare there are no competing interests.
Author Contributions
• Xun Zhu performed the experiments, analyzed the data, wrote the paper, prepared figures and/or tables, reviewed drafts of the paper.
• Travers Ching analyzed the data, reviewed drafts of the paper.
• Xinghua Pan and Sherman M. Weissman contributed reagents/materials/analysis tools, reviewed drafts of the paper.
• Lana Garmire conceived and designed the experiments, analyzed the data, wrote the paper, reviewed drafts of the paper.
Data Availability
The following information was supplied regarding data availability: GitHub:https://github.com/lanagarmire/NMFEM.
Supplemental Information
Supplemental information for this article can be found online athttp://dx.doi.org/10.7717/
peerj.2888#supplemental-information.
REFERENCES
Barrett T, Wilhite SE, Ledoux P, Evangelista C, Kim IF, Tomashevsky M, Marshall KA, Phillippy KH, Sherman PM, Holko M, Yefanov A, Lee H, Zhang N, Robertson CL, Serova N, Davis S, Soboleva A. 2013.NCBI GEO: archive for functional genomics data sets—update.Nucleic Acids Research41:D991–D995DOI 10.1093/nar/gks1193.
Biase F, Cao X, Zhong S. 2014.Cell fate inclination within 2-cell and 4-cell mouse em-bryos revealed by single-cell RNA sequencing.Genome Research24(11):1787–1796
DOI 10.1101/gr.177725.114.
Blake-Palmer KG, Su Y, Smith AN, Karet FE. 2007.Molecular cloning and character-ization of a novel form of the human vacuolar H+-ATPase e-subunit: an essential proton pump component.Gene393:94–100 DOI 10.1016/j.gene.2007.01.020.
Brennecke P, Anders S, Kim JK, Kołodziejczyk AA, Zhang X, Proserpio V, Bay-ing B, Benes V, Teichmann SA, Marioni JC. 2013.Accounting for technical noise in single-cell RNA-seq experiments.Nature Methods10(11):1093–1095
Brunet J-P, Tamayo P, Golub TR, Mesirov JP. 2004.Metagenes and molecular pattern discovery using matrix factorization.Proceedings of the National Academy of Sciences of the United States of America101:4164–4169DOI 10.1073/pnas.0308531101.
Brunskill EW, Park J-S, Chung E, Chen F, Magella B, Potter SS. 2014.Single cell dissection of early kidney development: multilineage priming.Development 141:3093–3101DOI 10.1242/dev.110601.
Buettner F, Natarajan KN, Casale FP, Proserpio V, Scialdone A, Theis FJ, Teichmann SA, Marioni JC, Stegle O. 2015.Computational analysis of cell-to-cell heterogeneity in single-cell RNA-sequencing data reveals hidden subpopulations of cells.Nature Biotechnology33:155–160DOI 10.1038/nbt.3102.
Bushati N, Smith J, Briscoe J, Watkins C. 2011.An intuitive graphical visualization technique for the interrogation of transcriptome data.Nucleic Acids Research 39:7380–7389DOI 10.1093/nar/gkr462.
Ding B, Zheng L, Zhu Y, Li N, Jia H, Ai R, Wildberg A, Wang W. 2015. Normal-ization and noise reduction for single cell RNA-seq experiments.Bioinformatics 31(13):2225–2227DOI 10.1093/bioinformatics/btv122.
Edgar R, Domrachev M, Lash AE. 2002.Gene expression omnibus: NCBI gene expres-sion and hybridization array data repository.Nucleic Acids Research30:207–210
DOI 10.1093/nar/30.1.207.
Fan BJBJ, Salathia N, Liu R, Kaeser GE, Yung YC, Herman JL, Kaper F, Fan J-BJJ-BJ, Zhang K, Chun J, Kharchenko PV. 2016.Characterizing transcriptional heterogeneity through pathway and gene set overdispersion analysis.Nature Methods 13(3):241–244DOI 10.1038/nmeth.3734.
Gao Y, Church G. 2005.Improving molecular cancer class discovery through sparse non-negative matrix factorization.Bioinformatics21:3970–3975
DOI 10.1093/bioinformatics/bti653.
Gaujoux R, Seoighe C. 2010.A flexible R package for nonnegative matrix factorization.
BMC Bioinformatics11:367DOI 10.1186/1471-2105-11-367.
George L, Irmler M, Mitra A, Thimraj TA, Beckers J, Upadhyay S, Schulz H, Leikauf GD, Ganguly K. 2016.Mouse lung developmental gene expression profiling study identifies novel candidate genes for pulmonary function. B58. Big and bigger (data): omics and biomarkers of COPD and other chronic lung diseases,American Journal of Respiratory and Critical Care Medicine 2016193:A4078–A4078.
Hicks SC, Teng M, Irizarry RA. 2015.On the widespread and critical impact of systematic bias and batch effects in single-cell RNA-Seq data.bioRxiv Preprint.
DOI 10.1101/025528.
Huang DW, Sherman BT, Lempicki RA. 2008.Systematic and integrative analysis of large gene lists using DAVID bioinformatics resources.Nature Protocols4:44–57
DOI 10.1038/nprot.2008.211.
Huang M, Zhong Z, Lv M, Shu J, Tian Q, Chen J. 2016.Comprehensive analysis of dif-ferentially expressed profiles of lncRNAs and circRNAs with associated co-expression and ceRNA networks in bladder carcinoma.Oncotarget 7(30):47186–47200
DOI 10.18632/oncotarget.9706.
Jia Z, Zhang X, Guan N, Bo X, Barnes MR, Luo Z. 2015.Gene ranking of RNA-seq data via discriminant non-negative matrix factorization.PLOS ONE10:e0137782
DOI 10.1371/journal.pone.0137782.
Jiao Y, Widschwendter M, Teschendorff AE. 2014.A systems-level integrative frame-work for genome-wide DNA methylation and gene expression data identifies differential gene expression modules under epigenetic control.Bioinformatics 30(16):2360–2366DOI 10.1093/bioinformatics/btu316.
Junker JP, Noël ES, Guryev V, Peterson KA, Shah G, Huisken J, McMahon AP,
Berezikov E, Bakkers J, Van oudenaarden A. 2014.Genome-wide RNA tomography in the zebrafish embryo.Cell159:662–675 DOI 10.1016/j.cell.2014.09.038.
Karolchik D, Barber GP, Casper J, Clawson H, Cline MS, Diekhans M, Dreszer TR, Fujita PA, Guruvadoo L, Haeussler M. 2014.The UCSC genome browser database: 2014 update.Nucleic Acids Research42:D764–D770DOI 10.1093/nar/gkt1168.
Kharchenko PV, Silberstein L, Scadden DT. 2014.Bayesian approach to single-cell dif-ferential expression analysis.Nature Methods11:740–742DOI 10.1038/nmeth.2967.
Kim D, Pertea G, Trapnell C, Pimentel H, Kelley R, Salzberg SL. 2013.TopHat2: accurate alignment of transcriptomes in the presence of insertions, deletions and gene fusions.Genome Biology14(4):Article 1DOI 10.1186/gb-2013-14-4-r36.
Kopp S, Slumstrup L, Corydon TJ, Sahana J, Aleshcheva G, Islam T, Magnusson NE, Wehland M, Bauer J, Infanger M. 2016.Identifications of novel mecha-nisms in breast cancer cells involving duct-like multicellular spheroid formation after exposure to the Random Positioning Machine.Scientific Reports6:26887
DOI 10.1038/srep26887.
Kumar RM, Cahan P, Shalek AK, Satija R, Daleykeyser AJ, Li H, Zhang J, Pardee K, Gennert D, Trombetta JJ, Ferrante TC, Regev A, Daley GQ, Collins JJ. 2014.
Deconstructing transcriptional heterogeneity in pluripotent stem cells.Nature 516:56–61DOI 10.1038/nature13920.
Leinonen R, Sugawara H, Shumway M, Collaboration on behalf of the INSD. 2011.The sequence read archive.Nucleic Acids Research39:D19–D21
DOI 10.1093/nar/gkq1019.
Li L, Akashi K. 2003.Unraveling the molecular components and genetic blueprints of stem cells.Biotechniques35:1233–1239.
Liao Y, Smyth GK, Shi W. 2014.featureCounts: an efficient general purpose program for assigning sequence reads to genomic features.Bioinformatics30:923–930
DOI 10.1093/bioinformatics/btt656.
Ma K, Wang H, Li X, Li T, Su G, Yang P, Wu J. 2015b.Long noncoding RNA MALAT1 associates with the malignant status and poor prognosis in glioma.Tumor Biology 36:3355–3359DOI 10.1007/s13277-014-2969-7.
Ma X-Y, Wang J-H, Wang J-L, Ma CX, Wang X-C, Liu F-S. 2015a.Malat1 as an evolutionarily conserved lncRNA, plays a positive role in regulating proliferation and maintaining undifferentiated status of early-stage hematopoietic cells.BMC Genomics16:676DOI 10.1186/s12864-015-1881-x.
Macosko EZ, Basu A, Satija R, Nemesh J, Shekhar K, Goldman M, Tirosh I, Bialas AR, Kamitaki N, Martersteck EM. 2015.Highly parallel genome-wide expression profiling of individual cells using nanoliter droplets.Cell161:1202–1214
DOI 10.1016/j.cell.2015.05.002.
McDavid A, Finak G, Chattopadyay PK, Dominguez M, Lamoreaux L, Ma SS, Roederer M, Gottardo R. 2013.Data exploration, quality control and testing in single-cell qPCR-based gene expression experiments.Bioinformatics29:461–467
DOI 10.1093/bioinformatics/bts714.
Monga V, Mıh¸cak MK. 2007.Robust and secure image hashing via non-negative matrix factorizations.IEEE Transactions on Information Forensics and Security 2:376–390
DOI 10.1109/TIFS.2007.902670.
Moore HC, Johnston M, Nicol SM, Bourdon J-C, Thompson AM, Hutvagner G, Fuller-Pace FV. 2011.An evolutionarily conserved, alternatively spliced, intron in the p68/DDX5 DEAD-box RNA helicase gene encodes a novel miRNA.RNA 17:555–562DOI 10.1261/rna.2591611.
Pan X. 2014.Single cell analysis: from technology to biology and medicine.Single Cell Biology3:Article 1DOI 10.4172/2168-9431.1000106.
Panebianco F, Mazzanti C, Tomei S, Aretini P, Franceschi S, Lessi F, Di Coscio G, Bevilacqua G, Marchetti I. 2015.The combination of four molecular markers improves thyroid cancer cytologic diagnosis and patient management.BMC Cancer
15:1DOI 10.1186/1471-2407-15-1.
Park I, Qian D, Kiel M, Becker MW, Pihalja M, Weissman IL, Morrison SJ, Clarke MF. 2003.Bmi-1 is required for maintenance of adult self-renewing haematopoietic stem cells.Nature423:302–305DOI 10.1038/nature01587.
Patel AP, Tirosh I, Trombetta JJ, Shalek AK, Gillespie SM, Wakimoto H, Cahill DP, Na-hed BV, Curry WT, Martuza RL, Louis DN, Rozenblatt-Rosen O, Suvà ML, Regev A, Bernstein BE. 2014.Single-cell RNA-seq highlights intratumoral heterogeneity in primary glioblastoma.Science344:1396–1401DOI 10.1126/science.1254257.
Pearson-White S, Deacon D, Crittenden R, Brady G, Iscove N, Quesenberry PJ. 1995.The ski/sno protooncogene family in hematopoietic development.Blood 86:2146–2155.
Phillips RL, Ernst RE, Brunk B, Ivanova N, Mahan MA, Deanehan JK, Moore KA, Overton GC, Lemischka IR. 2000.The genetic program of hematopoietic stem cells.
Science288:1635–1640DOI 10.1126/science.288.5471.1635.
Qi Q, Zhao Y, Li M, Simon R. 2009.Non-negative matrix factorization of gene ex-pression profiles: a plug-in for BRB-ArrayTools.Bioinformatics25:545–547
DOI 10.1093/bioinformatics/btp009.
Rajapakse M, Tan J, Rajapakse J. 2004.Color channel encoding with NMF for face recognition. In:2004 international conference on image processing (ICIP 2004). Piscataway: IEEE, 2007–2010.
Rand WM. 1971.Objective criteria for the evaluation of clustering methods.Journal of the American Statistical Association66:846–850
DOI 10.1080/01621459.1971.10482356.
Reichardt J, Bornholdt S. 2006.Statistical mechanics of community detection.Physical Review E 74(1):Article 016110DOI 10.1103/PhysRevE.74.016110.
Risso D, Ngai J, Speed TP, Dudoit S. 2014.Normalization of RNA-seq data using factor analysis of control genes or samples.Nature Biotechnology32:896–902
DOI 10.1038/nbt.2931.
Robinson MD, McCarthy DJ, Smyth GK. 2010.edgeR: a Bioconductor package for differential expression analysis of digital gene expression data.Bioinformatics 26:139–140DOI 10.1093/bioinformatics/btp616.
Schlitzer A, Sivakamasundari V, Chen J, Sumatoh HRB, Schreuder J, Lum J, Malleret B, Zhang S, Larbi A, Zolezzi F, Renia L, Poidinger M, Naik S, Newell EW, Robson P, F Ginhoux. 2015.Identification of cDC1-and cDC2-committed DC progenitors reveals early lineage priming at the common DC progenitor stage in the bone marrow.Nature Immunology16:718–728DOI 10.1038/ni.3200.
Smaragdis P. 2004. Non-negative matrix factor deconvolution; extraction of multiple sound sources from monophonic inputs. In:Independent component analysis and blind signal separation. Berlin Heidelberg: Springer, 494–499.
Summers AR, Fischer MA, Stengel KR, Zhao Y, Kaiser JF, Wells CE, Hunt A, Bhaskara S, Luzwick JW, Sampathi S. 2013.HDAC3 is essential for DNA replication in hematopoietic progenitor cells.The Journal of Clinical Investigation123:3112–3123
DOI 10.1172/JCI60806.
Tamayo P, Scanfeld D, Ebert BL, Gillette MA, Roberts CWM, Mesirov JP. 2007.
Metagene projection for cross-platform, cross-species characterization of global transcriptional states.Proceedings of the National Academy of Sciences of the United States of America104:5959–5964DOI 10.1073/pnas.0701068104.
Tian H, Biehs B, Warming S, Leong KG, Rangell L, Klein OD, De Sauvage FJ. 2011.A reserve stem cell population in small intestine renders Lgr5-positive cells dispensable.
Nature478:255–259DOI 10.1038/nature10408.
Trapnell C, Cacchiarelli D, Grimsby J, Pokharel P, Li S, Morse M, Lennon NJ, Livak KJ, Mikkelsen TS, Rinn JL. 2014.Pseudo-temporal ordering of individual cells reveals dynamics and regulators of cell fate decisions.Nature Biotechnology32:381–386
DOI 10.1038/nbt.2859.
the distal lung epithelium using single-cell RNA-seq.Nature509:371–375
DOI 10.1038/nature13173.
Tung P-Y, Blischak JD, Hsiao C, Knowles DA, Burnett JE, Pritchard JK, Gilad Y. 2016.
Batch effects and the effective design of single-cell gene expression studies.bioRxiv Preprint.DOI 10.1101/025528.
Usoskin D, Furlan A, Islam S, Abdo H, Lönnerberg P, Lou D, Hjerling-Leffler J, Haeggström J, Kharchenko O, Kharchenko PV. 2014.Unbiased classification of sensory neuron types by large-scale single-cell RNA sequencing.Nature Neuroscience 18:145–153DOI 10.1038/nn.3881.
Van der Maaten L. 2013.Barnes-hut-sne. ArXiv preprint.arXiv:1301.3342.
Van der Maaten L, Hinton G. 2008.Visualizing data using t-SNE.Journal of Machine Learning Research9:2579–2605.
Yang Z, Zhang H, Yuan Z, Oja E. 2011. Kullback–Leibler divergence for nonnegative matrix factorization. In:Artificial neural networks and machine learning–ICANN 2011. Berlin Heidelberg: Springer, 250–257.
Ye X, Liu J, Wu F-X. 2012.Dynamic miRNA-TF-mRNA circuits in mouse lung develop-ment. In:2012 IEEE 6th international conference on systems biology (ISB). Piscataway: IEEE, 256–262.
Yuan Z, Oja E. 2005. Projective nonnegative matrix factorization for image compression and feature extraction. In:Image analysis. Berlin Heidelberg: Springer, 333–342.
Zeisel A, Muñoz-Manchado AB, Codeluppi S, Lönnerberg P, La Manno G, Juréus A, Marques S, Munguba H, He L, Betsholtz C. 2015.Cell types in the mouse cortex and hippocampus revealed by single-cell RNA-seq.Science347:1138–1142
DOI 10.1126/science.aaa1934.
Zhang P, Cao Y, Bai L-L, Li W-N, Wang Y, Chen S-Y, Zhang L, Yang L-H, Xu H-T, Wang E-H. 2015.The high expression of TC1 (C8orf4) was correlated with the expression ofβ-catenin and cyclin D1 and the progression of squamous cell carcino-mas of the tongue.Tumor Biology36:7061–7067DOI 10.1007/s13277-015-3423-1.
Zhu P, Wang Y, Du Y, He L, Huang G, Zhang G, Yan X, Fan Z. 2015.C8orf4 negatively regulates self-renewal of liver cancer stem cells via suppression of NOTCH2