Functions
Krishna Sumanth Ghanta1., Da-Qiang Li2., Jeyanthy Eswaran1,2
*, Rakesh Kumar1,2
1McCormick Genomic and Proteomic Center, The George Washington University Medical Center, Washington, D.C., United States of America, 2Department of Biochemistry and Molecular Biology, The George Washington University Medical Center, Washington, D.C., United States of America
Abstract
Background:Metastasis-associated protein 1 (MTA1), a master dual co-regulatory protein is found to be an integral part of NuRD (Nucleosome Remodeling and Histone Deacetylation) complex, which has indispensable transcriptional regulatory functions via histone deacetylation and chromatin remodeling. Emerging literature establishes MTA1 to be a valid DNA-damage responsive protein with a significant role in maintaining the optimum DNA-repair activity in mammalian cells exposed to genotoxic stress. This DNA-damage responsive function of MTA1 was reported to be a P53-dependent and independent function. Here, we investigate the influence ofP53on gene regulation function ofMta1to identify novel gene targets and functions ofMta1.
Methods:Gene expression analysis was performed on five different mouse embryonic fibroblasts (MEFs) samples (i) the Mta1wild type, (ii)Mta1knock out (iii)Mta1knock out in whichMta1was reintroduced (iv)P53knock out (v)P53knock out in which Mta1 was over expressed using Affymetrix Mouse Exon 1.0 ST arrays. Further Hierarchical Clustering, Gene Ontology analysis with GO terms satisfying corrected p-value,0.1, and the Ingenuity Pathway Analysis were performed. Finally, RT-qPCR was carried out on selective candidate genes.
Significance/Conclusion:This study represents a complete genome wide screen for possible target genes of a coregulator, Mta1. The comparative gene profiling ofMta1wild type, Mta1knockout andMta1 re-expression in theMta1 knockout conditions define ‘‘bona fide’’Mta1target genes. Further extensive analyses of the data highlights the influence ofP53on Mta1gene regulation. In the presence ofP53majority of the genes regulated byMta1are related to inflammatory and anti-microbial responses whereas in the absence ofP53the predominant target genes are involved in cancer signaling. Thus, the presented data emphasizes the known functions ofMta1and serves as a rich resource which could help us identify novel Mta1functions.
Citation:Ghanta KS, Li D-Q, Eswaran J, Kumar R (2011) Gene Profiling ofMta1Identifies Novel Gene Targets and Functions. PLoS ONE 6(2): e17135. doi:10.1371/ journal.pone.0017135
Editor:Sean Lee, The National Institute of Diabetes and Digestive and Kidney Diseases, United States of America ReceivedOctober 26, 2010;AcceptedJanuary 21, 2011;PublishedFebruary 25, 2011
Copyright:ß2011 Ghanta et al. This is an open-access article distributed under the terms of the Creative Commons Attribution License, which permits unrestricted use, distribution, and reproduction in any medium, provided the original author and source are credited.
Funding:This study was supported by National Institutes of Health grant CA90970 to RK. The funders had no role in study design, data collection and analysis, decision to publish, or preparation of the manuscript.
Competing Interests:The authors have declared that no competing interests exist. * E-mail: [email protected]
.These authors contributed equally to this work.
Introduction
Gene expression is central to variety of fundamental cellular processes that governs the growth and proliferation in mammalian cell. It is a highly regulated process that is governed by transcription factors and their co-regulators in the target gene chromatin [1–3]. Co-regulators are emerging transcription factor (TF) family that stringently controls the actions of almost ‘‘all’’ nuclear receptors (NRs) through direct binding to NRs rather than binding to DNA [1–4]. Recent literature highlights the signifi-cance of coregulators in induction or repression of gene transcription [5,6]. In fact, the coregulators either function as enzymes that are essential for gene expression or they regulate other coregulators through diverse mechanisms [6–10]. There has been a tremendous focus on understanding the molecular mechanism of coregulators due to their crucial regulatory role in almost ‘‘all’’ TF-dependent gene expression and nuclear receptors dependent functions in several tissues such as breast, ovary,
prostate, gastrointestinal, pancreatic and lungs [5,11,12]. More interestingly, many cancers over express ‘‘growth coactivators’’ that allow the cancer cell to hijack these molecules which consequently results in rapid proliferation, malignant process and rapid metastasis.
One emerging group of chromatin modifiers and coregulators is the metastasis-associated protein (MTA) family. This family comprises three different known genes (MTA1, MTA2, and
its name as a coregualtor the repressor function of MTA1 is observed through its direct interaction with ERa[18] and HDACs which represses estrogen-responsive element (ERE) transactivation activity in a HDAC-sensitive manner that promotes the develop-ment of hormone-independent growth of breast cancer cells. In addition, MTA1-NuRD complex was also reported to negatively regulate BRCA1 transcription by physically associating with an atypical estrogen-responsive element (ERE) on the BRCA1 promoter [19]. The transcription activator function of MTA1 is
evident from reports showing the stimulation of breast cancer-amplified sequence 3 (BCAS3) [20] and paired box gene 5 (Pax 5) [21] promoters mainly through the interaction with RNA polymerase II. It is noteworthy that the MTA family members exist in distinct NuRD complexes, and functional redundancy is lacking among MTA family members [22].
Further, recent studies from this laboratory have discovered for the first time that MTA1 is a bona-fide DNA-damage responsive protein due to the induction of intracellular levels of MTA1 by
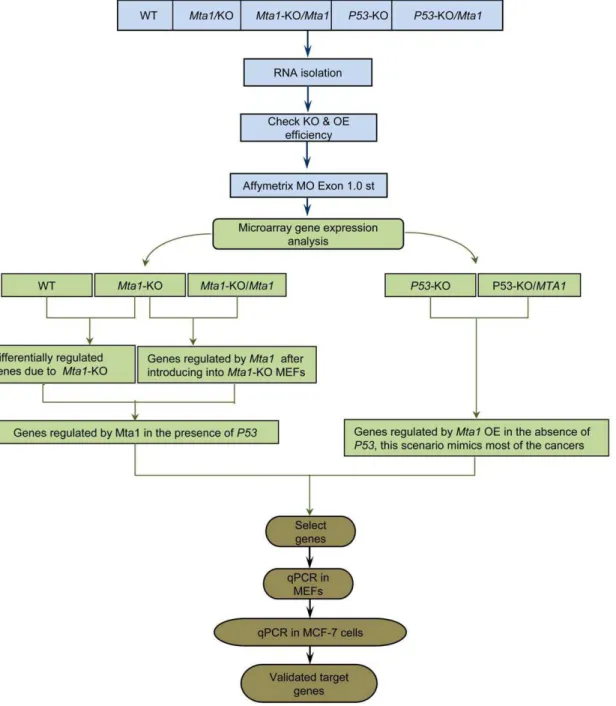
Figure 1. Schematic showing the experimental design of the study to identify theMta1regulated genes with/without the effect of
P53.RNA was extracted from all the samples Wild Type (WT),Mta1knock out (Mta1-KO),Mta1Re-expression in theMta1knock out MEFS (Mta1-KO/ Mta1), P53 knock out (P53-KO),Mta1over expression (OE) in theP53knock out MEFs (P53-KO/Mta1). cDNA was prepared, processed and hybridized onto the Affymetrix Mouse Exon 1.0 ST arrays followed by the data analysis. Samples were compared to identify the differentially regulated genes and in turn the genes regulated byMta1inp53dependent/independent manner and irrespective ofP53status. Candidate genes were selected; these genes were validated using RT-qPCR assays in MEFs followed by RT-qPCR assays in MCF-7 human breast cancer cell line with the human homologs of the candidate mouse genes.
Figure 2. Principle Component Analysis as a quality control.All the sample sets (each in triplicates) were plotted in the 3-D PCA-plot. Out of the 4 total PCA components, components 1, 2 & 4 were plotted on columns X, Y & Z respectively.
doi:10.1371/journal.pone.0017135.g002
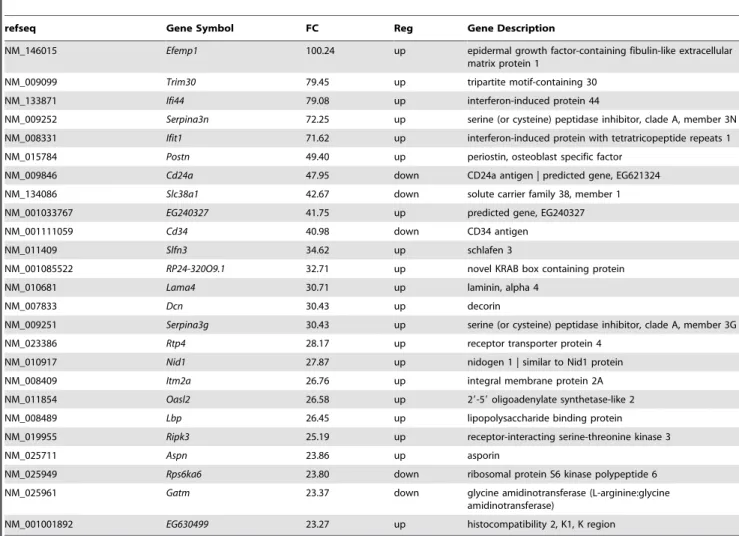
Table 1.Top 25 differentially expressed Affymetrix Mouse Exon 1.0 St Array probe sets in MEFs between the wild type andMta1 knock out.
refseq Gene Symbol FC Reg Gene Description
NM_146015 Efemp1 100.24 up epidermal growth factor-containing fibulin-like extracellular matrix protein 1
NM_009099 Trim30 79.45 up tripartite motif-containing 30
NM_133871 Ifi44 79.08 up interferon-induced protein 44
NM_009252 Serpina3n 72.25 up serine (or cysteine) peptidase inhibitor, clade A, member 3N NM_008331 Ifit1 71.62 up interferon-induced protein with tetratricopeptide repeats 1 NM_015784 Postn 49.40 up periostin, osteoblast specific factor
NM_009846 Cd24a 47.95 down CD24a antigen | predicted gene, EG621324 NM_134086 Slc38a1 42.67 down solute carrier family 38, member 1
NM_001033767 EG240327 41.75 up predicted gene, EG240327
NM_001111059 Cd34 40.98 down CD34 antigen
NM_011409 Slfn3 34.62 up schlafen 3
NM_001085522 RP24-320O9.1 32.71 up novel KRAB box containing protein
NM_010681 Lama4 30.71 up laminin, alpha 4
NM_007833 Dcn 30.43 up decorin
NM_009251 Serpina3g 30.43 up serine (or cysteine) peptidase inhibitor, clade A, member 3G
NM_023386 Rtp4 28.17 up receptor transporter protein 4
NM_010917 Nid1 27.87 up nidogen 1 | similar to Nid1 protein
NM_008409 Itm2a 26.76 up integral membrane protein 2A
NM_011854 Oasl2 26.58 up 29-59oligoadenylate synthetase-like 2
NM_008489 Lbp 26.45 up lipopolysaccharide binding protein
NM_019955 Ripk3 25.19 up receptor-interacting serine-threonine kinase 3
NM_025711 Aspn 23.86 up asporin
NM_025949 Rps6ka6 23.80 down ribosomal protein S6 kinase polypeptide 6 NM_025961 Gatm 23.37 down glycine amidinotransferase (L-arginine:glycine
amidinotransferase)
NM_001001892 EG630499 23.27 up histocompatibility 2, K1, K region
ionizing radiation (IR) and an integral component of DNA damage response and contributes to double-strand DNA break repair [23]. One of the main DNA damage responsive mechanisms employed by MTA1 is through direct interaction and controlling the stability of P53 [24]. P53 is a well-studied tumor suppressor protein which plays a central role in preserving the genomic integrity in response to DNA damage, through inhibiting its ubiquitination by E3 ubiquitin ligases, mouse double minute 2 (Mdm2) and constitutive photomorphogenic protein 1 (COP1), thereby regulating the P53-dependent DNA repair [25– 27]. Interestingly, these events could be reversed by MTA1 reintroduction, indicating that MTA1 interjects into the P53-dependent DNA repair [24]. This identified interplay between oncogene (MTA1) and tumor suppressor (P53) exemplifies the highly complex check point mediated ‘‘failsafe mechanism’’ that controls the mitogenic signaling. Moreover, studies from our laboratory illustrated the participation of MTA1 in a P53-independent DNA damage response. MTA1-histone deacetylase 2 (HDAC2) complexes recruit P53-independent transcriptional corepressor, p21WAF1 [28,29] onto two selective regions of the p21WAF1 promoter which increases p21WAF1 binding to proliferating cell nuclear antigen (PCNA). This decreases the nuclear accumulation of PCNA in response to ionizing radiation
[30]. MTA1 is also shown to be stabilized by UV radiation in ATR (Ataxia teleangiectasia and Rad3-related) kinase dependent manner and there is a subsequent increase in MTA1 binding to ATR. However, depletion of MTA1 compromises the ATR-mediated Chk1 activation following UV treatment. Consequently, expression of MTA1 in P53-null cells results in increased induction of histone,cH2AX [31] foci and DNA double strand break repair and decreased DNA damage sensitivity following ionizing radiation treatment. These early studies linking the MTA/NuRD complexes to DNA-damage response were further supported by more recent reports showing the recruitment of the NuRD complexes to the site of DNA damage [32,33] Together, the P53-independent role of MTA1 in DNA damage response connects NuRD complex and DNA-damage response pathways [34].
To further characterize the potential mechanism for the functional role of MTA1 in DNA repair, we performed a complete gene profiling study to identify differences between theMTA1+/+ and MTA12/2 mouse embryonic fibroblasts (MEFs) in the
presence and absence of P53, using Affymetrix Mouse Exon 1.0 ST arrays. The comparative gene profiling of Mta1 wild type,
Mta1 knock out and Mta1 knockout in which Mta1 was reintroduced conditions define ‘‘bona fide’’ Mta1 target genes such as Egr2, Phf17, and Aw551984. In depth analyses of the
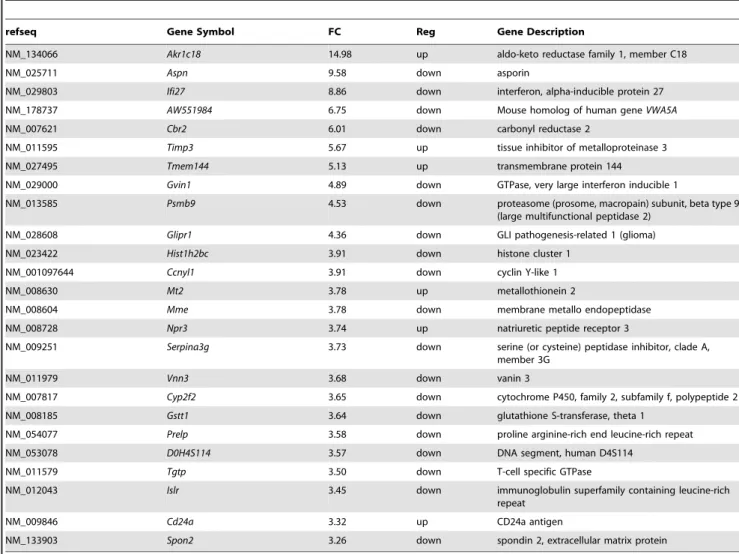
Table 2.Top 25 differentially expressed Affymetrix Mouse Exon 1.0 St Array probe sets in MEFs between theMta1knock out and Mta1knock out/Mta1.
refseq Gene Symbol FC Reg Gene Description
NM_134066 Akr1c18 14.98 up aldo-keto reductase family 1, member C18
NM_025711 Aspn 9.58 down asporin
NM_029803 Ifi27 8.86 down interferon, alpha-inducible protein 27
NM_178737 AW551984 6.75 down Mouse homolog of human geneVWA5A
NM_007621 Cbr2 6.01 down carbonyl reductase 2
NM_011595 Timp3 5.67 up tissue inhibitor of metalloproteinase 3
NM_027495 Tmem144 5.13 up transmembrane protein 144
NM_029000 Gvin1 4.89 down GTPase, very large interferon inducible 1
NM_013585 Psmb9 4.53 down proteasome (prosome, macropain) subunit, beta type 9 (large multifunctional peptidase 2)
NM_028608 Glipr1 4.36 down GLI pathogenesis-related 1 (glioma)
NM_023422 Hist1h2bc 3.91 down histone cluster 1
NM_001097644 Ccnyl1 3.91 down cyclin Y-like 1
NM_008630 Mt2 3.78 up metallothionein 2
NM_008604 Mme 3.78 down membrane metallo endopeptidase
NM_008728 Npr3 3.74 up natriuretic peptide receptor 3
NM_009251 Serpina3g 3.73 down serine (or cysteine) peptidase inhibitor, clade A, member 3G
NM_011979 Vnn3 3.68 down vanin 3
NM_007817 Cyp2f2 3.65 down cytochrome P450, family 2, subfamily f, polypeptide 2
NM_008185 Gstt1 3.64 down glutathione S-transferase, theta 1
NM_054077 Prelp 3.58 down proline arginine-rich end leucine-rich repeat
NM_053078 D0H4S114 3.57 down DNA segment, human D4S114
NM_011579 Tgtp 3.50 down T-cell specific GTPase
NM_012043 Islr 3.45 down immunoglobulin superfamily containing leucine-rich repeat
NM_009846 Cd24a 3.32 up CD24a antigen
NM_133903 Spon2 3.26 down spondin 2, extracellular matrix protein
microarray data of all five samples that include the above three along with P53 knockout and P53 knockout with Mta1 over expression clearly indicates influence of P53 on Mta1 gene regulation. Mta1 target genes are mostly involved in inflammatory
and anti-microbial responses in the presence of P53 whereas the predominant target genes and functions identified appear to be related to cancer signaling in the absence of P53. Thus, we provide a complete gene profiling ofMta1which not only emphasizes the
Figure 3. Genes regulated byMta1in the presence and absence ofP53. A: Venn diagrams showing the number of genes that are identified to be genuinely regulated byMta1in the presence and absence ofP53. (i) The genes shown in WT vs.Mta1-KO (1124) are the genes affected byMta1 knock out and the genes that are present inMta1-KO vs.Mta1-KO/Mta1(184) are affected due to re-expression ofMta1in the knockout MEFs. The genes that are differentially regulated in both the sets with opposite trends in the regulation are considered as the ‘bona fide’ genes regulated by Mta1. ii) Similarly, the intersection ofP53-KO andP53-KO/Mta1represents the genes differentially regulated byMta1over expression in theP53-KO MEFs. i.e. the genes regulated byMta1in the absence ofP53.This scenario ofMta1over expression andP53knock out/mutation mimics most of the cancers iii) The Venn diagram between genes regulated byMta1in the presence ofP53,126and genes regulated byMta1in the absence ofP53,266 gives the genes that are regulated byMta1only in the presence ofP53, irrespective ofP53status and only in the absence ofP53respectively.B: Heat maps representing hierarchical clustering of the differentially regulation, plotted using the log2 values of the genes with p-value#0.05 (unpaired t-test) and with fold change of at least 2 between the comparisonsMta1knock out vs.Mta1knock out/Mta1andP53knock out vs.P53knock out/Mta1. Each column represents a sample plotted in triplicates and each row in the heat map represents a gene that is differentially regulated in that particular comparison of samples. The color scale represents the degree of expression of the gene, green being the lowly expressed (below23.0) and red being (above+3.0) the highly expressed genes in the sample sets with black as the center of the scale at ‘0’.C: Pie diagrams showing the percentage of up-regulated and the down-regulated genes in each sample comparison. The red segment of the pie represents the up-regulated genes whereas; the green segments represent the down regulated genes.
known functions of Mta1 but also acts as a guide to identify novel functions.
Results
Strategy to identify the possible target genes of MTA1 in a P53 dependent and independent manner
The aim of the study is to identify the genes that are regulated by Mta1 in P53 dependent and independent manners. The detailed schematic of the strategy followed to identify the genes is shown in Figure 1. Murine Embryonic Fibroblasts (MEFs) from wild type, Mta1knockout [35] and P53knockout mice embryos [36] were isolated and cultured to obtain five different types of samples, each in triplicates, for the identification of the genes that are regulated by Mta1 with/without the P53 background. The sample sets are as follows: 1) Mta1-Wildtype (WT), 2) Mta1 -knockout (Mta1-KO) [23], 3)Mta1transfected into theMta1-knock out MEFs (Mta1-KO/Mta1), 4)P53-Knock (P53-KO) and 5)Mta1
over expressed in theP53-Knockout MEFs (P53-KO/Mta1) [30]. The protein levels of Mta1 in all the five samples are compared using Western blot probed with Mta1 antibody (Figure S1). Total RNA was isolated from the MEFs, cDNA was prepared, processed and hybridized onto Affymetrix Mouse Exon 1.0 ST arrays. The gene expression data from all the samples were obtained, quality control steps were performed and the data was analyzed using GeneSpring GX 10.0.2 (Agilent Technologies).
Genes regulated by Mta1 under different conditions were identified by performing gene expression analysis followed by the Gene Ontology analysis. Ingenuity Pathways Analysis (IPA) (Ingenuity Systems, Inc) was used to identify top 15 statistically significant functions of the differentially regulated genes and top 15 canonical pathways in which these genes could play a role. Candidate genes were selected based upon the functions and our laboratory interests. RT-qPCR assays were performed to validate the microarray gene regulation of the selected candidate genes. The differential regulation of the candidate genes was confirmed using MEFs and the MCF7 human breast cancer cell line for the respective human homologs. Using this strategy, we have identified a set of genes which, we believe, are regulated by
Mta1inP53dependent and independent manners, thus, providing overall gene profiling ofMta1.
Quality Control and Gene Expression Analysis
We generated cDNAs from the total RNA of the corresponding MEFs and three biological replicates for each sample were hybridized. The raw data was obtained and normalized log2 ratio values were used to identify the differential gene expression levels across different samples. The quality control of all the samples and the replicates was analyzed by unsupervised Principle Component Analysis (PCA) method in which each of the samples, in a differ-ent color, was plotted in three dimensional (3D) space with components 1, 2 & 4 along X, Y & Z axes respectively. Figure 2 shows the PCA-plot with replicates of each sample clustered close to each other illustrating the similarity between the sample replicates. We performed unpaired t-test with a p-value less than 0.05 and Benjamini Hochberg false discovery rate (FDR) was applied for the multiple corrections to filter the false positives so that the statistically significant genes could be obtained.
Genes regulated byMta1in the presence ofP53in MEFs The initial comparison between theMta1 wild type, theMta1
knock out and Mta1-re-expression in knockout MEFs was performed. Although differential expression of the genes between
Mta1 wild type and Mta1knock out was reported by us earlier
[30], our aim of this study is to identify the genes differentially regulated amongMta1wild type,Mta1knock out andMta1-KO in whichMta1WT was reintroduced. Therefore, we have used the
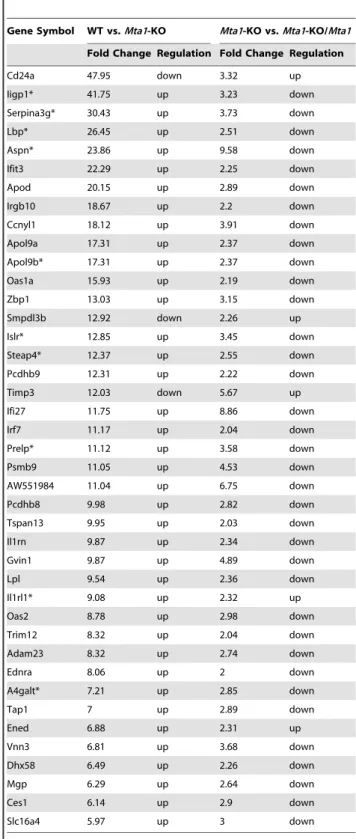
Table 3.Bona fideMta1regulated genes in the presence of P53identified from the Affymetrix Mouse Exon 1.0 ST Arrays.
Gene Symbol WT vs.Mta1-KO Mta1-KO vs.Mta1-KO/Mta1
Fold Change Regulation Fold Change Regulation
Cd24a 47.95 down 3.32 up
Iigp1* 41.75 up 3.23 down
Serpina3g* 30.43 up 3.73 down
Lbp* 26.45 up 2.51 down
Aspn* 23.86 up 9.58 down
Ifit3 22.29 up 2.25 down
Apod 20.15 up 2.89 down
Irgb10 18.67 up 2.2 down
Ccnyl1 18.12 up 3.91 down
Apol9a 17.31 up 2.37 down
Apol9b* 17.31 up 2.37 down
Oas1a 15.93 up 2.19 down
Zbp1 13.03 up 3.15 down
Smpdl3b 12.92 down 2.26 up
Islr* 12.85 up 3.45 down
Steap4* 12.37 up 2.55 down
Pcdhb9 12.31 up 2.22 down
Timp3 12.03 down 5.67 up
Ifi27 11.75 up 8.86 down
Irf7 11.17 up 2.04 down
Prelp* 11.12 up 3.58 down
Psmb9 11.05 up 4.53 down
AW551984 11.04 up 6.75 down
Pcdhb8 9.98 up 2.82 down
Tspan13 9.95 up 2.03 down
Il1rn 9.87 up 2.34 down
Gvin1 9.87 up 4.89 down
Lpl 9.54 up 2.36 down
Il1rl1* 9.08 up 2.32 up
Oas2 8.78 up 2.98 down
Trim12 8.32 up 2.04 down
Adam23 8.32 up 2.74 down
Ednra 8.06 up 2 down
A4galt* 7.21 up 2.85 down
Tap1 7 up 2.89 down
Ened 6.88 up 2.31 up
Vnn3 6.81 up 3.68 down
Dhx58 6.49 up 2.26 down
Mgp 6.29 up 2.64 down
Ces1 6.14 up 2.9 down
Slc16a4 5.97 up 3 down
*Genes (32) regulated byMta1irrespective ofP53status. Figure 3A (lower panel).
data from Li et al, (2010) for comparison. WhenMta1 WT and knockout conditions were compared, 1124 genes were reported with a fold change$62.0 and with the p-value,0.05. These 1124 genes were either directly or indirectly regulated byMta1. Top 25 differentially expressed Affymetrix probes are shown in Table 1 (complete list is shown in Table S1, statistically summary is shown in Table S2). It is noteworthy that a gene encoding epidermal growth factor-containing fibulin-like extra cellular matrix protein 1 (EFEMP1) is identified to be up-regulated by 100 fold with the highest fold change regulation in theMta1knockout MEFs when compared with the wild type Mta1 MEFs. Interestingly, Sadr-Nabavi et al., (2009) reported a reduction in RNA and protein levels of EFEMP1 in human sporadic breast cancer tissues [37] which imply that over expression of Mta1 could lead to down regulation of EFEMP. In addition, we also found that the gene encoding CD24/HSA had the maximum fold change among the down regulated genes. CD24 is a cell adhesion molecule that is expressed on the surface of the infected cells [38].
WhenMta1was transfected into theMta1knock-out MEFs and compared against theMta1-KO, 184 differentially regulated genes
were identified. The top 25 differentially regulated genes based upon fold change are shown in Table 2 (the entire list is shown in Table S3 and statistical summary in Table S4). Out of these 184 genes, 126 genes were found to be present in WT VsMta1-KO as well (1124 genes, Figure 3A top panel). Majority of these 126 genes appear to restore their functioning whenMta1is transfected back into theMta1
knock out cells. Among these 126 genes except 6 genes, rest of them regained their expression levels similar to WT. Therefore these represent ‘‘bona fide’’Mta1target genes (Table 3 and Table S5). SinceP53is present in all the three samples they reflect the number of genes influenced byMTA1in the presence ofP53.
Genes regulated byMta1in aP53-independent manner Here we identified the genes that are regulated byMta1 in a
P53-independent manner. Differential gene expression analysis was performed by comparing theP53 knock out cells and P53
knock out/Mta1 over expressed cells [30]. All the genes withp -value,0.05 and fold change expression$62.0 were considered as statistically significant. The statistical analysis of the data generated a set of 266 genes, top 25 differentially regulated genes are shown
Table 4.Top 25 differentially expressed Affymetrix Mouse Exon 1.0 St Array probe sets between theP53knock out MEFs and the P53knock out MEFs in whichMta1is over expressed.
refseq Gene Symbol FC Reg Gene Description
NM_008489 Lbp 26.89 down lipopolysaccharide binding protein
NM_015784 Postn 14.70 down periostin, osteoblast specific factor
NM_008607 Mmp13 13.37 down matrix metallopeptidase 13
NM_008760 Ogn 12.46 down osteoglycin
NM_011339 Cxcl15 12.39 down chemokine (C-X-C motif) ligand 15
NM_008491 Lcn2 9.68 down lipocalin 2
NM_001014423 Abi3bp 9.31 down ABI gene family, member 3 (NESH) binding
protein
NM_199468 Zcchc5 7.85 down zinc finger, CCHC domain containing 5
NM_011704 Vnn1 7.22 down vanin 1
NM_009373 Tgm2 7.22 down transglutaminase 2, C polypeptide
NM_054098 Steap4 7.06 down STEAP family member 4
NM_011315 Saa3 6.70 down serum amyloid A 3
NM_010582 Itih2 6.51 down inter-alpha trypsin inhibitor, heavy chain 2
NM_009144 Sfrp2 6.46 down secreted frizzled-related protein 2
NM_010809 Mmp3 6.39 down matrix metallopeptidase 3
NM_008728 Npr3 5.80 down natriuretic peptide receptor 3
NM_172463 Sned1 5.70 down sushi, nidogen and EGF-like domains 1
NM_022814 Svep1 5.62 down sushi, von Willebrand factor type A, EGF and
pentraxin domain containing 1
NM_007621 Cbr2 5.55 down carbonyl reductase 2
NM_009251 Serpina3g 5.53 down serine (or cysteine) peptidase inhibitor, clade A, member 3G
NM_025711 Aspn 5.47 down asporin
NM_144938 C1s 5.23 down complement component 1, s subcomponent
NM_031167 Il1rn 5.15 down interleukin 1 receptor antagonist
NR_001592 H19 5.14 down
NM_030601 Clca2|Clca1 4.83 down chloride channel calcium activated 2 | chloride channel calcium activated 1
Top 25 probe sets with fold change of 2.0 or more and FDR less than 0.05 are shown.P53-KO is considered as the control andP53-KO/Mta1is considered as the treatment.
in Table 4 (entire list is shown in Table S6 and statistical summary in Table S7) and the Venn diagram in Figure 3A middle panel shows the number of genes differentially regulated. When Bona fide Mta1 regulated genes (126) were compared with p53
independent regulated genes ofMta1, 32 genes were shown to be regulated byMta1irrespective ofp53status (Figure 3A lower panel, these genes are marked with asterisks in Table 3 and Table S5). Since, both the samples areP53-knockout MEFs, with one of them carrying over expression ofMta1; the differentially expressed genes were regulated byMta1independent ofP53.
Hierarchical clustering analysis reveals influence of P53 on MTA1 gene regulation
Further, we performed the hierarchical clustering analysis with the genes that were differentially regulated between theMta1-KO vs. Mta1-KO/Mta1, and P53-KO vs. P53-KO/Mta1. The normalized log2 ratio values of the differentially regulated genes in each comparison were used to obtain the heat maps (Figure 3B). The gene leaf nodes were optimized in the heat maps representing the differential regulation of the genes between the samples. Color scale of the heat map depicts red as the highly expressed, green as low expressed and black as intermittent level of gene expression. Figure 3B shows the heat maps of all the comparisons,Mta1-KO withMta1-KO/Mta1andP53-KO withP53-KO/Mta1 represent-ing the differential expression of the genes. We found that 64% of the differentially regulated genes were up-regulated in WT vs.
Mta1-KO where as it greatly reduced to 30% in Mta1-KO vs.
Mta1-KO/Mta1followed by further reduction to 22% inP53-KO vs.P53-KO/Mta1. In the case of differentially regulated genes that were down regulated, the percentage of down regulated genes was 36% in WT vs. Mta1-KO, 70% in Mta1-KO vs. Mta1-KO/
Mta1and 78% in P53-KO vs. P53-KO/Mta1. In summary, we observe 78% of genes down regulated byMta1due to the absence of P53 whereas about 64% of Mta1 regulated genes were up regulated in the presence ofP53(Figure 3C).
Figure 4. Gene Ontology (GO) analysis of was performed using Gene Spring GX 10.0.2 (Agilent technologies Inc and Strand Life Sciences Pvt Ltd).With the gene set comparisons that were described in the figure 3A GO analysis was performed. Pie chart A shows the statistically significant (P,0.1) differentially regulated genes between wild type andMta1-KO samples matching with three broad GO terms (Cellular components, Biological process and Molecular Function), Pie chart B (Mta1-KO and Mta1-KO/Mta1) shows the GO terms matching with the differentially regulated genes in this comparison. Pie chart C and pie chart D show the same for bona fide Mta1regulated genes in the presence ofP53(126) andP53-KO vs.P53 -KO/Mta1 (genes regulated by Mta1 in the absence of P53,266) respectively.
doi:10.1371/journal.pone.0017135.g004
Table 5.GO Analysis of the genes differentially regulated between the WT &Mta1-KO with$2.0 fold change.
GO ACCESSION GO Term p-value
Corrected p-value
Count in Selection
% Count in Selection
Count in Total
% Count in Total
GO:0005576 extracellular region 1.87E-27 4.82E-22 286 44.83 2627 14.72 GO:0044421 extracellular region part 2.27E-25 2.92E-20 244 38.24 2157 12.08 GO:0005615 extracellular space 2.75E-23 2.36E-18 229 35.89 2038 11.42
GO:0007155 cell adhesion 2.10E-17 1.08E-12 78 12.23 541 3.03
GO:0022610 biological adhesion 2.10E-17 1.08E-12 78 12.23 541 3.03
GO:0006955 immune response 1.17E-14 5.02E-10 59 9.25 405 2.27
GO:0031012 extracellular matrix 9.71E-14 3.57E-09 50 7.84 279 1.56
GO:0005578 proteinaceous extracellular matrix
2.06E-13 6.64E-09 49 7.68 275 1.54
GO:0005488 binding 2.37E-13 6.80E-09 446 69.91 10687 59.87
GO:0005515 protein binding 7.79E-12 2.01E-07 325 50.94 5094 28.54
GO:0002376 immune system process 8.35E-11 1.96E-06 59 9.25 658 3.69 GO:0009653 anatomical structure
morphogenesis
4.52E-09 9.71E-05 28 4.39 1002 5.61
GO:0005509 calcium ion binding 5.37E-09 9.89E-05 88 13.79 791 4.43
GO:0032502 developmental process 5.06E-09 9.89E-05 84 13.17 2682 15.03
GO:0048513 organ development 7.10E-09 1.14E-04 28 4.39 1339 7.50
Gene Ontology analysis shows the genes involved in cellular functions regulated byMta1 in the presence/ absence ofP53
To further investigate the functions of the genes regulated by
Mta1, we performed Gene Ontology (GO) analysis on all the sets of genes that are regulated byMta1with/withoutP53background with ap-value cutoff set to 0.1. The possible functions of the gene sets were broadly classified, in GO program, into three categories namely i) Cellular Component ii) Molecular Function and iii) Biological Process. We found that the 40.23% of the differentially regulated genes in the comparison of WT vs. Mta1-KO, withp -value: 0.1617 related to molecular function, followed by 34.97% withp-value 0.148 connected to Cellular Component and 24.79% of the genes with p-value 0.0944 were associated with the biological process (Figure 4A). In contrast to the above, when
Mta1-KO andMta1-KO with reintroducedMta1were compared there were no genes that match the GO terms in the Molecular functioning, whereas majority of them (77.78%,p-value: 0.6994) were related to the cellular component (Figure 4B). With the corrected p-value cut off 0.1 and in the presence of P53, Mta1
doesn’t regulate any genes responsible for molecular functioning. The majority of the genes (78.12%) are associated with Cellular Component and 21.88% are associated to Biological Process (Figure 4C). In contrast to the above, in. the absence of P53, 49.8% (p-value: 0.1212) differentially expressed genes were linked to the Cellular Component, 30.61% (p-value: 0.1777) to Molecular Function and 19.59% (p-value: 0.1253) related to Biological Process (Figure 4D). Tables with GO terms for all the above mentioned comparisons are shown in Table 5, 6, 7 and 8 respectively. Table 5 and Table 8 are continued as Tables S8 and S9 respectively.
Ingenuity Pathways Analysis highlights the critical role of Mta1 in cancer signaling in the presence/absence ofP53
Ingenuity pathways analysis was performed on all the genes that were identified to be regulated byMta1with/without P53. Withp-value,0.05, Fischer’s exact test was applied and we found top 15 significant functions and canonical pathways in which the genes regulated byMta1might play a significant role. The most likely functions of the genes regulated byMta1in the presence of
P53 are Inflammatory Response followed by Cancer and Gastrointestinal Diseases (Figure 5 upper panel). Top 15 canonical pathways of these genes were identified with the p -value,0.05 and threshold value of log (p-value): 0.05. The significant pathways which include LXR/RXR activation, Interferon signaling, Antigen presentation pathway and Activa-tion of IRF by cytosolic pattern RecogniActiva-tion Receptors were shown in Figure 5 (lower panel). From these observations we propose thatMta1might have critical functional role in orphan nuclear receptor activation, inflammation and infections. Simi-larly, top 15 plausible functions of the genes regulated byMta1in the absence ofP53were identified and shown in Figure 6 (upper panel). The most significant function of the genes was found to be related to ‘Cancer’ followed by ‘Cellular Movement’ and ‘Connective Tissue Disorders’. The top 15 canonical pathways in which the genes might be involved were identified and shown in the Figure 6 (lower panel). The most significant canonical pathway identified is ‘Acute Phase response Signaling’ followed by Colorectal Cancer Metastasis Signaling, Hepatic fibrosis and ‘Bladder Cancer Signaling’. Clearly the genes regulated byMta1
in the absence ofP53highlight the typical oncogenic character of
Mta1and its possible major role in several cancers and oncogenic signaling pathways.
Table 6.GO Analysis of the genes differentially regulated between theMta1-KO andMta1- KO/Mta1 probes with$2.0 fold change.
GO ACCESSION GO Term p-value
corrected p-value
Count in Selection
% Count in Selection
Count in Total
% Count in Total
GO:0044421 extracellular region part
2.56E-12 0.00 53 72.60 2157.00 12.08
GO:0005615 extracellular space 1.18E-11 0.00 53 72.60 2038.00 11.42 GO:0005576 extracellular region 2.18E-11 0.00 61 83.56 2627.00 14.72
GO:0006955 immune response 1.01E-07 0.01 16 21.92 405.00 2.27
GO:0022610 biological adhesion 6.43E-06 0.28 15 20.55 541.00 3.03
GO:0007155 cell adhesion 6.43E-06 0.28 15 20.55 541.00 3.03
doi:10.1371/journal.pone.0017135.t006
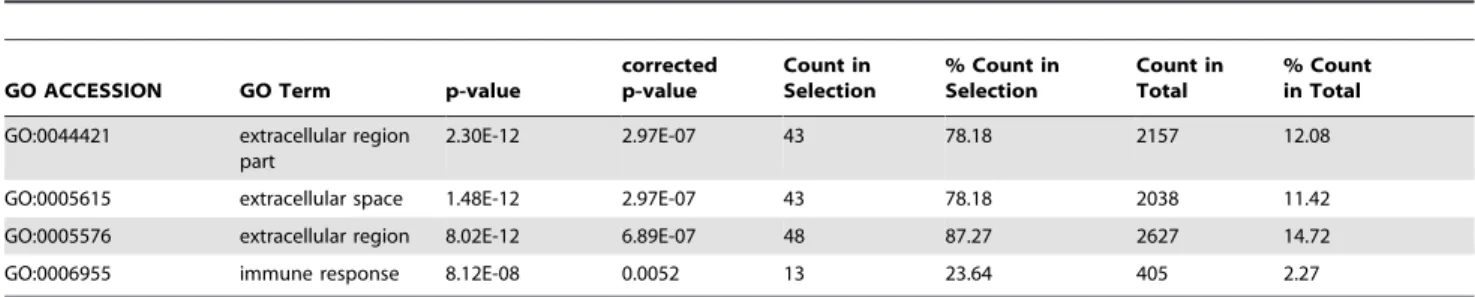
Table 7.GO Analysis of the bona fideMta1regulated genes in the presence ofP53with$2.0 fold change.
GO ACCESSION GO Term p-value
corrected p-value
Count in Selection
% Count in Selection
Count in Total
% Count in Total
GO:0044421 extracellular region part
2.30E-12 2.97E-07 43 78.18 2157 12.08
GO:0005615 extracellular space 1.48E-12 2.97E-07 43 78.18 2038 11.42 GO:0005576 extracellular region 8.02E-12 6.89E-07 48 87.27 2627 14.72
GO:0006955 immune response 8.12E-08 0.0052 13 23.64 405 2.27
The identifiedMta1regulated candidate genes and their human homologs follow similar expression profile in MEFs and human breast cancer cell lines
Based upon our analysis and our laboratory interest, some of the genes that were regulated byMta1with/withoutP53back ground were selected for the validation using the RT-qPCR assays. Validations were first performed in the MEFs followed by the MCF7 human breast cancer cell line. The results showing relative mRNA levels, for the selected genes, are presented in Figure 7. The controls are compared with the treatments and if the trend of expression (up or down regulation) in qPCR is in agreement with the microarray gene expression, then the respective homologous genes were selected for further validation in the human breast cancer cell line (MCF7). Aw551984 gene is the homolog of the human geneVWA5A, also known as BCSC-1. Monaco et al (1997) characterized and proposed that this gene could be a tumor suppressor [39,40]. We found that bothAw551984/VWA5Awere negatively regulated byMta1 inMEFs and human breast cancer cells. In the case of VWA5A, the expression trend is similar in MEFs and MCF7 cells but the difference in expression levels between the WT andMTA1knockdown in the MCF7 cell line is marginal. Up regulation of this gene was observed in Mta1-KO andMTA1-siRNAknock down samples when compared to the wild type MEFs and MCF7cells respectively. Another candidate, early growth response protein 2 [encoded by Egr2] and its human homolog was found to follow similar trend in MEFs and MCF7 cell line with significant difference in expression levels when compared between wild type and Mta1-KO. Finally, Phf17, a known apoptosis promoter which may act as a renal tumor suppressor [41] is found to be down regulated in theMta1knock out MEFs. As expected the expression pattern of all these candidates is in agreement with the above described microarray data. Together, the expression of these representative genes
highlights the possible interplay between the tumor suppressors (Aw551984,Egr2), apoptotic protein(Phf17)and oncogene(Mta1). The bar charts (7A, 7B, 7C) in Figure 7 show the expression levels of these three genes from the RT-qPCR assay and the Affymetrix microarray data.
We also selected candidate genes that are regulated byMta1, in the absence ofP53, from the microarray data and subjected them to the RT-qPCR validation. The relative expression levels of these genes in the controls and treatments are shown in the Figure 7 (7D, 7E, 7F). The data clearly shows the agreement between the microarray and the RT-qPCR results. We have chosenRnf144a
which contains RING figure motif and established to have role in protein-DNA and protein-protein interactions. We found that
Rnf144a was upregulated in the absence of P53 and over expression ofMta1. Another selected candidate wasHmmr, which encodes Hyaluronan mediated motility receptor protein that is found to be expressed in the breast tissue. It is notable that the
Hmmrgene was found to be down regulated inP53-KO, whereas it was up regulated in P53-KO/MTA1 when compared with the WT. The third candidate gene, Klf15which encodes a protein called kruppel like factor-15 was found to be highly up-regulated inP53-KO MEFs where as it is only weakly up-regulated inP53 -KO/Mta1, when compared with the wild type. The expression levels from the RT-qPCR assay and the Affymetrix microarray data are in perfect agreement for all the chosen candidates in MEFs (Figure 7).
RT-qPCR assays were also conducted with human homologs to validate the genes that were believed to be regulated by Mta1in MEFs. This step of validation is performed with theMta1knock down (Mta1siRNA) in MCF7compared with the non-target control siRNA. Similar differential gene expression levels were observed among all the genes (VWA5A,EGR2,RNF144A,KLF15,and HMMR) which are similar to the microarray expression profile (Figure 8).
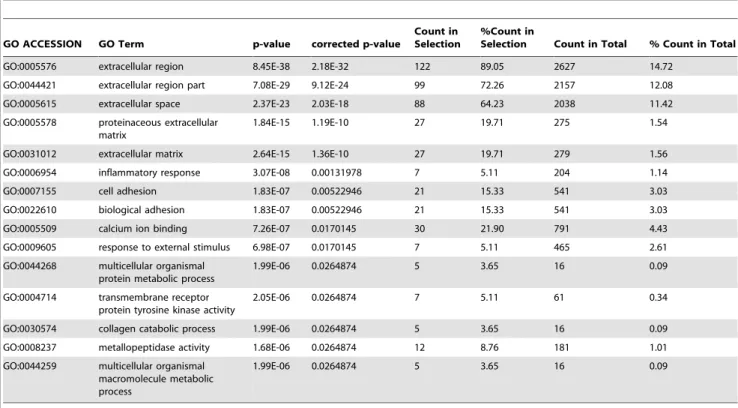
Table 8.GO Analysis of the bona fideMta1regulated genes in the absence ofP53with$2.0 fold change.
GO ACCESSION GO Term p-value corrected p-value
Count in Selection
%Count in
Selection Count in Total % Count in Total
GO:0005576 extracellular region 8.45E-38 2.18E-32 122 89.05 2627 14.72 GO:0044421 extracellular region part 7.08E-29 9.12E-24 99 72.26 2157 12.08 GO:0005615 extracellular space 2.37E-23 2.03E-18 88 64.23 2038 11.42 GO:0005578 proteinaceous extracellular
matrix
1.84E-15 1.19E-10 27 19.71 275 1.54
GO:0031012 extracellular matrix 2.64E-15 1.36E-10 27 19.71 279 1.56 GO:0006954 inflammatory response 3.07E-08 0.00131978 7 5.11 204 1.14
GO:0007155 cell adhesion 1.83E-07 0.00522946 21 15.33 541 3.03
GO:0022610 biological adhesion 1.83E-07 0.00522946 21 15.33 541 3.03 GO:0005509 calcium ion binding 7.26E-07 0.0170145 30 21.90 791 4.43 GO:0009605 response to external stimulus 6.98E-07 0.0170145 7 5.11 465 2.61 GO:0044268 multicellular organismal
protein metabolic process
1.99E-06 0.0264874 5 3.65 16 0.09
GO:0004714 transmembrane receptor protein tyrosine kinase activity
2.05E-06 0.0264874 7 5.11 61 0.34
GO:0030574 collagen catabolic process 1.99E-06 0.0264874 5 3.65 16 0.09 GO:0008237 metallopeptidase activity 1.68E-06 0.0264874 12 8.76 181 1.01 GO:0044259 multicellular organismal
macromolecule metabolic process
1.99E-06 0.0264874 5 3.65 16 0.09
Discussion
This study represents a complete genome wide screen for possible target genes of a transcriptional co regulator,Mta1. In addition to identifying ‘‘bona fide’’ Mta1 target genes, the influence of p53 on Mta1 gene regulation and molecular function has also been analyzed extensively. Emerging literature on Mta1clearly establishes bidirectional interplay between the oncogene, MTA1 and the tumor suppressor, P53. Although
Mta1 was found to be a component of the Nucleosome Remodeling and Deacetylase (NuRD) complex, recent studies from our laboratory establishes the functions of MTA1 in
DNA-damage response in a P53-dependent and -independent manner [24,30,34]. This raises the compelling question of how P53
influences the gene regulation and overall function of MTA1. We attempted to address this question using microarray approach. The first goal of identifying ‘‘bona fide’’Mta1targets have been achieved by initial comparison of genes regulated by
Mta1wild type and theMta1knockout. Subsequently, this set of genes was compared with the set identified from the compar-ative study ofMta1knock out vs.Mta1re-expressed in the knock out MEFs. The common genes identified from both com-parisons reflect the Mta1 ‘‘bona fide’’ targets (Table 3 and Table S5). To achieve the goal of defining oncogenic gene Figure 5. Ingenuity Pathway Analysis (Ingenuity Systems, Inc) of the genes that were regulated byMta1in the presence ofP53was performed.The significance of each function or canonical pathway is determined based upon thep-values determined using Right tailed Fisher’s exact test and with threshold less than 0.05. The top 15 possible functions and canonical pathways of the genes regulated byMta1inP53dependent manner are shown. Ratio of number of genes in a given pathway satisfying the cutoff and total number of genes present in that pathway was determined by IPA.
profile of Mta1, we have mimicked most cancer scenarios i.e. loss ofP53and the over expression of oncogenes such asMta1
and comparedP53knock out andP53knockout in which there was over expression of Mta1 gene. Interestingly, the identified 266 genes (Table 4) are mostly involved in DNA damage response. This is in agreement with the recently established
Mta1 function in DNA damage which is independent of P53. Together, these data further illustrate the possible genes that are regulated by Mta1‘‘fail safe’’ mechanism which occurs due to loss ofP53.
The gene ontology analysis again highlights the influence ofP53
onMta1function. IfP53is present, the targets regulated byMta1
play no remarkable role in the molecular functions such as catalytic activity or binding where as in the absence ofP53about 39% of genes regulated by Mta1 are involved in molecular
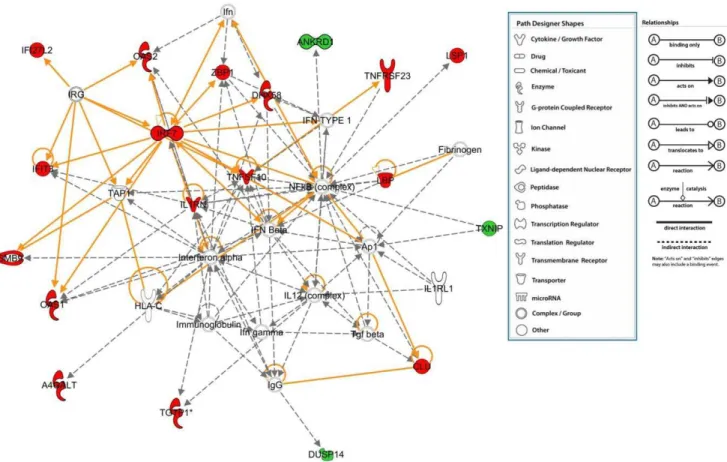
functions, clearly indicating the influence ofP53 on Mta1 gene regulation. Further extensive comparative analysis of all the data using IPA and networks reveals two distinct functional themes. In the presence of P53, the genes regulated by Mta1 are mainly involved in the inflammatory response cancer and cellular movement. Whereas, in the absence ofP53the genes regulated are predominantly related to cancer signaling reflecting the significance of Mta1 in cancer. In agreement to the above mentioned observations, the top networks and pathways regulated by Mta1 in the presence of P53 appear to be antimicrobial response, inflammatory response and carbohydrate metabolism (Figure 9). For instance, most of the genes regulated by Mta1
revolve around major complexes such as IRF7 (Interferon regulatory factor-7), which has been shown to play important role in the transcriptional activation of virus inducible cellular genes. In Figure 6. Ingenuity Pathway Analysis (Ingenuity Systems, Inc) of the genes that were regulated byMta1in the absence ofP53was performed.Fisher’s exact test was used and threshold of 0.05 was set as the cutoff. Top 15 functions associated with the genes and the top 15 canonical pathways in which these genes might have a role are shown.
addition, as a part of innate antiviral immunity, the induction of systemic IFN takes place through IRF7 [42]. Another gene, Immunity-related GTPases (IRG) that play an important role in defense against intracellular pathogens and NFKB complex which
has been well ascertained to be regulated byMta1were also found in the network. In agreement with our data recent studies suggest
MTA1regulating its target genes either by acting as a corepressor [18,19] or as transcriptional coactivator [20,21] via interacting
with RNA polymerase II. Together, these findings raise the possibility that Mta1 may play a significant role in protecting regulation of innate immune response by directly modulating several pathways including NF-kB signaling [43]. Our data further supports this notion and emphasizes the role of Mta1 in inflammation.
In contrast to that, in the absence of P53,Mta1 target genes appear to be mainly involved in cancer and genetic disorders Figure 7. RT-qPCR validation of the microarray data showing the differential regulation of the selected genes in the MEFs.The RNA extracted from the fibroblasts of the wild type (light blue bars) mice was used as the control and the treatments wereMta1-KO (red bars) &Mta1-KO/ Mta1(green bars). In the presence ofP53relative mRNA levels of the genesAw551984,Egr2,Phf17were compared in all the three samples. The relative mRNA levels from microarray for the same sample sets were plotted and compared with the RT-qPCR. As expected, opposite trends of expression were observed between the knock out and re-expression models. To validate the genes regulated byMta1in the absence ofP53relative mRNA levels were compared among the three samples wild type (light blue bars),P53-KO (dark blue bars) &P53-KO/Mta1(yellow bars) for the genesHmmr,Klf15, Rnf144a.The relative mRNA levels from the microarray were plotted and compared with RT-qPCR. Opposite trends of expression were observed between theP53-KO andP53-KO/Mta1treatments when compared with the wild type sample.
(Figure 10). For instance, many direct and indirect interactions were found with well studied cancer molecules such as Kirsten rat sarcoma viral oncogene homolog (KRAS) [44,45], epidermal growth factor receptor (EGFR) [46–48] and vascular endothelial growth factor (VEGF) [49,50] further highlighting the P53 -independent central functions ofMta1in metastasis and cancer. Thus, MTA1 appears to be playing distinct molecular functions depending on the status ofP53. In summary, our data presents complete gene profiling ofMta1 in the presence and absence of
P53 representing a new resource and guide for future area of
Mta1 research which is unexplored but comprises several key elements that could be employed in the development of anticancer therapeutics and identification of novel functions of
Mta1.
Materials and Methods Cell Culture
Wild type Murine Embryonic Fibroblasts (MEFs) and Mta1 -KO MEFs were obtained as described previously [35].P53knock
out MEFs were kindly provided by Dr. G. Lozano (M.D. Anderson Cancer Center, Houston, TX). MEFs and MCF7 (Michigan Cancer Foundation-7 human breast cancer cell line) were cultured in DMEM/F-12 medium containing 10% fetal bovine serum (FBS-Difco Laboratories, Detroit, Michigan) and 1% antibiotic-antimycotic solution in a humidified 5% CO2 at 37uC. Cell culture reagents were purchased from Invitrogen (Carlsbad, CA).Mta1+/+
, Mta12/2,Mta12/2/Mta1, p532/2and
p532/2/Mta1 MEFs have been described previously [23,24]. Human MTA1 and non target control siRNA smart pools were obtained from Dharmacon, Inc. MCF7 cells were obtained from ATCC (ATCC number: HTB-22) Transfection into MCF7 cells was performed with Oligofectamine reagent (Invitrogen) and manufacturer’s instructions were followed. Cells were collected after 36–48 hours after transfection.
RNA Extraction & Microarray Gene Expression Arrays Microarray gene expression assays have been performed as described previously [30]. In summary total RNA was extracted from the cells using Trizol (Invitrogen, Carlsbad, CA) and the Figure 8. RT-qPCR was performed using the RNA obtained from the wild type MCF-7 cells and MCF-7 cells transfected with the
MTA1-siRNA.The differential regulation of the selected genes (EGR2,HMMR,KLF15,RNF144A,and VWA5A) was observed in agreement with the Microarray and the RT-QPCR in the MEFs.
manufacturer’s protocol was followed. The quality and the concentrations of the extracted RNA were checked using the Nano-Drop (Thermo scientific). RNA was then purified using RNeasy Mini Kit (Qiagen, Valencia, CA) and the integrity was tested on 6000 NanoChips using Agilent 2100 Bioanalyzer (Agilent Technologies, Santa Clara, CA). Finally, Affymetrix Mouse Exon 1.0 ST arrays were used for the hybridization, arrays were scanned and the expression data was obtained in the form of .CEL files.
Microarray data analysis
To analyze the data generated from the microarray experiments we used GeneSpring GX 10.0.2 (Agilent technol-ogies, Inc) software package for the data Quality Control and the statistical analysis of the microarray data. The method of Benjamini and Hochberg was applied for the multiple corrections with a p-value cut-off of 0.05 and fold change $62.0 to obtain the statistically significant genes. Heat maps for individual arrays were generated and the hierarchical cluster analysis was performed using MeV 4.5 [51]. Gene Ontology analysis was performed using GeneSpring GX 10.0.2 (Agilent Technologies). All data is MIAME compliant and the raw data has been deposited in Gene Expression Omnibus (GEO) as detailed on the Microarray Gene expression Data Society (MGED) society website (http://www.mged.org/Workgroups/ MIAME/miame.html).
Functional and Network Analysis
We used the Ingenuity pathway Analysis (Ingenuity Systems, Inc) to find the statistically significant pathways, functions and the networks in which the identified genes regulated by Mta1are possibly involved. Fischer’s exact test was used to identify the significant functions and pathways represented within the respective gene sets.
RT-qPCR
RT-qPCR analysis was performed following the protocol described previously [23,24]. In order to validate the microarray data we selected candidate genes and RT-qPCR assays were conducted (all the primers used in this study are listed in Table S10). 2mg of the total RNA was used for the first strand cDNA synthesis using the superscript III First-strand sys kit (Invitrogen), according to the manufacturer’s instructions in 21-ml reactions. These reactions were diluted 1:10 with nuclease-free water. Duplicates of the qPCR contained 2-ml of the first strand
cDNA, 1-ml of the intron-spanning primers specific for that particular mRNA sample, 2ml of nuclease free water and 5ml of SYBR Green (Bio-Rad, Hercules, CA). Reactions (10ml) were run
in 96-well optical plates (Bio-Rad, Hercules, CA). Average threshold cycle (Ct) values of 18S mRNA (chosen as normalizer) were subtracted from the corresponding average Ct values of a target mRNA to obtainDCt values. The relative RNA levels were then expressed as 22Dct.
Figure 9. Gene network analysis shows that the genes regulated byMta1in the presence ofP53are involved in the networks associated with antimicrobial and inflammatory responses (statistically most significant network).When compared with the wild type MEFs, the genes that were up regulated inMta1knockout MEFs are shown in red and the down regulated genes are shown in green. The network with the highest score from the IPA analysis was considered to be the most significant network and majority of the genes that were found in this network were up-regulated.
Supporting Information
Figure S1 Western blot assay of the five samples (WT, Mta1-KO, Mta1-KO/Mta1, P53-Mta1-KO, and P53-KO/Mta1) was per-formed using Mta1 antibody as described previously [30] and the levels of Mta1 in all the five conditions are shown.a-Tubulin was used as the internal control.
(TIF)
Table S1 Complete list of the differentially expressed probe sets on the Affymetrix Mouse Exon 1.0 ST arrays between the wild type and theMta1knock out MEFs.
(XLS)
Table S2 The statistical summary of the log 2 ratio values for the differentially expressed probe sets on the Affymetrix Mouse Exon 1.0 ST arrays between the wild type and the Mta1 knock out MEFs.
(DOC)
Table S3 Complete list of the differentially expressed probe sets on the Affymetrix Mouse Exon 1.0 ST arrays between theMta1
knockout (Mta1-KO) MEFs andMta1reintroduced into the knock out MEFs (Mta1-KO/Mta1).
(XLS)
Table S4 The statistical summary of the log 2 ratio values for the differentially expressed probe sets on the Affymetrix Mouse Exon 1.0 ST arrays between theMta1knockout (Mta1-KO) MEFs and
Mta1reintroduced into the knock out MEFs (Mta1-KO/Mta1). (DOC)
Table S5 The ‘Bona fide’ genes that are regulated byMta1. (DOC)
Table S6 Complete list of the differentially expressed probe sets on the Affymetrix Mouse Exon 1.0 ST arrays between the P53
knock out (P53-KO) andP53knockout MEFs with over expression ofMta1(P53-KO/Mta1).
(XLS)
Table S7 The statistical summary of the log 2 ratio values for the differentially expressed probe sets on the Affymetrix Mouse Exon 1.0 ST arrays in MEFs between theP53knockout (P53-KO) and
P53 knockout MEFs with over expression of Mta1 (P53-KO/
Mta1). (DOC)
Table S8 Gene Ontology analysis of the genes differentially regulated between WT &Mta1-KO with$2.0 fold change. (DOC)
Figure 10. The genes differentially regulated (p-value,0.05 and fold change$±2.0) between theP53knock out and theP53knock out withMta1over expressed MEFs (Mta1regulated genes independent ofP53) were subjected to the network analysis and the most significant network found is associated with cancer and genetic disorders.Most of the genes in the network were found to be down regulated inP53-KO/Mta1when compared withP53-KO. All the upregulated genes are shown in red and the down regulated genes are shown in green color.
Table S9 Gene Ontology analysis of the ‘bona fide’ Mta1
regulated genes in the absence ofP53with$2.0 fold change. (DOC)
Table S10 Primer sequences for the candidate genes of Mus MusculusandHomo sapiensthat were used in the RT-qPCR assays are shown.
(DOC)
Acknowledgments
We would like to thank and all the members of Kumar laboratory for fruitful discussions and technical help.
Author Contributions
Conceived and designed the experiments: KSG DQL. Performed the experiments: KSG DQL. Analyzed the data: JE RK. Contributed reagents/materials/analysis tools: DQL. Wrote the paper: JE RK.
References
1. Auboeuf D, Honig A, Berget SM, O’Malley BW (2002) Coordinate regulation of transcription and splicing by steroid receptor coregulators. Science 298(5592): 416–419. 10.1126/science.1073734.
2. Lonard DM, O’Malley BW (2006) The expanding cosmos of nuclear receptor coactivators. Cell 125(3): 411–414. 10.1016/j.cell.2006.04.021.
3. Lonard DM, O’malley BW (2007) Nuclear receptor coregulators: Judges, juries, and executioners of cellular regulation. Mol Cell 27(5): 691–700. 10.1016/ j.molcel.2007.08.012.
4. McKenna NJ, Cooney AJ, DeMayo FJ, Downes M, Glass CK, et al. (2009) Minireview: Evolution of NURSA, the nuclear receptor signaling atlas. Mol Endocrinol 23(6): 740–746. 10.1210/me.2009-0135.
5. Collingwood TN, Urnov FD, Wolffe AP (1999) Nuclear receptors: Coactivators, corepressors and chromatin remodeling in the control of transcription. J Mol Endocrinol 23(3): 255–275.
6. Martini PG, Katzenellenbogen BS (2003) Modulation of estrogen receptor activity by selective coregulators. J Steroid Biochem Mol Biol 85(2–5): 117–122. 7. Germain P, Staels B, Dacquet C, Spedding M, Laudet V (2006) Overview of nomenclature of nuclear receptors. Pharmacol Rev 58(4): 685–704. 10.1124/ pr.58.4.2.
8. Nagaich AK, Rayasam GV, Martinez ED, Becker M, Qiu Y, et al. (2004) Subnuclear trafficking and gene targeting by steroid receptors. Ann N Y Acad Sci 1024: 213–220. 10.1196/annals.1321.002.
9. Novac N, Heinzel T (2004) Nuclear receptors: Overview and classification. Curr Drug Targets Inflamm Allergy 3(4): 335–346.
10. Pan Y, Tsai CJ, Ma B, Nussinov R (2010) Mechanisms of transcription factor selectivity. Trends Genet 26(2): 75–83. 10.1016/j.tig.2009.12.003.
11. Dobrzycka KM, Townson SM, Jiang S, Oesterreich S (2003) Estrogen receptor corepressors – a role in human breast cancer? Endocr Relat Cancer 10(4): 517–536. 12. Hsia EY, Goodson ML, Zou JX, Privalsky ML, Chen HW (2010) Nuclear receptor coregulators as a new paradigm for therapeutic targeting. Adv Drug Deliv Rev. 10.1016/j.addr.2010.09.016.
13. Manavathi B, Singh K, Kumar R (2007) MTA family of coregulators in nuclear receptor biology and pathology. Nucl Recept Signal 5: e010. 10.1621/nrs.05010. 14. Denslow SA, Wade PA (2007) The human mi-2/NuRD complex and gene
regulation. Oncogene 26(37): 5433–5438. 10.1038/sj.onc.1210611.
15. Toh Y, Pencil SD, Nicolson GL (1994) A novel candidate metastasis-associated gene, mta1, differentially expressed in highly metastatic mammary adenocar-cinoma cell lines. cDNA cloning, expression, and protein analyses. J Biol Chem 269(37): 22958–22963.
16. Toh Y, Pencil SD, Nicolson GL (1995) Analysis of the complete sequence of the novel metastasis-associated candidate gene, mta1, differentially expressed in mammary adenocarcinoma and breast cancer cell lines. Gene 159(1): 97–104. 17. Kumar R, Wang RA, Bagheri-Yarmand R (2003) Emerging roles of MTA
family members in human cancers. Semin Oncol 30(5 Suppl 16): 30–37. 18. Mazumdar A, Wang RA, Mishra SK, Adam L, Bagheri-Yarmand R, et al.
(2001) Transcriptional repression of oestrogen receptor by metastasis-associated protein 1 corepressor. Nat Cell Biol 3(1): 30–37. 10.1038/35050532. 19. Molli PR, Singh RR, Lee SW, Kumar R (2008) MTA1-mediated transcriptional
repression of BRCA1 tumor suppressor gene. Oncogene 27(14): 1971–1980. 10.1038/sj.onc.1210839.
20. Gururaj AE, Singh RR, Rayala SK, Holm C, den Hollander P, et al. (2006) MTA1, a transcriptional activator of breast cancer amplified sequence 3. Proc Natl Acad Sci U S A 103(17): 6670–6675. 10.1073/pnas.0601989103. 21. Balasenthil S, Gururaj AE, Talukder AH, Bagheri-Yarmand R, Arrington T,
et al. (2007) Identification of Pax5 as a target of MTA1 in B-cell lymphomas. Cancer Res 67(15): 7132–7138. 10.1158/0008-5472.CAN-07-0750. 22. Yao YL, Yang WM (2003) The metastasis-associated proteins 1 and 2 form
distinct protein complexes with histone deacetylase activity. J Biol Chem 278(43): 42560–42568. 10.1074/jbc.M302955200.
23. Li DQ, Ohshiro K, Reddy SD, Pakala SB, Lee MH, et al. (2009) E3 ubiquitin ligase COP1 regulates the stability and functions of MTA1. Proc Natl Acad Sci U S A 106(41): 17493–17498. 10.1073/pnas.0908027106.
24. Li DQ, Divijendra Natha Reddy S, Pakala SB, Wu X, Zhang Y, et al. (2009) MTA1 coregulator regulates p53 stability and function. J Biol Chem 284(50): 34545–34552. 10.1074/jbc.M109.056499.
25. Levine AJ (1997) P53, the cellular gatekeeper for growth and division. Cell 88(3): 323–331.
26. Maslon MM, Hupp TR (2010) Drug discovery and mutant p53. Trends Cell Biol 20(9): 542–555. 10.1016/j.tcb.2010.06.005.
27. Wang Z, Sun Y (2010) Targeting p53 for novel anticancer therapy. Transl Oncol 3(1): 1–12.
28. el-Deiry WS, Tokino T, Velculescu VE, Levy DB, Parsons R, et al. (1993) WAF1, a potential mediator of p53 tumor suppression. Cell 75(4): 817–825. 29. Harper JW, Adami GR, Wei N, Keyomarsi K, Elledge SJ (1993) The p21
cdk-interacting protein Cip1 is a potent inhibitor of G1 cyclin-dependent kinases. Cell 75(4): 805–816.
30. Li DQ, Pakala SB, Reddy SD, Ohshiro K, Peng SH, et al. (2010) Revelation of p53-independent function of MTA1 in DNA damage response via modulation of the p21 WAF1-proliferating cell nuclear antigen pathway. J Biol Chem 285(13): 10044–10052. 10.1074/jbc.M109.079095.
31. Li DQ, Ohshiro K, Khan MN, Kumar R (2010) Requirement of MTA1 in ATR-mediated DNA damage checkpoint function. J Biol Chem 285(26): 19802–19812. 10.1074/jbc.M109.085258.
32. Smeenk G, Wiegant WW, Vrolijk H, Solari AP, Pastink A, et al. (2010) The NuRD chromatin-remodeling complex regulates signaling and repair of DNA damage. J Cell Biol 190(5): 741–749. 10.1083/jcb.201001048.
33. Chou DM, Adamson B, Dephoure NE, Tan X, Nottke AC, et al. (2010) A chromatin localization screen reveals poly (ADP ribose)-regulated recruitment of the repressive polycomb and NuRD complexes to sites of DNA damage. Proc Natl Acad Sci USA 107(43): 18475–18480. 10.1073/pnas.1012946107. 34. Li DQ, Kumar R (2010) Mi-2/NuRD complex making inroads into
DNA-damage response pathway. Cell Cycle 9(11).
35. Manavathi B, Peng S, Rayala SK, Talukder AH, Wang MH, et al. (2007) Repression of Six3 by a corepressor regulates rhodopsin expression. Proc Natl Acad Sci U S A 104(32): 13128–13133. 10.1073/pnas.0705878104. 36. McMasters KM, Montes de Oca Luna R, Pena JR, Lozano G (1996) Mdm2
deletion does not alter growth characteristics of P53-deficient embryo fibroblasts. Oncogene 13(8): 1731–1736.
37. Sadr-Nabavi A, Ramser J, Volkmann J, Naehrig J, Wiesmann F, et al. (2009) Decreased expression of angiogenesis antagonist EFEMP1 in sporadic breast cancer is caused by aberrant promoter methylation and points to an impact of EFEMP1 as molecular biomarker. Int J Cancer 124(7): 1727–1735. 10.1002/ijc.24108. 38. Ali A, Yang OO (2006) A novel small reporter gene and HIV-1 fitness assay.
J Virol Methods 133(1): 41–47. 10.1016/j.jviromet.2005.10.016.
39. Monaco C, Negrini M, Sozzi G, Veronese ML, Vorechovsky I, et al. (1997) Molecular cloning and characterization of LOH11CR2A, a new gene within a refined minimal region of LOH at 11q23. Genomics 46(2): 217–222. 10.1006/ geno.1997.5036.
40. Gentile M, Ahnstrom M, Schon F, Wingren S (2001) Candidate tumour suppressor genes at 11q23–q24 in breast cancer: Evidence of alterations in PIG8, a gene involved in p53-induced apoptosis. Oncogene 20(53): 7753–7760. 10.1038/sj.onc.1204993.
41. Zhou MI, Foy RL, Chitalia VC, Zhao J, Panchenko MV, et al. (2005) Jade-1, a candidate renal tumor suppressor that promotes apoptosis. Proc Natl Acad Sci U S A 102(31): 11035–11040. 10.1073/pnas.0500757102.
42. Honda K, Yanai H, Negishi H, Asagiri M, Sato M, et al. (2005) IRF-7 is the master regulator of type-I interferon-dependent immune responses. Nature 434(7034): 772–777. 10.1038/nature03464.
43. Pakala SB, Bui-Nguyen TM, Reddy SD, Li DQ, Peng S, et al. (2010) Regulation of NF-kappaB circuitry by a component of the nucleosome remodeling and deacetylase complex controls inflammatory response homeostasis. J Biol Chem 285(31): 23590–23597. 10.1074/jbc.M110.139469.
44. Dunn EF, Iida M, Myers RA, Campbell DA, Hintz KA, et al. (2010) Dasatinib sensitizes KRAS mutant colorectal tumors to cetuximab. Oncogene. 10.1038/ onc.2010.430.
45. Normanno N, Tejpar S, Morgillo F, De Luca A, Van Cutsem E, et al. (2009) Implications for KRAS status and EGFR-targeted therapies in metastatic CRC. Nat Rev Clin Oncol 6(9): 519–527. 10.1038/nrclinonc.2009.111.
46. Bild AH, Potti A, Nevins JR (2006) Linking oncogenic pathways with therapeutic opportunities. Nat Rev Cancer 6(9): 735–741. 10.1038/nrc1976. 47. Bild AH, Yao G, Chang JT, Wang Q, Potti A, et al. (2006) Oncogenic pathway
signatures in human cancers as a guide to targeted therapies. Nature 439(7074): 353–357. 10.1038/nature04296.
49. Benest AV, Augustin HG (2009) Cancer: Blood vessels kept quiet. Nature 458(7234): 41–42. 10.1038/458041a.
50. Benson JD, Chen YN, Cornell-Kennon SA, Dorsch M, Kim S, et al. (2006) Validating cancer drug targets. Nature 441(7092): 451–456. 10.1038/ nature04873.