www.atmos-chem-phys.net/12/4033/2012/ doi:10.5194/acp-12-4033-2012
© Author(s) 2012. CC Attribution 3.0 License.
Chemistry
and Physics
Changing sources and environmental factors reduce the rates of
decline of organochlorine pesticides in the Arctic atmosphere
S. Becker1, C. J. Halsall1, W. Tych1, R. Kallenborn2,3, M. Schlabach2, and S. Manø2 1Lancaster Environment Centre, Lancaster University, Lancaster LA1 4YQ, UK
2Norwegian Institute for Air Research (NILU), P.O. Box 100, 2007 Kjeller, Norway
3The Norwegian University of Life Sciences (UMB), Department of Chemistry, Biotechnology and Food Scienc, P.O. Box 5003, 1432 Aas, Norway
Correspondence to: C. Halsall (c.halsall@lancaster.ac.uk)
Received: 15 October 2008 – Published in Atmos. Chem. Phys. Discuss.: 8 January 2009 Revised: 28 March 2012 – Accepted: 13 April 2012 – Published: 8 May 2012
Abstract. An extensive database of organochlorine (OC)
pesticide concentrations measured at the Norwegian Arctic monitoring station at Ny- ˚Alesund, Svalbard, was analysed to assess longer-term trends in the Arctic atmosphere. Dynamic Harmonic Regression (DHR) is employed to investigate the seasonal and cyclical behaviour of chlordanes, DDTs and hexachlorobenzene (HCB), and to isolate underlying inter-annual trends. Although a simple comparison of inter-annual mean concentrations (1994–2005) suggest a decline for all of the OCs investigated, the longer-term trends identified by DHR only show a significant decline forp, p′-DDT. Indeed, HCB shows an increase from 2003–2005. This is thought to be due to changes in source types and the presence of impu-rities in current use pesticides, together with retreating sea ice affecting air-water exchange. Changes in source types were revealed by using isomeric ratios for the chlordanes and DDTs. Declining trends in ratios of trans-chlordane/cis-chlordane (TC/CC) indicate a shift from primary sources, to more “weathered” secondary sources, whereas an increasing trend ino, p′-DDT/p, p′-DDT ratios indicate a shift from use of technical DDT to dicofol. Continued monitoring of these OC pesticides is required to fully understand the influence of a changing climate on the behaviour and environmental cycling of these chemicals in the Arctic as well as possible impacts from “new” sources.
1 Introduction
the Norwegian Arctic utilising data collected by the Nor-wegian Air Research Institute (NILU) at Ny- ˚Alesund, Sval-bard for the period 1994-2005. The following OC pesticide datasets: chlordanes (trans- and cis- isomers), DDTs, and hexachlorobenzene (HCB) were analysed with the use of dynamic harmonic regression (DHR), a sophisticated time-series modelling tool, to determine the seasonal behaviour and long-term temporal trends of these compounds. For ease of reading, these chemicals are considered separately throughout the paper.
Chlordane – Chlordane was used extensively on food and non-food agricultural crops, residential lawns and gardens, and in buildings for the control of structural pests such as termites. The use of this pesticide was banned in the major-ity of the world in the late 1980s, with use remaining high in areas such as California until 1988, when a ban was in-troduced in the US (Shigenaka, 1990; Connor et al., 2006). Chlordane is a mixture of different chlordane isomers, other chlorinated hydrocarbons and several other components. The two main constituents in the technical mixture are trans-chlordane (TC) and cis-trans-chlordane (CC), and both are re-ported in the Norwegian air dataset. Ratios of these two iso-mers can be used to indicate recent or ongoing use of the technical mixture as opposed to re-volatilisation from soils arising from historical use (Bidleman and Leone, 2004). The ratio of these compounds (TC/CC) found in the technical mixture used in the US is∼1.16 (Jantunen et al., 2000), al-though global ratios in technical chlordane have been seen to range from 1.26–1.35 TC/CC (Patton et al., 1991). A re-cent investigation by Hung et al. (2005) found that, although there were occasional spikes in TC/CC ratios observed at Alert between 1995–1997, these were usually related to high episodes of heptachlor, suggesting use of heptachlor contain-ing TC and CC at these times. Generally, a ratio of<1 in the atmosphere indicates an older source i.e. historical use and depletion of TC, whereas a ratio>1 indicates recent use of this pesticide. The average ratio in the early 2000s observed in the Arctic atmosphere was<1, suggesting that secondary sources from soils and vegetation are now the predominant contemporary sources to influence the Arctic (Bidleman et al., 2002).
DDTs – The use of DDT in its technical form was widely banned in the 1970s, but it is still permitted for use in some countries under special licence. For example, this chemical is still used in technical form for the control of disease vec-tors in countries such as Africa and South America and in anti-fouling paints in China (Li et al., 2007). Technical grade DDT is made up of≥80 %p, p′-DDT; ≥15 % o, p′-DDT
and smaller quantities ofp, p′- ando, p′-DDD. DDT is also used in the production of dicofol which is used to kill mites such as the red spider mite on crops (PAN, 2008). From 1988–2000, the annual production of DDT in China was esti-mated to be∼6000 t, of which∼80 % was used for the pro-duction of dicofol (Yang et al., 2007). DDT and chlorinated DDT (Cl-DDT) may remain as impurities after the
synthe-sis reactions involved in the production of dicofol (Zhang et al., 2002; Qiu et al., 2005; Li et al., 2006). Thep, p′- and
o, p′- isomers of DDT, DDE and DDD are investigated here
in order to assess temporal trends and changing source types. Ratios can be used to give an idea of the age of the source of DDT by taking a ratio of DDT/DDE + DDD, and whether the signal is from the use of Technical DDT or dicofol by taking a ratio ofo, p′-DDT/p, p′-DDT.
Hexachlorobenzene (HCB) – HCB has had several uses in industry and agriculture, as a porosity control agent, a fungicide and as a wood preserving agent. Bans or restric-tions on use were implemented throughout the period 1960– 2000, with the latest recorded ban being introduced in 2003 in Canada. The use of HCB as an intermediate (mainly for chemicals used in pyrotechnics) occurs in China and Rus-sia (Xu et al., 2004; Barber et al., 2005). Global HCB emis-sions from all emission types have been estimated at between 12 000–92 000 kg yr−1 based on information from the mid 1990s (Bailey, 2001).
2 Methods
2.1 Air monitoring database
Atmospheric samples were collected weekly over a period of 48 h at Ny- ˚Alesund, Svalbard, Norway (78◦55′N/11◦56′E). The database extends back to 1993; however as air samples were not taken systematically throughout 1993, this year has been excluded from the data analysis. Details of air concen-trations for this period can be found in an earlier publication by Oehme et al. (1996). The systematic analysis of the DDTs did not begin until 1994, although these were measured dur-ing shorter sampldur-ing campaigns prior to this.
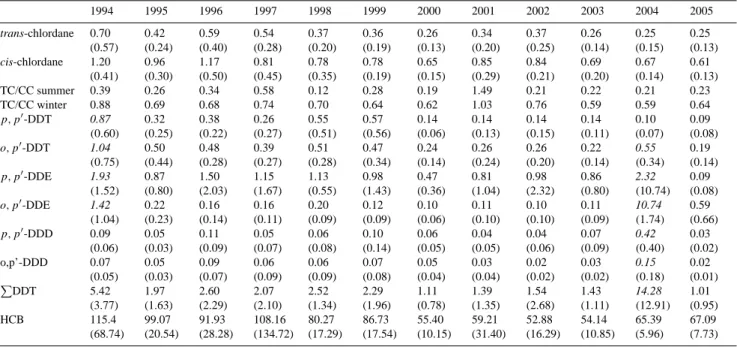
Table 1. Annual arithmetic means in pg m−3(standard deviation) for trans-chlordane (TC) and cis-chlordane (CC), DDT (individual com-pounds and total DDT) and HCB measured at Zeppelin, Svalbard, Norway 1994–2005. The average summer (June-August) and winter (January–March) ratios of TC/CC are also given.
1994 1995 1996 1997 1998 1999 2000 2001 2002 2003 2004 2005
trans-chlordane 0.70 (0.57) 0.42 (0.24) 0.59 (0.40) 0.54 (0.28) 0.37 (0.20) 0.36 (0.19) 0.26 (0.13) 0.34 (0.20) 0.37 (0.25) 0.26 (0.14) 0.25 (0.15) 0.25 (0.13) cis-chlordane 1.20 (0.41) 0.96 (0.30) 1.17 (0.50) 0.81 (0.45) 0.78 (0.35) 0.78 (0.19) 0.65 (0.15) 0.85 (0.29) 0.84 (0.21) 0.69 (0.20) 0.67 (0.14) 0.61 (0.13)
TC/CC summer 0.39 0.26 0.34 0.58 0.12 0.28 0.19 1.49 0.21 0.22 0.21 0.23
TC/CC winter 0.88 0.69 0.68 0.74 0.70 0.64 0.62 1.03 0.76 0.59 0.59 0.64
p, p′-DDT 0.87
(0.60)
0.32 (0.25) 0.38 (0.22) 0.26 (0.27) 0.55 (0.51) 0.57 (0.56) 0.14 (0.06) 0.14 (0.13) 0.14 (0.15) 0.14 (0.11) 0.10 (0.07) 0.09 (0.08)
o, p′-DDT 1.04
(0.75)
0.50 (0.44) 0.48 (0.28) 0.39 (0.27) 0.51 (0.28) 0.47 (0.34) 0.24 (0.14) 0.26 (0.24) 0.26 (0.20) 0.22 (0.14) 0.55 (0.34)
0.19 (0.14)
p, p′-DDE 1.93
(1.52)
0.87 (0.80) 1.50 (2.03) 1.15 (1.67) 1.13 (0.55) 0.98 (1.43) 0.47 (0.36) 0.81 (1.04) 0.98 (2.32) 0.86 (0.80) 2.32 (10.74)
0.09 (0.08)
o, p′-DDE 1.42
(1.04)
0.22 (0.23) 0.16 (0.14) 0.16 (0.11) 0.20 (0.09) 0.12 (0.09) 0.10 (0.06) 0.11 (0.10) 0.10 (0.10) 0.11 (0.09) 10.74 (1.74)
0.59 (0.66)
p, p′-DDD 0.09
(0.06) 0.05 (0.03) 0.11 (0.09) 0.05 (0.07) 0.06 (0.08) 0.10 (0.14) 0.06 (0.05) 0.04 (0.05) 0.04 (0.06) 0.07 (0.09) 0.42 (0.40)
0.03 (0.02) o,p’-DDD 0.07 (0.05) 0.05 (0.03) 0.09 (0.07) 0.06 (0.09) 0.06 (0.09) 0.07 (0.08) 0.05 (0.04) 0.03 (0.04) 0.02 (0.02) 0.03 (0.02) 0.15 (0.18)
0.02 (0.01) P DDT 5.42 (3.77) 1.97 (1.63) 2.60 (2.29) 2.07 (2.10) 2.52 (1.34) 2.29 (1.96) 1.11 (0.78) 1.39 (1.35) 1.54 (2.68) 1.43 (1.11) 14.28 (12.91)
1.01 (0.95) HCB 115.4 (68.74) 99.07 (20.54) 91.93 (28.28) 108.16 (134.72) 80.27 (17.29) 86.73 (17.54) 55.40 (10.15) 59.21 (31.40) 52.88 (16.29) 54.14 (10.85) 65.39 (5.96) 67.09 (7.73)
Note: Unusually high concentrations in 1994 and 2004 are in italic.
and updated in Excel spreadsheet format, with data periodi-cally fed into AMAP and the Co-operative Programme for Monitoring and Evaluation of the Long Range Transmis-sion of Air Pollutants in Europe (EMEP) programmes (e.g. AMAP, 2002).
2.2 Trend analysis using Dynamic Harmonic Regression (DHR)
DHR is a sophisticated time-series analysis tool using stochastic time variable parameters (TVPs), which can evolve over time thus allowing the tracking of changes in source strengths and types. Due to this, and the estimation method applied, quantitative confidence can be attributed to the resulting ‘smooth’ trend lines estimated using this tool. This modelling approach has been described in detail elsewhere (Young, 1999; Young et al., 1999; Tych et al., 2002; Becker et al., 2006, 2008). In brief, DHR identifies trend (non-linear), seasonal, cyclical and irregular (or un-modelled) components in the time-series data set which then can be used to present an overall trend and temporal evolu-tion of seasonal components. A simpler form of the model is used here as the cyclical component is not modelled. This is described by Eq. (1).
yt=Tt+St+et (1)
where ytis the time series; Ttis a longer term trend or low-frequency, slowly changing component; Stthe seasonal com-ponent and et an irregular or “noise” component due to the
inherent variations found in atmospheric data caused, for ex-ample, by incursions of polluted or ‘clean’ air masses over the sampling site.
Fortnightly (bi-weekly) concentrations were used for the time-series analysis. Missing values or outliers (deemed as >3∗inter-quartile range – see Becker et al. (2008)) were re-placed by a “NaN flag” (not a number) allowing DHR to in-terpolate across these points. The quality control procedures applied to the dataset ensure that only those weekly concen-trations deemed above the method detection limits were in-cluded in the dataset (Oehme et al., 1995).
3 Results and discussion
are interpreted and related to changing patterns in use and source distribution.
Chlordanes – Both of the isomers (trans- and cis-) show a slight decline throughout the time series, although con-centrations recorded at the beginning of the sampling cam-paign are not statistically different from earlier camcam-paigns conducted in the spring of 1992 and March-December of 1993 (Oehme et al., 1995, 1996) (see Table 1). These earlier studies report average concentrations of 0.55±0.23 pg m−3 for trans-chlordane (TC) and 0.98±0.38 pg m−3 for cis-chlordane (CC) in 1992 (0.53 and 1.09 pg m−3 in 1993) (Oehme et al., 1995, 1996). The concentrations in 1992 were also found to be similar to those reported in 1984 (Oehme et al., 1995). Average concentrations of TC and CC measured at Alert were 0.32 and 0.75 pg m−3, respectively, for the period 2002–2003 and were similar to those observed at Zeppelin.
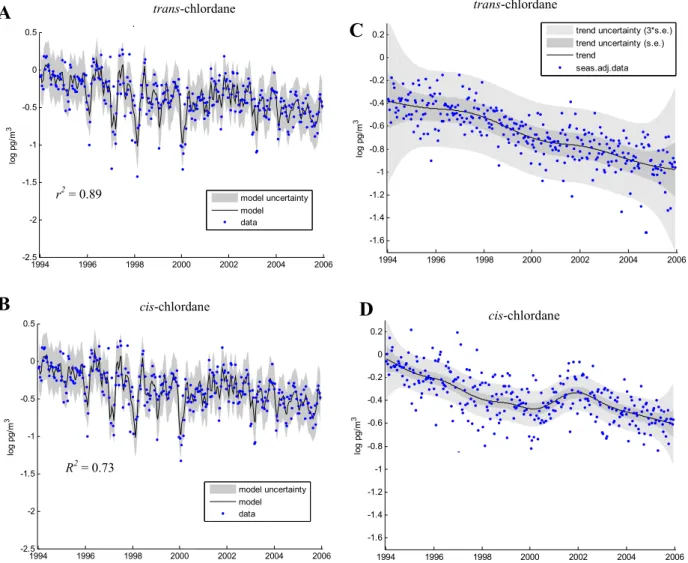
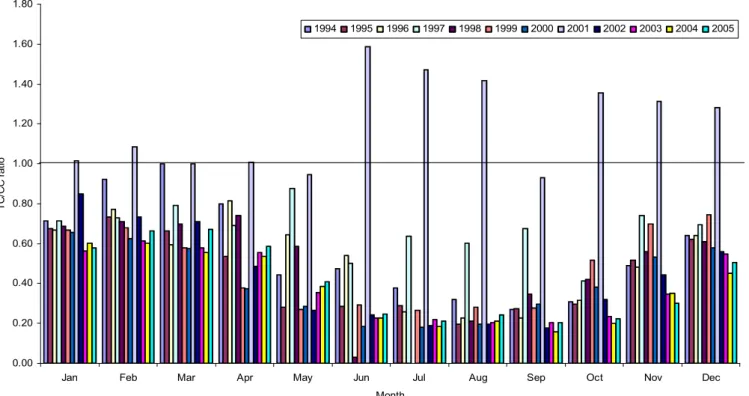
Both TC and CC display seasonal variations, although there are different patterns observed for the two isomers. Fig-ure 1 presents the observed data and the DHR model fit for both TC (A) and CC (B). Strong annual signals are identi-fied by DHR for TC, marked by distinct winter maxima and summer minima, together with a weaker 6 monthly pattern. In contrast, CC shows a stronger 6 monthly (bi-modal) pat-tern, again with winter maxima, but with two, more distinct “peaks” in spring (March–May), and September–November. These seasonal differences could be due to the preferential photodegradation of TC during the summer months, com-pared to CC (Oehme, 1991). This seasonality is also sup-ported by examining the ratios of TC/CC. In 1984, the av-erage summer ratio was∼0.5 and the average winter ratio was∼1 (Oehme, 1991). The latter winter ratio is similar to the ratio of technical chlordane, and the author attributes this to long-range transport primarily from North America, al-though some episodes were associated with air masses orig-inating from southern Europe. Chlordanes were not used in central Europe (Bidleman et al., 1987) so episodes of ele-vated concentrations may be attributed to chlordane use in countries such as Spain or Portugal, from exchange with sur-face sea water, or mixing with polluted air masses over the North Atlantic. Annual average ratios of TC/CC ranged from 0.12–0.58 in summer (June–August) and 0.59–0.88 in winter (January–March). The values from 2001 (i.e. 1.49 in sum-mer; 1.03 in winter) are not included in these ranges as sev-eral values in this year were determined when the concentra-tions of either TC or CC were at or below the method de-tection limit, with the effect of skewing the calculated ratios. The seasonal ratios for each year are given in Table 1 and the average monthly ratios are displayed in Fig. 2 to show the pattern relating to summertime depletion (possibly reflecting enhanced photodegradation) of TC. Ratios ranging from 0.78 to 1.29 in the Canadian Arctic, just west of Ellesmere Island in February to April in 1988 (Patton et al., 1991) could be in-dicative of use patterns at this time. Previously TC/CC ratios reported for sampling campaigns during the same period at a number of Arctic sites were all<1 in 1993/1994 (Halsall
et al., 1998). An increase in ratios between 1993–1997 mea-sured at Alert with several episodes where ratios were>1 were attributed to sporadic fresh applications of chlordane-based pesticides (Hung et al., 2002, 2005). In more recent investigations at Alert and other Arctic locations (with the exception of Point Barrow, Alaska) all ratios have been re-ported to be<1 reflecting a ‘weathered’ signal, probably re-sulting from re-emissions from contaminated soils (Hung et al., 2005; Su et al., 2008). The higher ratios seen at Point Bar-row in 2000–2003 were attributed to applications of technical heptachlor containing TC and CC, as the higher ratios coin-cided with higher than average heptachlor concentrations (Su et al., 2008).
The long-term trends of TC and CC, as depicted by DHR, in Fig. 1 (c and d) show a decline throughout the time-series, although these were only slight. Whilst the decline for CC was not consistent across the time-series, with an increasing trend observed from 2000–2002, both isomers have decreased over the 12 yr period. Berg et al. (2004) did not observe any trend when analysing data from Zep-pelin from 1993–2002, and this current study only shows a decrease of log 0.6 pg m−3(0.25 pg m−3) in concentrations when comparing the beginning and end of the model trend lines. Similarly, trends seen at Alert for the period 1993 to 1999 demonstrated only a slight decline (Hung et al., 2005). There are several factors which may influence the rates of decline for these two isomers. The shallow gradient of the fitted trend lines, probably reflect the fact that these chem-icals are still being introduced into the atmosphere through re-volatilisation from soils (Bildeman et al., 2004, Bidleman and Leone, 2004); although re-volatilisation from ice-free Arctic Ocean surface waters into the overlying atmosphere is uncertain, due to the lack of measurements. The use of technical heptachlor which contains both TC and CC may also influence levels in the contemporary arctic atmosphere (Hung et al., 2002). The difference in degradation rates for the two isomers may also influence their relative decline. The potential of TC to be degraded through photolysis has been mentioned previously, however, this isomer is also thought to be preferentially degraded by marine biota from several trophic levels, and is more readily metabolised to oxychlor-dane, compared to the more stable CC isomer (Kawano et al., 1988).
DDTs – Elevated concentrations of the DDTs observed in 2004 (with the exception ofp, p′-DDT) are highlighted in Table 1. These were apparent from mid-June to December witho, p′-DDE showing the highest concentrations,
!
! " #
!
!
! " #
!
= 0.89
6chlordane
A
B
6chlordane= 0.73
!
" # $ % & " # $ &
'
!
" # $ % & " # $ &
'
6chlordane
C
D
6chlordaneFig. 1. Measured data and model fit for trans-chlordane (A) and cis-chlordane (B) with goodness of fit between observed data and model fit expressed by ther2value (p <0.05). Seasonally adjusted data and underlying trends are provided in plots (C) (trans-chlordane) and (D) (cis-chlordane).
over the same period. Nonetheless, elevated DDT concentra-tions during 2004 are apparent at both the Canadian and Nor-wegian monitoring stations, indicating some regional source or event that lead to these high concentrations. A study by Eckhardt et al. (2007), found that extensive forest fires in sub-Arctic regions, and areas further south, were a source of previously deposited POPs to the atmosphere, including the DDTs. Atmospheric long-range transport resulted in this fire “signal;; being observed at Zeppelin, although this was 3–4 weeks later than at the monitoring stations of Barrow (Alaska) and Summit (Greenland) due to the greater distance involved. Back trajectories carried out for 24–26 July 2004 (when high values of aerosol light absorption coefficients were measured at Zeppelin) showed air mass origins within the boreal forest region, with air bypassing Alert, but affect-ing Zeppelin (Eckhardt et al., 2007). This is a possible
ex-planation of the elevated values observed at Zeppelin during this period.
The seasonality and longer term trend of DDTs identified by DHR do not appear to be affected by ‘episodes’ that oc-curred in 2004, with the exception ofo, p′-DDE. For this rea-son, the trend analysis was conducted using the entire time-series for all the DDTs, excepto, p′-DDE, which was inves-tigated from 1994–2003 only.
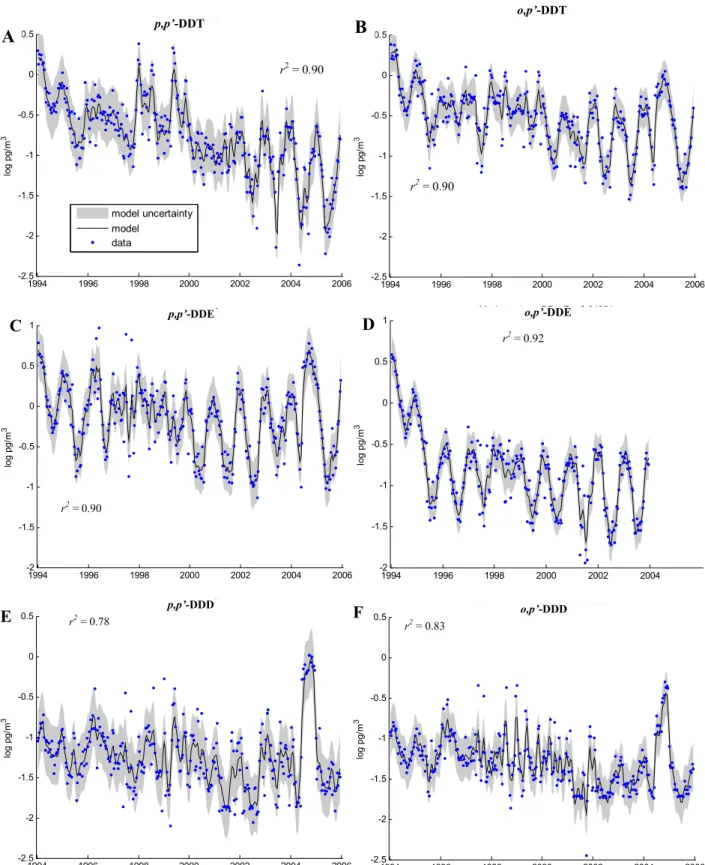
The seasonality displayed by DDTs is broadly charac-terised by winter maxima and summer minima, although this is less apparent for the DDDs. This was identified by DHR, with the most pronounced seasonality observed for the DDEs (especiallyo, p′-DDE). These seasonal patterns are shown in
( ) * + # (" (" +" , - . / 0
1
2
2
2
24
Fig. 2. Average monthly TC/CC ratios at Zeppelin 1994–2005.
systematic data) (Halsall et al., 1998; Bailey et al., 2000; Hung et al., 2002).
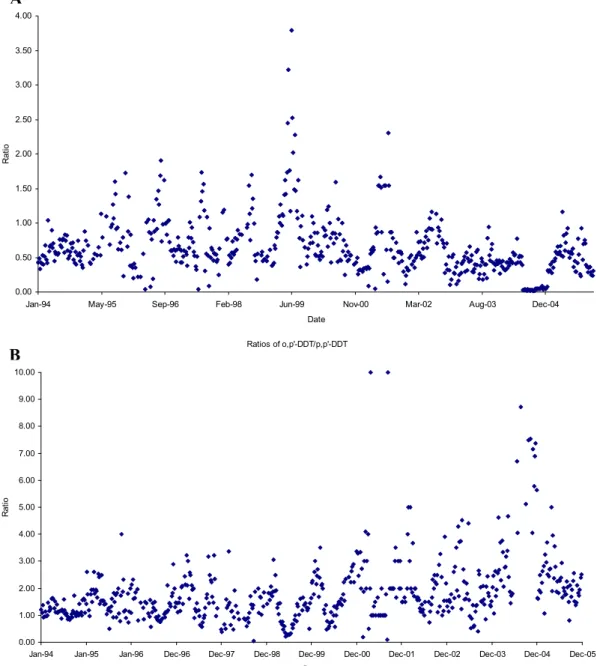
The time series of DDT/DDE+DDD ando, p′-DDT/p, p′ -DDT ratios are presented in Fig. 4 and provide a useful insight into the seasonal composition of the DDTs. The sum degradation products from DDT (i.e.o, p′−andp, p′ -isomers of DDE and DDD, compared to both -isomers of DDT) were included here, as use ofp, p′-DDT/p, p′-DDE ratios alone may be misleading due to the degradation of p, p′-Cl-DDT (contained in dicofol) to p, p′-DDE (Qiu et al., 2005). Figure 4 illustratesp, p′-DDT dominating during the Arctic summer andp, p′-DDE dominating during win-ter, a pattern that was also observed by Bailey et al. (2000) and Berg et al. (2004), who both attributed the higher win-ter values ofp, p′-DDE to long range transport from Asia.
Another reason for the winter increase in p, p−DDE (the metabolite ofp, p′-DDT) could be due to transport with par-ticles (aeolian dusts), coinciding with elevated aerosol levels during the Arctic Haze period (Halsall et al., 1998; Hung et al., 2002). Furthermore, Su et al. (2006) have recognised that DDTs could be more susceptible to precipitation scavenging during the warmer arctic summer.
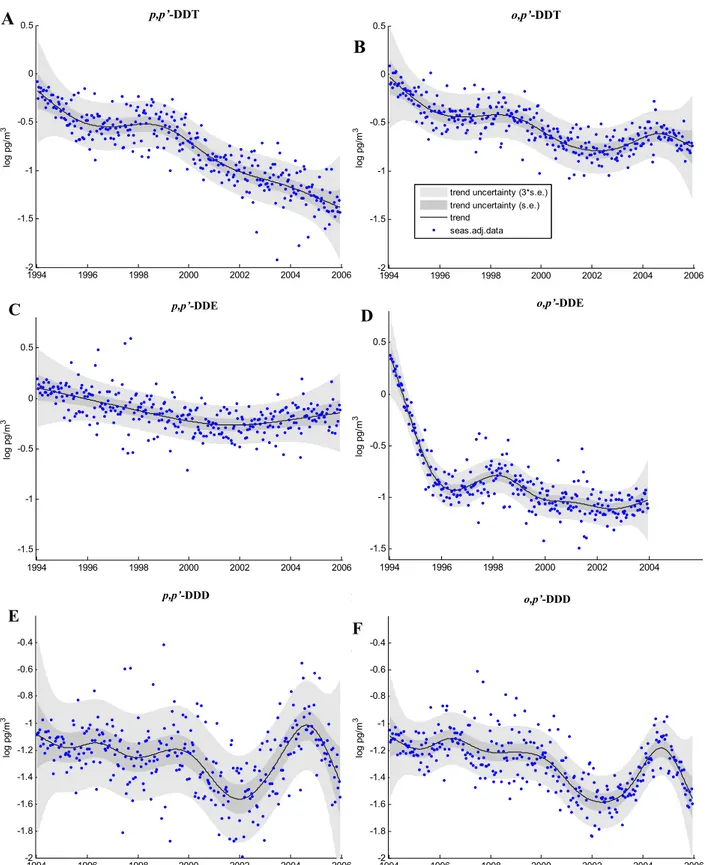
Figure 5 presents the trends identified by DHR for the major DDT compounds. A declining trend was only appar-ent for p, p′-DDT across the time series. Although a sig-nificant decrease in concentrations is evident at the begin-ning of the time series foro, p′-DDE, this is thought to be due to the high values recorded in 1994 (∼7 times greater
than those in previous (Oehme et al., 1996) and subsequent years, Table 1), rather than a significant decline at this time. It is difficult to explain these high values which may arise due to a variety of factors, including: episodes associated with boreal forest fires (discussed earlier); other phenom-ena such as a pronounced Arctic Haze season; or the fresh use of technical DDT/dicofol and subsequent LRT. The only DDT isomer, which shows any consistent decline throughout the time series, isp, p′-DDT (Fig. 5). These results are in agreement with other studies investigating DDTs, withp, p′ -DDE showing the lowest variation in concentrations across the time series. This would support the theory thatp, p′ -Cl-DDT, present in dicofol, may also be a source ofp, p′-DDE
and helping to maintain levels in the atmosphere.
Dicofol is produced and used in southern Europe, India, China, Israel and Brazil. Spain produces ∼1500 t per year (processing is conducted in Italy), and use was reported to be 100–150 t in 2000 (van de Plassche et al. 2003). The amount of DDT related compounds present in dicofol is heavily regulated in most countries, with a maximum of 0.1 % DDT impurity permitted. However, a content of 3.5 % DDTs has been reported in dicofol produced in India (van de Plassche et al., 2003). China has been a major producer of technical DDT and dicofol, with>85 % of the global tech-nical DDT production occurring here, which amounted to
001
!
!
! " #
)DDT
A
B
2 = 0.90
! " # !
001
!
!
! " #
)DDT
B
= 0.90
003
!
!
! " #
)DDE
= 0.90
C
D
003
!
! " #
!
)DDE
= 0.92
D
000
!
! " # !
= 0.78
)DDD
E
F
000
!
! " # !
= 0.83
)DDD
F
001 0034000
( # , ) * (" . / +" 0
0
A
B
5 6 7 001 6 7 001
( ( ( 0 0 0 0 0 0 0 0 0 0
0
B
Fig. 4. Ratios of DDT/DDE+DDD (A) to illustrate the age of the DDT signal, ando, p′-DDT/p, p′-DDT (B) to indicate whether sources are from Dicofol or Technical-DDT.
dicofol (Qiu et al., 2005). This quantity of impurity is much greater than any reported by other countries producing this chemical (India, Brazil, Spain and Israel), although informa-tion is not always readily available (van de Plassche et al. 2003). The predominant DDT impurity found in dicofol is o, p′-DDT (114±45 g kg−1 dicofol), followed by p, p′ -Cl-DDT (69±40 g kg−1dicofol). A recent study conducted in the Central Himalayas, China, found that DDT was present in ice cores for the period 1990–2005, whereas DDE was not found (Wang et al., 2008). The authors conclude that there has been on-going use of Technical DDT in India after the
ban was put in place. It could, however, also be from acci-dental release during the production of dicofol.
001
!
'
" # $ % & " # $ &
A
DDT 001!
'
" # $ % & " # $ &
)DDT
B
" # $ % & " # $ &
'
003
!
'
" # $ % & " # $ &
)DDE
C
003!
" # $ % & " # $ &
'
)DDE
D
000
!
" # $ % " # $
' DDD
E
000!
" # $ % & " # $ &
' DDD
F
829
!
" # $ % & " # $ &
'
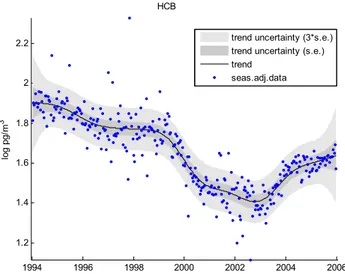
Fig. 6. Seasonally adjusted data and underlying trend for HCB.
those measured at Alert, although several spurious values (>500 pg m−3) were measured at Zeppelin during October 1997. A passive sampling campaign carried out from August 2000 to August 2001 at Zeppelin by Shen et al. (2005) re-ported a concentration of 71 pg m−3, which is akin to the an-nual averages at Zeppelin for these years. HCB is relatively volatile compared to the other OC pesticides examined in this study and breakthrough of this chemical through the sam-pling media is a significant problem, which may lead to an underestimation of the true atmospheric concentration, par-ticularly during the warmer summer months (e.g. Halsall et al., 1998). Breakthrough of HCB in the sampling media av-eraged 27 % of all air samples taken at Alert (Hung et al., 2005), with a similar range of 20–30 % reported at Zeppelin (Oehme et al., 1995). Meaningful seasonal patterns could not be distinguished by DHR and therefore, only the longer term trend is discussed here.
An investigation into long-term trends at Zeppelin re-vealed a 47 % reduction over the period from 1994–2002 (Berg et al., 2004). This is in close agreement with the re-duction seen in this study over the same time period, (46 % reduction in arithmetic annual means, 1994–2002). Figure 6 displays the underlying trend for HCB at Zeppelin using DHR. Interestingly, after an initial decrease, there is an ap-parent upturn in concentrations for the last three years of the time-series (2003–2005). At present it is unclear why this change in pattern occurs. Re-volatilisation or re-cycling of HCB between environmental compartments would result in a slowing of any decline (like the other OCs) following use-reduction of this chemical, but is unlikely to cause an in-crease in air concentrations. Although no information on po-tential sources from developing countries has been available, recent investigations into these compounds have found re-volatilisation from previously contaminated soils and vege-tation to be a significant influence on atmospheric
concentra-tions (Bailey, 2001; Barber et al., 2005). However, it is possi-ble that the trend observed here simply reflects a ‘bottoming-out’ of the year-on-year decrease observed throughout the 1990s and early 2000s, although a continuation of the time-series will be needed to confirm this. Unlike the isomers of hexachlorocyclohexane (HCH) reported by Becker et al. (2008) from the same database, there was no relationship observed between HCB concentrations and either the +ve or
−ve phases of the North Atlantic or Arctic Oscillations. HCB has been shown to be undergoing net deposition to the Arc-tic Ocean for the period 2000–2003 (Su et al., 2006). Since surface ocean water surrounding Svalbard is largely ice-free for most of the year, then the “upturn” in the atmospheric trend evident in the last few years of the Zeppelin dataset, may simply reflect equilibrium between air and marine sur-faces. The recent increase in ice-free months in the ocean surrounding Svalbard due to changes in climate (Kallenborn et al., 2007), could affect the environmental cycling of chem-icals such as HCB, and a further decline in air concentrations may only be realised by many more years of sampling. Since a switch from net deposition to net volatilisation alone may not explain the increase in HCB concentrations, it is plau-sible that the presence of HCB in currently used pesticides as an impurity is also having an impact. The fungicides, chlorothalonil and quintozene, and the arachnicide, tetradi-fon, have been shown to contain HCB as impurities (Gouin et al., 2008). In the UK, for example, the use of tetradifon has declined over the last decade, whereas chlorothalonil on the other hand, has been applied much more widely over the 2004–2006 period. According to the pesticide usage statis-tics database (http://pusstats.csl.gov.uk/), the total mass ap-plied of chlorothalonil (in Great Britain) was estimated to be
∼500 t in 2003, compared to∼1500 t in 2006, a 3-fold in-crease. If similar increases in use are apparent in other Euro-pean countries, then this could provide a significant source of “new” HCB to the environment. The quantity of HCB contained within chlorothalonil ranges from 0.1–0.3 g kg−1 (EPA, 2008). Furthermore, Gouin et al. (2008) found that levels of HCB in air measured in a central valley in Costa Rica were from the historical use of HCB and the ongoing use of fungicides such as chlorothalonil which is applied in banana plantations (Chaves et al., 2007).
4 Conclusions
Technical DDT, may also be hindering the decline of some of the DDTs particularlyp, p′-DDE, although further evidence
is needed to support this. The trends observed for chlordane isomers imply that sources affecting the Arctic are now sec-ondary in nature. On the other hand, the initial decline in HCB concentrations over the 1990s and early 2000s is off-set by an increasing trend from 2003 onwards. The increased use of chlorothalonil and continued use of other pesticides containing HCB as an impurity, combined with environmen-tal factors that affect secondary “reservoirs”, such as the re-duction in sea-ice cover, could be influencing contemporary levels of this chemical in the Arctic atmosphere.
DHR, in combination with these datasets, is proving to be a highly valuable tool for identifying long-term trends in con-taminant data in the remote Arctic atmosphere.
Acknowledgements. SB was funded under NERC studentship NER/S/A/2004/12159. The authors would like to thank Hayley Hung of Environment Canada and Peter Coleman of NETCEN, UK for useful discussions.
Edited by: J. W. Bottenheim and T. Bond
References
AMAP, Arctic Monitoring and Assessment Programme: Arctic Pol-lution 2002: Persistent Organic Pollutants, Heavy Metals, Ra-dioactivity, Human Health, Changing Pathways, AMAP, Oslo, Norway, 2002.
Bailey, R., Barrie, L. A., Halsall, C. J., Fellin, P., and Muir, D. C. G.L Atmospheric organochlorine pesticides in the western Cana-dian Arctic: Evidence of transpacific transport, J. Geophys. Res., 105, 11805–11811, 2000.
Bailey, R. E.: Global hexachlorobenzene emissions, Chemosphere, 43, 167–182, 2001.
Barber, J. L., Sweetman, A. J., van Wijk, D., and Jones, K. C.: Hexachlorobenzene in the global environment: Emissions, lev-els, distribution, trends and processes, Sci. Total Environ., 349, 1–44, 2005.
Becker, S., Halsall, C. J., Tych, W., Hung, H., Attewell, S., Blan-chard P., Li, H., Fellin, P., Stern, G., Billeck, B., and Friesen, S.: Resolving the long-term trends of polycyclic aromatic hydrocar-bons in the Canadian Arctic Atmosphere, Environ. Sci. Technol., 40, 3217–3222, 2006.
Becker, S., Halsall, C. J., Tych, W., Kallenborn, R., Su, Y., and Hung, H.: Long-term trends in atmospheric concentrations of α-andγ-HCH in the Arctic provide insight into the effects of leg-islation and climatic fluctuations on contaminant levels, Atmos. Environ., 42, 8225–8233, 2008.
Berg, T., Kallenborn, R., and Stein, M.: Temporal trends in atmo-spheric heavy metal and organochlorine concentrations at Zep-pelin, Svalbard. Arctic, Antarct. Alp. Res., 36, 284–291, 2004. Bidleman, T. F., Widekvist, U., Jansson, B., and S¨oderlund, R.:
Organochlorine pesticides and PCBs in the atmosphere of South-ern Sweden, Atmos. Environ. 21, 641–654, 1987.
Bidleman, T. F., Jantunen, L. M. M., Helm, P. A., Brorstr¨om-Lunden, E., and Juntto, S.: Chlordane Enantiomers and Temporal
Trends of Chlordane Isomers in Arctic Air, Environ. Sci. Tech-nol., 36, 539–544, 2002.
Bidleman, T. F., Wong, F., Backe, C., S¨odergren, A., Brorstr¨om-Lund´en, E., Helm, P. A., and Stern, G. A.: Chiral signatures of chlordanes indicate changing sources to the atmosphere over the past 30 years. Atmos. Environ., 38, 5963–5970, 2004.
Bidleman, T. F. and Leone, A. D.: Soil-air exchange of organochlo-rine pesticides in the Southern United States, Environ. Pollut., 128, 49–57, 2004.
Chaves, A., Shea, D., and Cope, W. G.: Environmental fate of chlorothalonil in a Costa Rican banana plantation, Chemosphere, 69, 1166–1174, 2007.
Connor, M. S., Davis, J. A., Leatherbarrow, J., Greenfield, B. K., Gunther, A., Hardin, D., Murnley, T., Oram, J. J., and Werme, C.: The slow recovery of San Francisco Bay from the legacy of organochlorine pesticides, Environ. Res., 105, 87–100, 2006. Dougherty, C. P., Holtz, S. H., Reinert, J. C., Panyacosit, L.,
Axel-rad, D. A. and Woodruff, T. J.: Dietary exposures to food con-taminants across the United States. Environmental Research A 84, 170–185, 2000.
Eckhardt, S., Breivik, K., Manø, S., and Stohl, A.: Record high peaks in PCB concentrations in the Arctic atmosphere due to long-range transport of biomass burning emissions, At-mos. Chem. Phys., 7, 4527–4536, doi:10.5194/acp-7-4527-2007, 2007.
Gouin, T., Wania, F., Ruepert, C., and Castillo, L. E.: Field testing passive air samplers for current use pesticides in a tropical envi-ronment, Environ. Sci. Technol., 42, 6625–6630, 2008. Halsall, C. J., Bailey, R., Stern, G. A., Barrie, L. A., Fellin, P., Muir,
D. G. C., Rosenberg, B., Rovinsky, F. Ya., Kononov, E. Ya., and Pastukhov, B.: Multi-year observations of organohalogen pes-ticides in the Arctic atmosphere, Environ. Pollut., 102, 51–62, 1998.
Hung, H., Halsall, C. J., Blanchard, P., Li, H. H., Fellin, P., Stern, G., and Rosenberg, B.: Temporal trends of organochlorine pesticides in the Canadian Arctic Atmosphere, Environ. Sci. Technol. 36, 862–868, 2002.
Hung, H., Blanchard, P., Halsall, C. J., Bidleman, T. F., Stern, G. A., Fellin, P., Muir, D. G. C., Barrie, L. A., Jantunen, L. M., Helm, P. A., Ma, J., and Konoplev, A.: Temporal and spatial variabilities of atmospheric polychlorinated biphenyls (PCBs), organochlorine (OC) pesticides and polycyclic aromatic hydrocarbons (PAHs) in the Canadian Arctic: Results from a decade of monitoring. Sci. Total Environ., 342, 119–144, 2005.
Jantunen, L. M. M., Bidleman, T. F., Harner, T., and Parkhurst, W. J.: Toxaphene, Chlordane, and other organochlorine pesticides in Alabama air, Environ. Sci. Technol., 34, 5097–5105, 2000. Kallenborn, R., Christensen, G., Evenset, A., Schlabach, M., and
Stohl, A.: Atmospheric transport of persistent organic pollutants (POPs) to Bjørnøya (Bear island), J. Environ. Monitor., 9, 1082– 1091, 2007.
Kawano, M., Inoue, T., Wada, T., Hidaka, H., and Tatsukawa, R.: Bioconcentration and residue patterns of chlordane compounds in marine animals: invertebrates, fish, mammals and seabirds, Environ. Sci. Technol., 22, 792–797, 1988.
Li, J., Zhang, G., Guo, L., Xu, W., Li, W., Lee, C. S. L., Ding, A., and Wang, T.: Organochlorine pesticides in the atmosphere of Guangzhou and Hong Kong: Regional sources and long-range atmospheric transport, Atmos. Environ., 41, 3889–3903, 2007. Oehme, M.: Further evidence for long range air transport of
poly-chlorinated aromatics and pesticides from North America and Eurasia to the Arctic, Ambio, 20, 293–297, 1991.
Oehme, M., Haugen, J.-E., and Schlabach, M.: Ambient air levels of persistent organochlorines in spring 1992 at Spitsbergen and the Norwegian mainland: comparison with 1984 results and quality control measures, Sci. Total Environ., 160–161, 139–152, 1995. Oehme, M., Haugen, J.-E., and Schlabach, M.: Seasonal Changes and Relations between Levels of Organochlorines in Arctic Am-bient Air: First Results of an All-Year-Round Monitoring Pro-gram at Ny- ˚Alesund, Svalbard, Norway, Environ. Sci. Technol. 30, 2294–2304, 1996.
PAN (Pesticide Action Network). Active Ingredient Fact Sheets: Di-cofol. http://www.pan-uk.org/pestnews/Actives/diDi-cofol.htm, last access: April 2012.
Patton, G. W., Walla, M. D., Bidleman, T. F., and Barrie, L. A.: Polycyclic Aromatic and Organochlorine Compounds in the At-mosphere of Northern Ellesmere Island, Canada, J. Geophys. Res., 96, 10867–10877, 1991.
Pesticide Usage Survey (PUS). The Food & Environment Research Agency, UK (formerly the Central Science Laboratory, CSL), http://pusstats.csl.gov.uk, last access: April 2012.
Qiu, X., Zhu, T., Yao, B., Hu, J., and Hu, S.: Contribution of Dicofol to the current DDT pollution in China, Environ. Sci. Technol. 39, 4385–4390, 2005.
Shen, L., Wania, F., Lei, Y. D., Teixeira, C., Muir, D. C. G., and Bidleman, T. F.: Atmospheric Distribution and Long-Range Transport Behaviour of organochlorine pesticides in North America, Environ. Sci. Technol. 39, 409–420, 2005.
Shigenaka, G.: Chlordane in the marine environment of the United States: review and results from the National Status and Trends Programme. Technical Memorandum NOS OMA 55, NOAA, Seattle, WA, USA, 1990.
Su, Y., Hung, H., Blanchard, P., Patton, G. W., Kallenborn, R., Konoplev, A., Fellin, P., Li, H., Geen, C., Stern, G., Rosenberg, B., and Barrie, L. A.: Spatial and seasonal variations of hex-achlorocyclohexanes (HCHs) and Hexachlorobenzene (HCB) in the Arctic Atmosphere, Environ. Sci. Technol. 40, 6601–6607, 2006.
Su, Y., Hung, H., Blanchard, P., Patton, G. W., Kallenborn, R., Konoplev, A., Fellin, P., Li, H., Geen, C., Stern, G., Rosen-berg, G., and Barrie, L. A.: A circumpolar perspective of atmospheric organochlorine pesticides (OCPs): Results from six arctic monitoring stations in 2000–2003. Atmos. Environ., doi:10.1016/j.atmosenv.2008.01.054, 2008.
Tych, W., Pedegral, D. J., Young, P. C. and Davies, J.: An unob-served component model for multi-rate forecasting of telephone call demand: the design of a forecasting support system, Int. J. Forecast., 18, 673–695, 2002.
UNECE Protocol to the 1979 convention on long range transbound-ary air pollution on persistent organic pollutants and executive body decision 1998/2 on information to be submitted and the procedure for adding substances to annex I, II or III to the pro-tocol on persistent organic pollutants, ECE/EB.AIR/60, United Nations, New York and Geneva, 1998.
US EPA: Office for Prevention, Pesticides & Toxic Sub-stances (OPPTS), Re-registration Eligibility Decision (RED): Chlorothalonil, http://www.epa.gov/oppsrrd1/REDs/0097red. pdf, last accessed: April 2012.
Van de Plassche, E. J., Schwegler, M., Rasenberg, M., and Schouten, G.: DDT in Dicofol, UN-ECE report, http://www.unece.org/fileadmin/DAM/env/lrtap/TaskForce/ popsxg/2000-2003/ddt in dicofol.pdf, Accessed: April 2012, 2003.
Van Oostdam, J., Donaldson, S. G., Feeley, M., Arnold, D., Ayotte, P., Bondy, G., Chan, L., Dewailly, ´E., Furgal, C. M., Kuhnlein, H., Loring, E., Muckle, G., Myles, E., Receveur, O., Tracy, B., Gill, U., and Kalhok, S.: Human health implications of environ-mental contaminants in Arctic Canada: A review. Sci. Total En-viron., 351–352, 165–246, 2005.
Wang, X. P., Xu, B. Q., Kang, S. C., Cong, Z. Y., and Yao, T. D.: The historical residue trends of DDT, Hexachlorocyclohexanes and polycyclic aromatic hydrocarbons in an ice core from Mt. Everest, central Himalayas, China, Atmos. Environ., 42, 6699– 6709, 2008.
Young, P., Pedegral, D. J., and Tych, W.: Dynamic Harmonic Re-gression, J. Forecast., 18, 369–394, 1999.
Young, P. C.: Nonstationary time series analysis and forecasting, Prog. Environ. Sci., 1, 3–48, 1999.
Xu, D., Deng, L., Chai, Z., and Mao, X.: Organohalogenated com-pounds in pine needles from Beijing City, China. Chemosphere, 57, 1343–1353, 2004.
Yang, X., Wang, S., Bian, Y., Chen, F., Yu, G., Gu, C., and Jiang, X.: Dicofol application resulted in high DDTs residue in cotton fields from northern Jiangsu province, China, J. Haz. Mat., 150, 92-98, 2007.