Integrated Analysis of Environment, Cattle
and Human Serological Data: Risks and
Mechanisms of Transmission of Rift Valley
Fever in Madagascar
Marie-Marie Olive1,2
*, Véronique Chevalier1, Vladimir Grosbois1, Annelise Tran1,
Soa-Fy Andriamandimby2, Benoit Durand3, Jean-Pierre Ravalohery2, Seta Andriamamonjy2, Fanjasoa Rakotomanana4, Christophe Rogier5, Jean-Michel Heraud2
1CIRAD, Animal and Integrated Risk Management (AGIRs) Unit, Montpellier, France,2Institut Pasteur de Madagascar, Virology Unit, Antananarivo, Madagascar,3Paris-Est University, ANSES, Laboratory for Animal Health, Epidemiology Unit, Maisons-Alfort, France,4Institut Pasteur de Madagascar, Epidemiology Unit, Antananarivo, Madagascar,5Institut Pasteur de Madagascar, Direction, Antananarivo, Madagascar
Abstract
Background
Rift Valley fever (RVF) is a vector-borne disease affecting ruminants and humans. Mada-gascar was heavily affected by RVF in 2008–2009, with evidence of a large and heteroge-neous spread of the disease. The identification of at-risk environments is essential to optimize the available resources by targeting RVF surveillance in Madagascar. Herein, the objectives of our study were: (i) to identify the environmental factors and areas favorable to RVF transmission to both cattle and human and (ii) to identify human behaviors favoring human infections in Malagasy contexts.
Methodology/Principal Findings
First, we characterized the environments of Malagasy communes using a Multiple Factor Analysis (MFA). Then, we analyzed cattle and human serological data collected at national level using Generalized Linear Mixed Models, with the individual serological status (cattle or human) as the response, and MFA factors, as well as other potential risk factors (cattle den-sity, human behavior) as explanatory variables. Cattle and human seroprevalence rates were positively associated to humid environments (p<0.001). Areas with high cattle density were at risk (p<0.01; OR = 2.6). Furthermore, our analysis showed that frequent contact with raw milk contributed to explain human infection (OR = 1.6). Finally, our study highlighted the eastern-coast, western and north-western parts as high-risk areas for RVF transmission in cattle.
Conclusions/Significance
Our integrated approach analyzing environmental, cattle and human datasets allow us to bring new insight on RVF transmission patterns in Madagascar. The association between a11111
OPEN ACCESS
Citation:Olive M-M, Chevalier V, Grosbois V, Tran A, Andriamandimby S-F, Durand B, et al. (2016) Integrated Analysis of Environment, Cattle and Human Serological Data: Risks and Mechanisms of Transmission of Rift Valley Fever in Madagascar. PLoS Negl Trop Dis 10(7): e0004827. doi:10.1371/ journal.pntd.0004827
Editor:Christopher M. Barker, University of California, Davis, UNITED STATES
Received:January 7, 2016
Accepted:June 16, 2016
Published:July 14, 2016
Copyright:© 2016 Olive et al. This is an open access article distributed under the terms of the
Creative Commons Attribution License, which permits unrestricted use, distribution, and reproduction in any medium, provided the original author and source are credited.
Data Availability Statement:All relevant data are within the paper and its Supporting Information files.
cattle seroprevalence, humid environments and high cattle density suggests that concomi-tant vectorial and direct transmissions are critical to maintain RVF enzootic transmission. Additionally, in the at-risk humid environment of the western, north-western and the east-ern-coast areas, suitable to Culex and Anopheles mosquitoes, vectorial transmission prob-ably occurs in both cattle and human. The relative contribution of vectorial or direct
transmissions could be further assessed by mathematic modelling.
Author Summary
Rift Valley fever virus (RVFV) is a pathogen that causes a vector-borne tropical disease. The disease affects ruminants and humans and severely impacts the health and economy of affected countries. Madagascar was heavily affected by Rift Valley fever (RVF) in 2008–
2009, with evidence of a large and heterogeneous spread of the disease. Our study aims at identifying environmental and human-related risk factors for RVFV transmission. First, we characterized Malagasy environments according to their putative influence on RVFV mosquito density and population dynamics. Then we statistically analyzed cattle and human serological data collected at a national level with the individual serological status as response, and Malagasy environments previously characterized by climatic and landscape variables as well as other potential risk factors as explanatory variables. Our results identi-fied humid environments of the western, north-western and eastern parts of the island as risky areas. The identification of at-risk environments is essential to focus veterinary sur-veillance and control of RVFV.
Introduction
Rift Valley fever virus (RVFV) is an arthropod-borne zoonotic virus belonging to the Bunyavir-idaefamily and affecting ruminants and humans. Infection causes abortion in pregnant rumi-nants and acute deaths in newborns [1,2]. In the majority of human cases, infection is asymptomatic or causes mild symptoms such as fever, headaches and muscle pains [2]. How-ever sHow-evere cases occur, characterized by retinitis, encephalitis, or hemorrhagic forms that may lead to death [2]. Ruminants are infected through vector bites and probably also by direct con-tact with infected tissues or fluids, such as blood or abortion products [2,3]. Humans are mainly infected through direct contact with infectious tissues or fluids of ruminants but vecto-rial transmission has been suspected in Central African Republic (RCA) and Gabon [4,5]. Virus circulation has been reported in several eco-climatic areas: arid in Western Africa and Arabic Peninsula [1,6], sub-humid in Eastern Africa [7,8], wet forests in central Africa [5], dam and irrigated agricultural land under hot climatic conditions in Egypt, Mauritania and Sudan [9–11] and recently humid highlands in Madagascar [3,12]. The respective roles of direct and vectorial transmissions remain unevaluated in both human and cattle and probably vary among these eco-climatic areas.
Madagascar experienced two major Rift Valley fever (RVF) outbreaks: 1990–91 in the east-ern-coast and central highlands and 2008–09 in the south, the north and the highlands [13–
15]. The last outbreaks occurred in two epidemic waves during the two successive rainy seasons of 2007–08 and 2008–09. Following the first wave, passive surveillance and emergency
response were developed. Sentinel surveillance in herds were set up with field veterinarians [16]. This sentinel surveillance allowed the early detection of the second wave of outbreak in
is based upon work supported by the U. S. Department of Homeland Security under the Center of Excellence of Emerging and Zoonotic Animal Diseases Grant Award Number 2010-ST061-AG0001. Cattle study was supported in part by funds raised by World Health Organization (WHO) and the Food and Agriculture Organization of the United Nations (FAO) through the Central Emergency Response Fund of the United Nations. The views and conclusions contained in this paper are those of the authors and should not be interpreted as necessarily representing the official policies, either explicit or implicit, of the U. S. Department of Homeland Security. The funders had no role in study design, data collection and analysis, decision to publish, or preparation of the manuscript.
cattle at the end of 2008 and thus the implementation of local control measures to prevent the spreading of RVF outside the region [15,16]. At the end of the epidemic, about 700 suspected human cases were recorded from which 26 were fatal. About 400 human and cattle samples were received for laboratory analyses and RVF infection was confirmed or considered as proba-ble in 86 human and 46 ruminant samples [15]. Following the 2008–09 epidemics, studies showed a wide and heterogeneous spread of RVFV infection both in human and cattle [15,17] suggesting that some areas were more favorable than others to transmission [17]. Madagascar has a large variety of eco-climatic patterns, including semi-arid in the south, tropical in the west and on the eastern-coast, and temperate in the central highlands [18]. Apart from the highlands [3,12,19], RVF epidemiology is poorly understood in this country [15,17]. Since 2007, a human syndromic-based surveillance system has been developed which has allowed the detection of the first case of RVF in humans in 2008 [15]. Besides, retrospective investiga-tions suggested that RVFV circulated among livestock since December 2007 [15], revealing a dearth in veterinary surveillance. The main difficulty to implement veterinary surveillance in Madagascar is the lack of basic means to collect and communicate veterinary information [20]. Thus, the identification of at-risk environments is essential to optimize the available resources by targeting RVF surveillance. In addition, there is a need to provide insight into the role of the two transmission routes and better adapt available control measures.
Herein, the objectives of our study were: (i) to identify the environmental factors and areas favorable to RVFV transmission to both cattle and human and (ii) to identify human behaviors favoring human infections in Malagasy contexts.
Materials and Methods
To achieve these goals, we characterized the environments of Malagasy communes using a Multiple Factor Analysis (MFA). Then we analyzed cattle and human serological data using a Generalized Linear Mixed Models (GLMMs), with the individual serological status (cattle or human) as the response, and MFA factors, as well as potential other risk factors (covariates), as explanatory variables.
Cattle and human datasets
The cattle dataset contained results of a national cross-sectional serological survey performed in August 2008 on 3,450 ruminants [17]. Only cattle with known breeding location were included in the study (n = 1,432;Fig 1; [17]). The human dataset contained data from a national cross-sectional serological survey conducted from November 2011 to April 2012 and from October 2012 to May 2013 in 56 sites (cities or villages). Six percent of these sera were used in a previous study [21]. In each of these sites, 30 adults were randomly chosen and sam-pled on a voluntary basis (Fig 1). Potential contacts with ruminants or fresh ruminant fluids (secretion, blood, milk) and socio-professional categories—butcher, farmer, health worker, worker in contact with environment (water, forest) and others (teacher, student, administrative worker, retired)—were documented through a dedicated questionnaire.
Ethics statement
Covariates
The following covariates were selected according to their putative influence on mosquito den-sity and population dynamics or on the risk of contact with ruminants:
• Cattle density. This variable has previously been identified as a risk factor for RVF transmis-sion [7,24].
• Surface covered by water bodies and landscape classes (such as forest, shrub, and agricultural areas). Density and population dynamics of vectors are influenced by environmental factors such as climate, the presence of water bodies and other landscape features [1,25]. The pres-ence of temporary water bodies and floodplains are known as risk factors for RVF in semi-arid areas in eastern Africa, the Arabian Peninsula and Western Africa [1]. Artificial water bodies such as dam and irrigated rice fields are also known to be associated with high abun-dance of RVFV vectors in western Africa [1]. Furthermore, RVFV transmission occurred in forested or shrubby areas [5,8,26,27]. A recent study details the mosquito species and their habitat in Madagascar [28]. Briefly, RVF potential mosquito vectors belong to the genera
Aedes,Anopheles,Culex,EretmapoditesandMansonia[28]. The breeding areas of theAedes
genus are mostly associated with temporary water bodies such as flooded area, temporary pond, puddles, rice field [28].CulexandAnophelesmosquitoes breeding areas are diversified and could be temporary (rice field, swamps) or permanent (lakes, pond). Stagnant and per-manent water bodies are the habitat ofEretmapoditesandMansoniarespectively [28].
• Rainfall, Normalized Difference Vegetation Index (NDVI) and temperatures. The risk of RVFV infection in Eastern and Southern Africa has been shown to vary as a function of rain-fall, NDVI and temperatures [29,30].
• Human related factors: habitat, gender, profession, contact with ruminant and ruminant products [31].
Values of covariates were computed at the commune level (except for human behaviors which were at the individual level).
Fig 1. Cattle and human sampling sites [17].Animal and human sera were analyzed using commercial ELISA kits (Biological Diagnostic Supplies Ltd., BDSL) to detect anti-RVFV immunoglobulin (Ig) G [17,22,23]. Cattle and human data were aggregated at the commune level (n = 1,578).
Cattle density. For each of the 1,578 communes considered, cattle density was estimated using the new global distribution maps for cattle produced by the Food and Agriculture Orga-nization of the United Nations (FAO;http://www.fao.org/Ag/againfo/resources/en/glw/GLW_ dens.html; [32]).
Water bodies and landscape classes. A landscape map of Madagascar was obtained from Globcover project [33]. The GlobCover 2009 landscape product is a 300-m global landscape map produced from an automated classification of Medium Resolution Imaging Spectrometer (MERIS) time series. The global landscape map included 22 landscape classes defined with the United Nations (UN) Land Cover Classification System (LCCS). Among these 22 classes, we iden-tified 5 relevant LCCS categories:“Cultivated Terrestrial Areas and Managed Lands”(so-called Crops),“Woody/ Trees”,“Shrubs”,“Herbaceous”,“Artificial Surfaces (so-called Urbanization)”. To reflect the availability of potential breeding habitats of RVF vectors in Madagascar such as arti-ficial, irrigated, permanent and temporary water bodies, we needed to combine different data sources extracted from several GIS databases. The first one described inland permanent water point, such as lake, and was available from DIVA-GIS (http://www.diva-gis.org/). Marshland data representing temporary water bodies were obtained from Geographical Information Systems at the Royal Botanic Gardens, Kew [34]. Wetland locations representing temporary water bodies were extracted from the International Panel on Climate Change (IPCC; [35]). Irrigated area loca-tions came from Global Map of Irrigation Areas (GMIA) from AQUASTAT-FAO [36].
Climatic variables: Precipitation, temperatures and NDVI. To depict the climatic condi-tions at each commune of Madagascar, day and night Land Surface Temperature (LST) and NDVI were retrieved from Moderate Resolution Imaging Spectroradiometer (MODIS;http:// iridl.ldeo.columbia.edu/). For the period 2001 to 2010, day and night LST were extracted from MODIS data produced every 8 days at 1 km spatial resolution (MODIS MOD11A2 product: Land Surface Temperature and Emissivity). For the same period, NDVI data were obtained from MODIS data produced every 16 days at 250 m spatial resolution (MODIS MOD13A1: Vegetation Indices). Rainfall data were retrieved from the Tropical Rainfall Measuring Mission (TRMM;http://pmm.nasa.gov/trmm/mission-end). These data were produced at 25 km spatial resolution. Finally, for each commune and the same period, we computed the annual mean of day and night LST, NDVI and precipitation. Seasonality of NDVI and precipitation was also considered by computing the difference between the cumulated value over 3 months of the rainy season (November, December and January) and the cumulated value over 3 months of the dry season (June, July and August).
Human related factors. Human density was computed for each commune using data gener-ated from Landscan 2007 Global Population Grid from Oak Ridge National Laboratory & the US Department of Defense (OCHA, 2007). Based on our field knowledge, the communes with more than 5,000 persons per square kilometer were considered as“urban”. Other communes were clas-sified as“rural”. Human behaviors were documented through a dedicated questionnaire.
For each of the 1,578 communes considered, the percentage of surface covered by each land-scape class (vegetation and water bodies), as well as the values of climatic, NDVI and cattle density covariates were computed with the Quantum GIS software [37]. Malagasy commune administrative boundaries and data come from the layers data merged by the Office for the Coordination of Humanitarian Affairs (OCHA) and based on data obtained from the Malagasy National Disaster Management Office in 2011.
Multiple Factor Analysis
factor analysis inside each variable category and then between categories, MFA produces a quantitative summary of the initial set of variables taking the form of a set of linear combina-tion of variables, referred to as factors [39]. The climatic category included the annual means of day and night LST, the annual mean and seasonality of precipitation. The landscape category included the percentage of the surface of the commune covered by each landscape category and the annual mean and seasonality of NDVI. The value of each factor was computed for each of the 1,578 Malagasy communes. Correlation between MFA factor values and cattle density distribution was assessed using Pearson product-moment correlation coefficient test.
Statistical analysis
As a first step univariate analyses of association between suspected risk factors and cattle or human RVFV serological status were undertaken using Chi square tests for categorical factors and generalized linear models for quantitative factors. Risk factors with significance level
0.20 were then included as explanatory variables in GLMMs, with cattle or human individual serological status as the binomial response. In these models, it was assumed that the relation-ships between serological prevalence and quantitative factors were linear on the logit scale. To account for interdependency of serological status of individuals sampled in the same locality, the smallest administrative unit—the commune for the cattle model and the city/village for human model- were included in the models as a random effect. Multicollinearity among explanatory variables was assessed using Variance Inflation Factors (VIF) and correlation tests. Collinear factors were not included in a same model. The selection of the best models was based on the Akaike Information Criterion (AIC). When needed, a multi-model inference approach was used to estimate model-averaged fixed effects (mafe) and the relative importance (RI) of each explanatory variable [40]. Within the set of models tested, only those with an AIC within 2 units difference from the best model were considered [40].
Internal validity of sets of models was evaluated using the Receiver Operating Characteristic (ROC) curve method [41].
In addition, we calculated the 10-fold cross-validation prediction. Because, it is not possible to perform 10-fold cross-validation on GLMM, this procedure was applied to Generalized Lin-ear Models that were similar to the selected GLMM except that did not include the site of sam-pling as random effect. Firstly, the cattle seroprevalence dataset was split randomly into 10 parts. Then, the model was fitted to 90% of the data and used to predict the serological status of the remaining 10% individuals as validation step. The procedure was performed 10 times, each time with 1 of the 10 parts as validation step. [42].
Finally, parameter estimations derived from the best cattle model were used to predict and map cattle seroprevalence at the commune scale for the whole island.
Data analyses were performed using R software version 3.0.1 [43–49].
Results
Environmental characterization of Malagasy communes
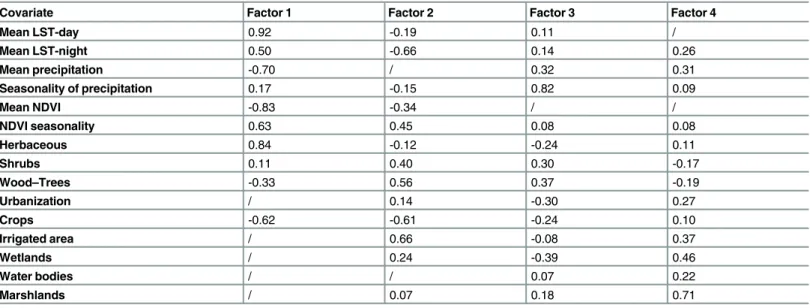
Four MFA factors contributing to 60% of the total variance were selected.Table 1shows the correlation between each quantitative covariate included in the MFA and each of these four factors:
• Factor 1 separated areas based on seasonality in primary productivity (photosynthetic activ-ity measured by NDVI), vegetation, land use and temperature. Large positive values
green). Large negative values described ecosystems with low seasonal primary productivity including crops under wet and less hot climatic conditions (Fig 2Ain brown). The com-munes with the largest positive values for Factor1 are located in the south-western part of Madagascar (Fig 2Ain green) while the communes with the largest negative values for Fac-tor1 are located on the north-eastern part (Fig 2Ain brown);
• Factor 2 separated areas based on seasonality in primary productivity, vegetation, land use and temperature. Large positive values described ecosystems with high seasonal primary
Table 1. Correlation between each quantitative covariate included in the MFA and each factor (Factor 1, Factor 2, Factor 3 and Factor 4).
Covariate Factor 1 Factor 2 Factor 3 Factor 4
Mean LST-day 0.92 -0.19 0.11 /
Mean LST-night 0.50 -0.66 0.14 0.26
Mean precipitation -0.70 / 0.32 0.31
Seasonality of precipitation 0.17 -0.15 0.82 0.09
Mean NDVI -0.83 -0.34 / /
NDVI seasonality 0.63 0.45 0.08 0.08
Herbaceous 0.84 -0.12 -0.24 0.11
Shrubs 0.11 0.40 0.30 -0.17
Wood–Trees -0.33 0.56 0.37 -0.19
Urbanization / 0.14 -0.30 0.27
Crops -0.62 -0.61 -0.24 0.10
Irrigated area / 0.66 -0.08 0.37
Wetlands / 0.24 -0.39 0.46
Water bodies / / 0.07 0.22
Marshlands / 0.07 0.18 0.71
/: The correlation coefficients were not significantly different from zero and so not included in the results doi:10.1371/journal.pntd.0004827.t001
Fig 2. Geographical representation of the MFA factor values and cattle density of the 1,578 Malagasy communes.(A) Factor 1, (B) Factor 2, (C) Factor 3, (D) Factor 4, (E) cattle density categories. For each factor, green colors represent positive values and brown negative values. The darkest colors represent the highest values. Cattle were sampled in communes surrounded in black and human were enrolled in communes surrounded in purple.
productivity including ligneous vegetation and irrigated areas (rice fields) under climatic conditions characterized by low night temperatures (Fig 2Bin green). Large negative values described ecosystems with low seasonal primary productivity including crops under climatic conditions characterized by warm night temperatures (Fig 2Bin brown). The communes with the largest positive values of Factor 2 are located in the central highlands (Fig 2Bin green). The communes with the largest negative values are mostly located in the eastern part of the island (Fig 2Bin brown);
• Factor 3 was a rainfall seasonality index. The highest values of Factors3 (highly seasonal rain-fall) are observed in the north-western part of the island (Fig 2Cin green);
• Factor 4 represented a humid areas (marshlands, wetland and irrigated lands) index. The highest values are mostly located on the eastern-coast and the north-western part of the island (Fig 2Din green).
Considering each of the 1,578 communes of Madagascar, MFA factors values ranged from -1.9 to 3.3 (Factor 1), -1.9 to 2.8 (Factor 2), -5.1 to 2.7 (Factor 3) and -1.1 to 7.3 (Factor 4).
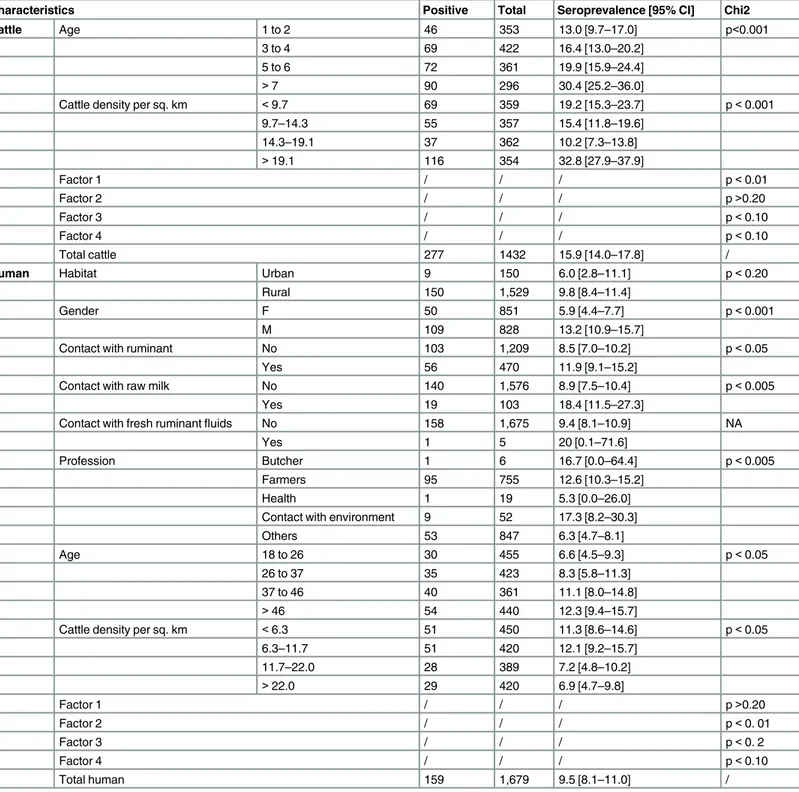
Description of data and univariate statistical analysis (
Table 2
)
A total of 1,432 individuals from the initial cattle dataset, sampled in 26 communes belonging to 22 Malagasy districts were included in the study (Fig 1). The number of animals sampled per commune ranged from 1 to 110. Cattle ages ranged from 1 to 12 years (mean age 4.5 years). The overall seropositivity rate was 19.3% (CI 95% [17.3–21.8]). Age was categorized in 4 groups: 1–2, 3–4, 5–6 and more than 7 years old. Cattle density was classified as follows according to quartiles: below 9.7; 9.7 to 14.3; 14.3 to 19.1 and more than 19.1 per square kilo-meter. MFA factor values of the 26 sampling communes ranged from -1.7 to 2.6 (Factor 1), -0.9 to 1.5 (Factor 2), -1.5 to 2.3 (Factor 3) and -1.1 to 0.6 (Factor 4). Age category, cattle den-sity category, Factor 1, Factor 3 and Factor 4 were statistically associated with cattle seropreva-lence (p0.20). A total of 1,679 people were sampled, 91% (n = 1,529) living in rural areas and 9% (n = 150) living in urban areas (Fig 1). Age of volunteers ranged from 18 to 99 years (mean age 37.6 years) with a ratio of 1.03 (male/female). The overall seropositivity rate was 9.5% (95% CI [8.1–11.0]). Age was categorized in 4 groups: 18 to 26, 26 to 37, 37 to 46 and more than 46 years old. Cattle density of the related communes was classified as following: below 6.3; 6.3 to 11.7; 11.7 to 22.0 and more than 22.0 per square kilometer. A total of 267 individuals declared no contact with live animals or animal product and were categorized as“other profession”. Among them, 24 individuals were seropositive (9.0% 95% CI [5.8–13.1]). MFA factor values of the 48 communes ranged from -1.86 to 3.29 (Factor 1), -1.87 to 2.77 (Factor 2), -5.08 to 1.75 (Factor 3) and -0.75 to 4.51 (Factor 4). Habitat, gender, contact with ruminants, contact with raw milk, profession, age category, cattle density category, Factor 2, Factor 3 and Factor 4 were statistically associated with human seroprevalence (p0.20).
Multivariate analysis
from Factor 1, Factor 2 and Factor 3 in both cattle and human multivariate models. The multi-collinearity test did not detect any correlation between human related factors (VIF<1.5).
For cattle, the single selected model (weight 0.99;S1 Table) included age, cattle density and Factor 4 as explanatory variables (S1 TableandTable 3). Factor 4 and age had a significant pos-itive effect on seroprevalence (estimation of fixed effect at 1.73 and 0.17 respectively; p<0.001 Table 2. Descriptive and univariate analyses for cattle and human seroprevalences.
Characteristics Positive Total Seroprevalence [95% CI] Chi2
Cattle Age 1 to 2 46 353 13.0 [9.7–17.0] p<0.001
3 to 4 69 422 16.4 [13.0–20.2]
5 to 6 72 361 19.9 [15.9–24.4]
>7 90 296 30.4 [25.2–36.0]
Cattle density per sq. km <9.7 69 359 19.2 [15.3–23.7] p<0.001
9.7–14.3 55 357 15.4 [11.8–19.6]
14.3–19.1 37 362 10.2 [7.3–13.8]
>19.1 116 354 32.8 [27.9–37.9]
Factor 1 / / / p<0.01
Factor 2 / / / p>0.20
Factor 3 / / / p<0.10
Factor 4 / / / p<0.10
Total cattle 277 1432 15.9 [14.0–17.8] /
Human Habitat Urban 9 150 6.0 [2.8–11.1] p<0.20
Rural 150 1,529 9.8 [8.4–11.4]
Gender F 50 851 5.9 [4.4–7.7] p<0.001
M 109 828 13.2 [10.9–15.7]
Contact with ruminant No 103 1,209 8.5 [7.0–10.2] p<0.05
Yes 56 470 11.9 [9.1–15.2]
Contact with raw milk No 140 1,576 8.9 [7.5–10.4] p<0.005
Yes 19 103 18.4 [11.5–27.3]
Contact with fresh ruminantfluids No 158 1,675 9.4 [8.1–10.9] NA
Yes 1 5 20 [0.1–71.6]
Profession Butcher 1 6 16.7 [0.0–64.4] p<0.005
Farmers 95 755 12.6 [10.3–15.2]
Health 1 19 5.3 [0.0–26.0]
Contact with environment 9 52 17.3 [8.2–30.3]
Others 53 847 6.3 [4.7–8.1]
Age 18 to 26 30 455 6.6 [4.5–9.3] p<0.05
26 to 37 35 423 8.3 [5.8–11.3]
37 to 46 40 361 11.1 [8.0–14.8]
>46 54 440 12.3 [9.4–15.7]
Cattle density per sq. km <6.3 51 450 11.3 [8.6–14.6] p<0.05
6.3–11.7 51 420 12.1 [9.2–15.7]
11.7–22.0 28 389 7.2 [4.8–10.2]
>22.0 29 420 6.9 [4.7–9.8]
Factor 1 / / / p>0.20
Factor 2 / / / p<0. 01
Factor 3 / / / p<0. 2
Factor 4 / / / p<0.10
Total human 159 1,679 9.5 [8.1–11.0] /
for both explanatory variables;Table 3). Areas with high cattle density (>19.1 per sq. km)
were at risk (p<0.01; OR = 2.6 95% CI [1.3–5.4];Table 3). According to AIC, seven models
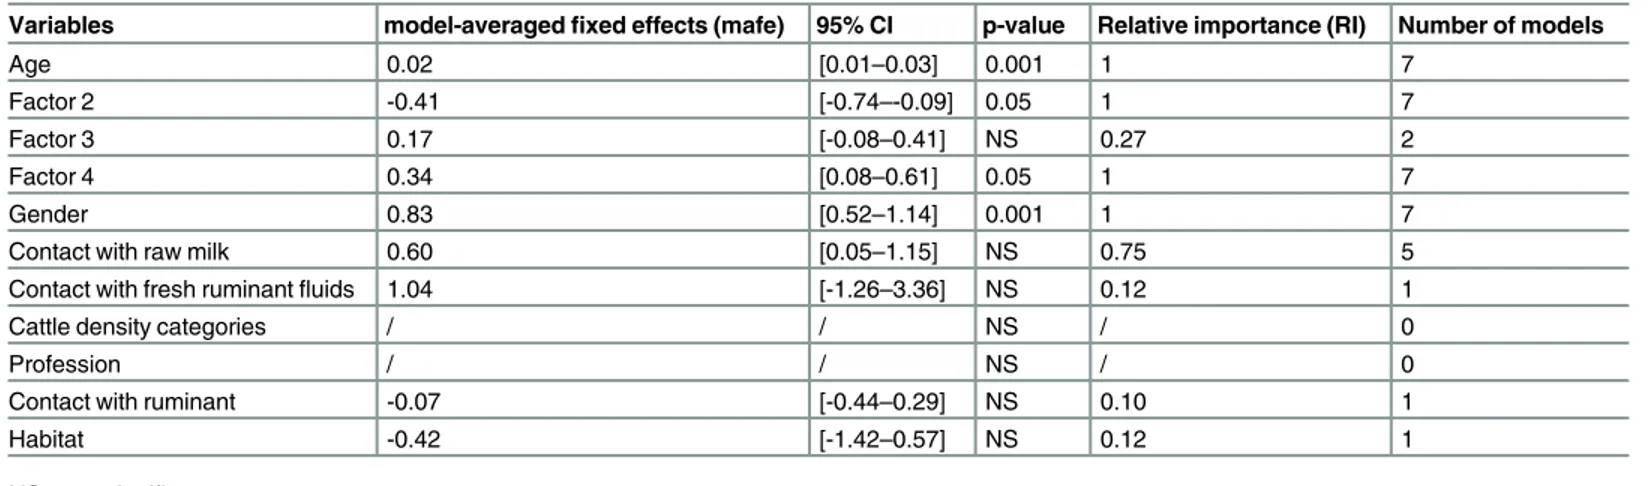
were considered as suitable for describing seroprevalence in humans and thus were analyzed using a multi-model inference approach (S1 Table). These models included age, Factor 2, Fac-tor 3, FacFac-tor 4, gender, habitat, contact with raw milk, contact with fresh ruminant product, with live ruminant as explanatory variables (S1 TableandTable 4). Age, gender (male; OR = 2.3 95% CI [1.6–3.3]) and Factor 4 had a significant positive effect on seroprevalence (p<0.001, p<0.05 and p<0.05 respectively;Table 4). Factor 2 had a significant negative effect
on seroprevalence (p<0.05) whereas Factor 3 had a minor importance in this set of models
(RI = 0.27;Table 4). Contact with raw milk had a moderate effect on individual seroprevalence (OR = 1.6 95% CI [1.0–3.5]) whereas direct contacts ruminants and/or with fresh ruminant flu-ids, and habitat had a low impact on seroprevalence (RI = 0.12 or less;Table 4).
Internal validity of both cattle and human sets of models were satisfactory with an Area Under the Curve (AUC) of 0.82 (95% CI [0. 79–0.84]) and 0.80 (95% CI [0.77–0.84]) for cattle and human models respectively. The 10-fold cross-validation estimated an individual predic-tion error of about 14%.
Cattle seroprevalence was predicted according to Factor 4, cattle density categories and for a fixed cattle age of 5 years. To avoid biased estimations resulting from extrapolations, the pre-diction of seroprevalence was restricted to communes included in the range of the Factor 4 val-ues corresponding to communes where cattle were sampled (i.e [-1.1–0.6]; n = 1,368). The
Table 3. Results from the best cattle model.
Variable Estimate 95% CI p-value
Intercept / -2.34 [-3.02–-1.72] /
Age / 0.17 [0.10–0.23] p<0.001
Cattle density per sq. km <6.3 Reference / /
6.3–11.7 -0.24 [-1.01–0.54] NS
11.7–22.0 -0.66 [-1.61–0.24] NS
>22.0 0.97 [0.30–1.69] p<0.01
Factor 4 / 1.73 [0.96–2.55] p<0.001
NS = not significant
doi:10.1371/journal.pntd.0004827.t003
Table 4. Results from the multi-model inference approach for human dataset analysis.
Variables model-averagedfixed effects (mafe) 95% CI p-value Relative importance (RI) Number of models
Age 0.02 [0.01–0.03] 0.001 1 7
Factor 2 -0.41 [-0.74–-0.09] 0.05 1 7
Factor 3 0.17 [-0.08–0.41] NS 0.27 2
Factor 4 0.34 [0.08–0.61] 0.05 1 7
Gender 0.83 [0.52–1.14] 0.001 1 7
Contact with raw milk 0.60 [0.05–1.15] NS 0.75 5
Contact with fresh ruminantfluids 1.04 [-1.26–3.36] NS 0.12 1
Cattle density categories / / NS / 0
Profession / / NS / 0
Contact with ruminant -0.07 [-0.44–0.29] NS 0.10 1
Habitat -0.42 [-1.42–0.57] NS 0.12 1
NS = not significant
prediction map highlights the western, north-western part and eastern-coast of Madagascar as high-risk areas for RVF transmission (Fig 3). Nineteen percent of the communes affected by outbreaks in ruminants during the 1990–91 and 2008–09 epizootics are located in areas with a predicted seroprevalence higher than 25%. Yet, 24% of the communes affected by these epizo-otics are located in low risk areas (predicted seroprevalence lower than 10%). Observed and predicted seroprevalence at the district level are compared in theS1 Appendix.
Discussion
Following the 2008–09 epidemics, studies showed that RVFV spread widely but heteroge-neously over Madagascar in both cattle and human populations [15,17]. This could be explained by the presence of ecosystems that are more or less suitable to the RVF candidate vector genera in Madagascar, including mosquitoes in theAedes,Anopheles,Culex, Eretmapo-ditesandMansoniagenera [25,28]. Indeed, vector density and population dynamics are influ-enced by environmental factors such as climate and landscape features [1,25]. However, to date, environmental factors linked to the transmission of RVFV have never been investigated
Fig 3. Predicted cattle seroprevalence in Madagascar and areas affected by RVF outbreaks in ruminant during 1990–1991 and 2008-2009.The cattle seroprevalence (SP) was predicted per commune and according to the best cattle model (Factor 4, cattle density and fixed age 5 years old).
in Madagascar. To characterize Malagasy environments, we used MFA methods to generate environmental indicators that combined climatic, NDVI and landscape variables selected according to their putative influence on mosquito vector populations. Our MFA classification is in accordance with the known Malagasy ecosystems [18].
The risk of transmission and respective roles of direct and vectorial transmission are proba-bly different among eco-climatic areas. In the case of direct transmission the force of infection is expected to depend on the number of potentially infectious contacts that a susceptible indi-vidual experiences over a time unit. This contact rate is expected to depend, among others, on cattle density. A positive association between cattle density and IgG seroprevalence rate in tle and/or humans would thus suggest a direct transmission of RVFV. In the case of direct cat-tle to human transmission, the force of infection in the human population is also expected to depend on the frequency of human behaviors resulting in exposure to ruminant fluids or prod-ucts. By contrast, in the case of vectorial transmission, due to the so-called“dilution effect”and for a fixed vector density, increased cattle density would decrease the probability for a suscepti-ble individual to be bitten by an infectious vector over a time unit [50,51]. Therefore, a negative association between cattle density and IgG seroprevalence rates in cattle and/or in humans would rather suggest a vectorial transmission. The force of infection is also expected to increase with vector density. In Madagascar the density of vectors mostly depends on climatic and land-scape factors [1,25,28]. High cattle densities are not systematically associated with high vector densities, as the main RVF vectors breed rather in large water bodies [25] than in artificial con-tainers created from livestock-related activities. Thus, a positive association between cattle and/ or human seroprevalence, local environmental and climatic conditions favorable to mosquitoes is expected under the hypothesis of vectorial transmission.
According to our analysis, cattle seroprevalence increased with age suggesting an enzootic circulation. Cattle seropositivity was positively associated to humid environment (large surface of permanent wetlands, marshlands and irrigated lands) each of these factors being favorable toCulexandAnophelesmosquitoes [25]. Actually, during the 2008–09 epidemics, 3 mosquito species were found to be naturally infected by RVFV:Anopheles coustani,An.squamosusand
Considering that, during the 2008–09 outbreaks, several human cases occurred from the con-tact with infected fresh meat from traded ruminants [15], all the human infections could not be attributed to local infection [15]. Moreover, the detection of human cases depends on the intensity of the local circulation between ruminants and vectors, the probability of human exposure, the presence of clinical signs and the declaration to health services. Then, the human case data were probably not an optimum indicator of spatial distribution of RVF cases as sug-gested by Anyamba et al. [29]. Our prediction map is based on cattle for which the infection could be attributed to a local infection and identifies larger at-risk areas on western part of Madagascar than Anyamba et al. [29]. The discrepancy between results of Anyamba et al. study [29] and our study may be due the methodological differences: environmental variables included in both models and human clinical cases as model output on one side, bovine serolog-ical results on the other hand.
The estimated overall human seroprevalence was 9.5% (IC95% [8.2–11.0]). This seropreva-lence is higher than adult seroprevaseropreva-lence observed in the island of Mayotte (2011) and Tanza-nia (2007–08) [24,53] but lower than adult seroprevalence in Kenya or Saudi Arabia [54,55]. Additionally, this seroprevalence is higher than the seroprevalence estimated for Madagascar in Gray et al [21]. The difference in the sampling area could explain this difference. Indeed, sera from the study of Gray et al. [21] were mainly sampled in south where RVF seroprevalence in human is low. Because of the different eco-epidemiological contexts and survey settings it is difficult to compare our results with the studies performed in Mayotte, Tanzanian, Kenya and Saudi Arabia [24,53–55]. Human RVF seropositivity increased with age, suggesting an endemic transmission in human populations. As observed in cattle, human seropositivity was positively associated with the presence of temporary and artificial water points. In addition, 24 seropositive individuals declared no contact with ruminant or ruminant products, and the 3 mosquito species considered as potential vectors in Madagascar are zoo-anthropophilic feeders [25,52]: these results strongly suggest the existence of a vectorial transmission from ruminant to humans. Our analysis showed that frequent contact with raw milk contributed to explain human infection as previously suspected in Kenya [31]. Direct contact with fresh blood was not identified as human related risk factor whereas this way is suspected to be the main route of human infection in other studies [31]. In our sample, the number of people in contact with fresh blood was very low resulting in a low statistical power. However, this way of transmission has still to be considered, especially in the areas unfavorable to mosquitoes where direct contact could explain human infections [15].
Our integrated approach analyzing environmental, cattle and human datasets allow us to bring new insight on RVF transmission patterns in Madagascar. The association between cattle seroprevalence, humid environments and high cattle density suggests that concomitant vecto-rial and direct transmissions are critical to maintain RVFV enzootic transmission.
Even if the 2008–09 outbreaks are suspected to be associated with infected domestic animals imported from east Africa [56], our study confirms that enzootic and endemic circulations occur in Madagascar as suggested before [3,12,21].
The identification of at-risk environments is essential to focus veterinary surveillance and control of RVFV. Because of the variety of ecosystems and socio-cultural practices in Madagas-car, it is likely that some areas are more favorable to direct transmission [3,19], while others are more favorable to vectorial transmission or to both transmission pathways. In the at-risk humid environment of the western, north-western and the eastern-coast areas, suitable forCulexand
Supporting Information
S1 Table. Comparison of the values and weight of AIC for the cattle and human models.
(DOCX)
S1 Appendix. Scatterplot of observed versus predicted seroprevalences at the district level.
Seroprevalence has been predicted for each age category in each communes sampled. For each district the sampling has been reconstructed taking into account the communes sampled and the number of animals sampled in each commune. Grey points correspond to districts where less than 5 animals were sampled.
(DOCX)
Acknowledgments
We especially thank the population of Madagascar who participated to the studies. We thank those who facilitated the survey, i.e., heads of fokontany, local administration authorities and health authorities from Ministry of Health. We also thank the Plague Unit at the Institut Pas-teur de Madagascar for data collection and supporting (S. Telfer, C. Rahaingosoamamitiana, F. M. Andriamiarimanana, S. Rahelinirina, M. Rajerison), S. Andrimasinoro for the management of data, B.S. Rahoilijaona H.A. Rakotoarison, H. Raharimampianina and A.M. Rakotohaingo-mahefa for their field supports. We are grateful to the authors of the cattle survey and especially E. Jeanmaire, J.M. Reynes and S. de la Rocque for providing the data of cattle survey. We thank G. Gray from the Division of Infectious Diseases of Duke University for its support. Finally, we thank three anonymous reviewers for their careful reading of our manuscript and their com-ments and suggestions.
Author Contributions
Conceived and designed the experiments: MMO VC VG AT SFA BD FR CR JMH. Performed the experiments: MMO SFA JPR SA FR. Analyzed the data: MMO VC VG AT. Wrote the paper: MMO VC VG AT BD JMH.
References
1. Chevalier V. Relevance of Rift Valley fever to public health in the European Union. Clin Microbiol Infect. 2013 August; 19(8):705‑708. doi:10.1111/1469-0691.12163PMID:23517372
2. Pepin M, Bouloy M, Bird BH, Kemp A, Paweska J. Rift Valley fever virus(Bunyaviridae: Phlebovirus): an update on pathogenesis, molecular epidemiology, vectors, diagnostics and prevention. Vet Res. 2010 December; 41(6):61. doi:10.1051/vetres/2010033PMID:21188836
3. Nicolas G, Durand B, Rakotoarimanana TT, Lacote S, Chevalier V, Marianneau P. A 3-year serological and virological cattle follow-up in Madagascar highlands suggests a non-classical transmission route of Rift Valley fever virus. Am J Trop Med Hyg. 2014 February; 90(2):265‑266. doi:10.4269/ajtmh.13-0538 PMID:24366500
4. Nakounné E, Selekon B, Morvan J. [Microbiological surveillance: viral hemorrhagic fever in Central Afri-can Republic: current serological data in man]. Bull Societe Pathol Exot. 2000 January; 93(5):340‑347.
5. Pourrut X, Nkoghé D, Souris M, Paupy C, Paweska J, Padilla C, et al. Rift Valley fever virus seropreva-lence in human rural populations of Gabon. PLoS Negl Trop Dis. 2010 July 27; 4(7):e763. doi:10.1371/ journal.pntd.0000763PMID:20668541
6. Jupp PG, Kemp A, Grobbelaar A, Lema P, Burt FJ, Alahmed AM, et al. The 2000 epidemic of Rift Valley fever in Saudi Arabia: mosquito vector studies. Med Vet Entomol. 2002 September; 16(3):245‑252. doi: 10.1046/j.1365-2915.2002.00371.xPMID:12243225
8. Sindato C, Karimuribo ED, Pfeiffer DU, Mboera LEG, Kivaria F, Dautu G, et al. Spatial and temporal pat-tern of Rift Valley fever outbreaks in Tanzania; 1930 to 2007. PloS One. 2014 February 25; 9(2): e88897. doi:10.1371/journal.pone.0088897PMID:24586433
9. Meegan JM. The Rift Valley fever epizootic in Egypt 1977–78. 1. Description of the epizzotic and viro-logical studies. Trans R Soc Trop Med Hyg. 1979; 73(6):618‑623. doi:10.1016/0035-9203(79)90004-X
10. Digoutte JP, Peters CJ. General aspects of the 1987 Rift Valley fever epidemic in Mauritania. Res Virol. 1989 February; 140(1):27‑30. doi:10.1016/S0923-2516(89)80081-0PMID:2711042
11. Hassan OA, Ahlm C, Sang R, Evander M. The 2007 Rift Valley fever outbreak in Sudan. PLoS Negl Trop Dis. 2011 September 27; 5(9):e1229. doi:10.1371/journal.pntd.0001229PMID:21980543
12. Chevalier V, Rakotondrafara T, Jourdan M, Heraud JM, Andriamanivo HR, Durand B, et al. An unex-pected recurrent transmission of Rift Valley fever virus in cattle in a temperate and mountainous area of Madagascar. PLoS Negl Trop Dis. 2011 December 20; 5(12):e1423. doi:10.1371/journal.pntd. 0001423PMID:22206026
13. Morvan J, Saluzzo JF, Fontenille D, Rollin PE, Coulanges P. Rift Valley fever on the east coast of Mad-agascar. Res Virol. 1991 December; 142(6):475‑482. doi:10.1016/0923-2516(91)90070-JPMID: 1687082
14. Morvan J, Rollin PE, Laventure S, Rakotoarivony I, Roux J. Rift Valley fever epizootic in the central highlands of Madagascar. Res Virol. 1992 December; 143(6):407‑415. doi:10.1016/S0923-2516(06) 80134-2PMID:1297176
15. Andriamandimby SF, Randrianarivo-Solofoniaina AE, Jeanmaire EM, Ravololomanana L, Razafima-nantsoa LT, Rakotojoelinandrasana T, et al. Rift Valley fever during rainy seasons, Madagascar, 2008 and 2009. Emerg Infect Dis. 2010 June; 16(6):963‑970. doi:10.3201/eid1606.091266PMID:20507747
16. Jeanmaire E, de La Rocque S. Rift Valley fever in Madagascar: an updated map of the distribution of the disease in 2008. Rome: Food and Agriculture Organization of the United Nations. EMPRESS. 2010; 35:23–30. Available:http://www.fao.org/3/a-i1648e/i1648e05.pdf. Accessed 22 March 2016.
17. Jeanmaire EM, Rabenarivahiny R, Biarmann M, Rabibisoa L, Ravaomanana F, Randriamparany T, et al. Prevalence of Rift Valley fever infection in ruminants in Madagascar after the 2008 outbreak. Vec-tor Borne Zoonotic Dis. 2011 April 12; 11(4):395‑402. doi:10.1089/vbz.2009.0249PMID:21395414
18. Cornet A. Essai de cartographie bioclimatiqueàMadagascar. (Notice Explicative; 55). Paris: ORS-TOM. 1974; Available:http://www.documentation.ird.fr/hor/fdi:06946. Accessed 10 October 2015.
19. Nicolas G, Chevalier V, Tantely LM, Fontenille D, Durand B. A spatially explicit metapopulation model and cattle trade analysis suggests key determinants for the recurrent circulation of rift valley Fever virus in a pilot area of Madagascar highlands. PLoS Negl Trop Dis. 2014 December 4; 8(12):e3346. doi:10. 1371/journal.pntd.0003346PMID:25474116
20. Goutard FL, Binot A, Duboz R, Rasamoelina-Andriamanivo H, Pedrono M, Holl D, et al. How to reach the poor? Surveillance in low-income countries, lessons from experiences in Cambodia and Madagas-car. Prev Vet Med. 2015 June 1; 120(1):12‑26. doi:10.1016/j.prevetmed.2015.02.014PMID:25842000
21. Gray GC, Anderson BD, LaBeaud AD, Heraud J-M, Fèvre EM, Andriamandimby SF, et al. Seroepide-miological Study of Interepidemic Rift Valley Fever Virus Infection Among Persons with Intense Rumi-nant Exposure in Madagascar and Kenya. Am J Trop Med Hyg. 2015 December 9; 93(6):1364–1370. doi:10.4269/ajtmh.15-0383PMID:26458775
22. Paweska JT, Burt FJ, Anthony F, Smith SJ, Grobbelaar AA, Croft JE, et al. IgG-sandwich and IgM-cap-ture enzyme-linked immunosorbent assay for the detection of antibody to Rift Valley fever virus in domestic ruminants. J Virol Methods. 2003 November; 113(2):103‑112. doi:10.1016/S0166-0934(03) 00228-3PMID:14553896
23. Paweska JT, Burt FJ, Swanepoel R. Validation of IgG-sandwich and IgM-capture ELISA for the detec-tion of antibody to Rift Valley fever virus in humans. J Virol Methods. 2005 March; 124(1–2):173‑181. doi:10.1016/j.jviromet.2004.11.020PMID:15664066
24. Heinrich N, Saathoff E, Weller N, Clowes P, Kroidl I, Ntinginya E, et al. High seroprevalence of Rift Val-ley fever and evidence for endemic circulation in Mbeya region, Tanzania, in a cross-sectional study. PLoS Negl Trop Dis. 2012 March; 6(3):e1557. doi:10.1371/journal.pntd.0001557PMID:22479657
25. Tantely LM, Boyer S, Fontenille D. A review of mosquitoes associated with Rift Valley fever virus in Madagascar. Am J Trop Med Hyg. 2015 April; 92(4):722‑729. doi:10.4269/ajtmh.14-0421PMID: 25732680
27. Owange NO, Ogara WO, Affognon H, Peter GB, Kasiiti J, Okuthe S, et al. Occurrence of rift valley fever in cattle in Ijara district, Kenya. Prev Vet Med. 2014 November; 117(1):121–8. doi:10.1016/j.
prevetmed.2014.08.008PMID:25217406
28. Tantely ML, Le Goff G, Boyer S, Fontenille D. An updated checklist of mosquito species (Diptera: Culici-dae) from Madagascar. Parasite 2016 April 21; 23:20. doi:10.1051/parasite/2016018PMID:27101839
29. Anyamba A, Linthicum KJ, Small J, Britch SC, Pak E, de La Rocque S, et al. Prediction, assessment of the Rift Valley fever activity in East and Southern Africa 2006–2008 and possible vector control strate-gies. Am J Trop Med Hyg. 2010 August; 83(2 Suppl):43‑51. doi:10.4269/ajtmh.2010.09–0289PMID: 20682905
30. Metras R, Jewell C, Porphyre T, Thompson PN, Pfeiffer DU, Collins LM, et al. Risk factors associated with Rift Valley fever epidemics in South Africa in 2008–11. Sci Rep. 2015 March 25; 5:9492. doi:10. 1038/srep09492PMID:25804974
31. Nicholas DE, Jacobsen KH, Waters NM. Risk factors associated with human Rift Valley fever infection: systematic review and meta-analysis. Trop Med Int Health. 2014 December; 19(12):1420‑1429. doi: 10.1111/tmi.12385PMID:25252137
32. Robinson TP, Wint GRW, Conchedda G, Van Boeckel TP, Ercoli V, Palamara E, et al. Mapping the global distribution of livestock. PloS One. 2014 May 29; 9(5):e96084. doi:10.1371/journal.pone. 0096084PMID:24875496
33. Bontemps S, Defourny P, Van Bogaert E, Arino O, Kalogirou V, Perez JR. GLOBCOVER 2009: Prod-ucts Description and Validation Report. UCLouvain & ESA Team; 2011. Available:http://epic.awi.de/ 31014/16/GLOBCOVER2009_Validation_Report_2-2.pdf. Accessed 10 June 2015.
34. Moat J, Du Puy D. Madagascar, Remaining Primary Vegetation [Internet]. Royal Botanic Gardens, Kew (Eds.), London; 1997. Available:www.kew.org/gis/projects/madagascar/veg_mapping.html. Accessed 14 November 2014.
35. Batjes NH. IPCC default soil classes derived from the Harmonized World Soil Data Base (Ver. 1.1). Carbon Benefits Project (CBP) and ISRIC–World Soil Information; 2010. Available:http://www.isric. org/isric/webdocs/docs/ISRIC_Report_2009_02.pdf. Accessed 12 November 2014.
36. Siebert S, Frenken K. Irrigated areas. In: Atlas of African agriculture research & development; 2014. Available:http://www.fao.org/nr/water/aquastat/irrigationmap/index.stm. Accessed 12 November 2014.
37. QGIS Development Team. QGIS Geographic Information System [Internet]. Open Source Geospatial Foundation; 2009. Available:http://qgis.osgeo.org. Accessed 10 June 2014.
38. Escofier B, Pagès J. Multiple factor analysis (AFMULT package). Comput Stat Data Anal. 1994 August; 18(1):121‑140. doi:10.1016/0167-9473(94)90135-X
39. Costard S, Porphyre V, Messad S, Rakotondrahanta S, Vidon H, Roger F, et al. Multivariate analysis of management and biosecurity practices in smallholder pig farms in Madagascar. Prev Vet Med. 2009 November 15; 92(3):199‑209. doi:10.1016/j.prevetmed.2009.08.010PMID:19781801
40. Grueber CE, Nakagawa S, Laws RJ, Jamieson IG. Multimodel inference in ecology and evolution: chal-lenges and solutions. J Evol Biol. 2011 April; 24(4):699‑711. doi:10.1111/j.1420-9101.2010.02210.x PMID:21272107
41. Park SH, Goo JM, Jo C-H. Receiver operating characteristic (ROC) curve: practical review for radiolo-gists. Korean J Radiol. 2004 March; 5(1):11–18. doi:10.3348/kjr.2004.5.1.11PMID:15064554
42. Franco AO, Davies CR, Mylne A, Dedet J-P, GáLlego M, Ballart C, et al. Predicting the distribution of canine leishmaniasis in western Europe based on environmental variables. Parasitology. 2011 Decem-ber; 138(14):1878–91. doi:10.1017/S003118201100148XPMID:21914251
43. R Development Core Team. R: A Language and Environment for Statistical Computing. Vienna, Aus-tria: the R Foundation for Statistical Computing. 2011.
44. LêS, Josse J, Husson F. FactoMineR: An R Package for Multivariate Analysis. J Stat Softw. 2008 March 18; 25(1):1. doi:10.18637/jss.v025.i01
45. Fox J, Weisberg S. An {R} Companion to Applied Regression. Second. Sage; 2011. Available:http:// socserv.socsci.mcmaster.ca/jfox/Books/Companion. Accessed 10 October 2015.
46. Bates D, Maechler M, Bolker B, Walker S. Fitting Linear Mixed-Effects Models using lme4. Journal of Statistical Software. 2015;51 pages. Available:http://arxiv.org/abs/1406.5823. Accessed 10 October 2015.
47. BartońK. MuMIn: Multi-Model Inference; 2015. Available:https://cran.r-project.org/web/packages/ MuMIn/index.html. Accessed 26 August 2015.
49. Canty A, Ripley B. Package“boot”: Bootstrap Functions. Cran.2016. Available:https://cran.r-project. org/web/packages/boot/boot.pdf. Accessed 24 March 2016.
50. Keeling MJ, Rohani P. Modeling infectious diseases in humans and animals. Princeton: Princeton Uni-versity Press; 2008.
51. Durand B, Zanella G, Biteau-Coroller F, Locatelli C, Baurier F, Simon C, et al. Anatomy of bluetongue virus serotype 8 epizootic wave, France, 2007–2008. Emerg Infect Dis. 2010 December; 16 (12):1861‑1868. doi:10.3201/eid1612.100412PMID:21122214
52. Ratovonjato J, Olive M-M, Tantely LM, Andrianaivolambo L, Tata E, Razainirina J, et al. Detection, iso-lation, and genetic characterization of Rift Valley fever virus from Anopheles (Anopheles) coustani, Anopheles (Anopheles) squamosus, and Culex (Culex) antennatus of the Haute Matsiatra region, Mad-agascar. Vector Borne Zoonotic Dis. 2011 June 16; 11(6):753‑759. doi:10.1089/vbz.2010.0031PMID: 21028960
53. Lernout T, Cardinale E, Jego M, Desprès P, Collet L, Zumbo B, et al. Rift valley fever in humans and
animals in Mayotte, an endemic situation? PloS One. September 2013; 8(9):e74192. doi:10.1371/ journal.pone.0074192PMID:24098637
54. LaBeaud AD, Ochiai Y, Peters CJ, Muchiri EM, King CH. Spectrum of Rift Valley fever virus transmis-sion in Kenya: insights from three distinct regions. Am J Trop Med Hyg. 2007 May; 76(5):795–800. PMID:17488893
55. Memish ZA, Masri MA, Anderson BD, Heil GL, Merrill HR, Khan SU, et al. Elevated Antibodies Against Rift Valley Fever Virus Among Humans with Exposure to Ruminants in Saudi Arabia. Am J Trop Med Hyg. 2015 January4; 92(4):739–43. doi:10.4269/ajtmh.14-0575PMID:25646253
![Fig 1. Cattle and human sampling sites [17]. Animal and human sera were analyzed using commercial ELISA kits (Biological Diagnostic Supplies Ltd., BDSL) to detect anti-RVFV immunoglobulin (Ig) G [17,22,23].](https://thumb-eu.123doks.com/thumbv2/123dok_br/16359100.190111/4.918.314.700.112.397/cattle-sampling-analyzed-commercial-biological-diagnostic-supplies-immunoglobulin.webp)