Mitochondrial Genome Sequences
Nan Song1,2, Ai-Ping Liang1*, Cui-Ping Bu1,3
1Key Laboratory of Zoological Systematics and Evolution, Institute of Zoology, Chinese Academy of Sciences, Chaoyang District, Beijing, China,2Henan Entry-Exit Inspection and Quarantine Bureau, Jinshui District, Zhengzhou, China,3Jiangsu Key Laboratory for Eco-agricultural Biotechnology, Huaiyin Normal University, Huaiyin, China
Abstract
Classically, Hemiptera is comprised of two suborders: Homoptera and Heteroptera. Homoptera includes Cicadomorpha, Fulgoromorpha and Sternorrhyncha. However, according to previous molecular phylogenetic studies based on 18S rDNA, Fulgoromorpha has a closer relationship to Heteroptera than to other hemipterans, leaving Homoptera as paraphyletic. Therefore, the position of Fulgoromorpha is important for studying phylogenetic structure of Hemiptera. We inferred the evolutionary affiliations of twenty-five superfamilies of Hemiptera using mitochondrial protein-coding genes and rRNAs. We sequenced three mitogenomes, from Pyrops candelaria, Lycorma delicatula and Ricania marginalis, representing two additional families in Fulgoromorpha.PyropsandLycormaare representatives of an additional major family Fulgoridae in Fulgoromorpha, whereasRicaniais a second representative of the highly derived clade Ricaniidae. The organization and size of these mitogenomes are similar to those of the sequenced fulgoroid species. Our consensus phylogeny of Hemiptera largely supported the relationships (((Fulgoromorpha,Sternorrhyncha),Cicadomorpha),Heteroptera), and thus supported the classic phylogeny of Hemiptera. Selection of optimal evolutionary models (exclusion and inclusion of two rRNA genes or of third codon positions of protein-coding genes) demonstrated that rapidly evolving and saturated sites should be removed from the analyses.
Citation:Song N, Liang A-P, Bu C-P (2012) A Molecular Phylogeny of Hemiptera Inferred from Mitochondrial Genome Sequences. PLoS ONE 7(11): e48778. doi:10.1371/journal.pone.0048778
Editor:Simon Ho, University of Sydney, Australia
ReceivedMay 15, 2012;AcceptedOctober 1, 2012;PublishedNovember 8, 2012
Copyright:ß2012 Song et al. This is an open-access article distributed under the terms of the Creative Commons Attribution License, which permits unrestricted use, distribution, and reproduction in any medium, provided the original author and source are credited.
Funding:This study was supported by grants from the National Basic Research Program of China (973 Program) grant#2007CB411601, the National Natural Science Foundation of China grants#30530110, 30770269 and 30970400, the Key Laboratory of the Zoological Systematics and Evolution of the Chinese Academy of Sciences grant#O529YX5105, and the National Science Fund for Fostering Talents in Basic Research, Special subjects in animal taxonomy, grant# NSFCJ0630964/J0109, all awarded to APL. The funders had no role in study design, data collection and analysis, decision to publish, or preparation of the manuscript.
Competing Interests:The authors have declared that no competing interests exist.
* E-mail: [email protected]
Introduction
Insect mitochondrial genomes (mitogenomes) are small, double-stranded, circular DNA molecules, ranging in size from approx-imately 14 to 19 kb. The mitogenome encodes thirty-seven genes (13 protein-coding, 22 transfer RNA, and 2 ribosomal RNA genes), and contains a control region (A+T-rich region) that is thought to play a role in the initiation of transcription and replication, and is a source of length variation in the genome [1,2]. Complete or nearly complete mitogenome sequences have been increasingly used for phylogenetic analyses above the family level in insects [3,4]. Mitogenome sequences have able to resolve intraordinal relationships within Coleoptera [5,6,7,8,9], Lepidop-tera [10,11,12], HymenopLepidop-tera [13,14,15,16], OrthopLepidop-tera [17,18], Diptera [19], Neuroptera [20], and Isoptera [21]. Additionally, rearrangements of mitochondrial genes and nucleotide composi-tional biases can provide useful information for understanding the genetic differences between taxa [22].
Hemiptera is one of the largest insect orders, comprising more than 50,000 described species. The extraordinary diversity in terms of morphology and lifestyle adaptions has long attracted the attention of evolutionary biologists and systematists. For example, some hemipteran species display bizarre morphology, some are
brilliantly colored, and some produce cuticular waxes (e.g., the strangely protruding head ofFulgora laternariaand the white wax of Geisha distinctissima) [23].Triatoma dimidiatais the vector of Chagas disease, which is a predominantly chronic disease affecting millions of people [24]. Due to high reproductive potentials, capabilities of dispersal, and transmission of plant viral diseases, some delphacids have caused considerable damage to grain production and are identified as the causes of rice famines in several Asian countries [25].
(Fulgoromorpha,(Sternorrhyncha,Cicadomorpha)) was sister to the clade (Heteroptera,Coleorrhyncha). But recent cladistic analyses using both morphological characters and partial 18S rDNA sequence data indicated that ‘‘Homoptera’’ is not a monophyletic group [27,31,34,35].
The hemipteran infraorder Fulgoromorpha includes more than 9000 described species in ,20 families, and all taxa in
Fulgoromorpha are terraneous and plant-feeding. The monophyly of Fulgoromorpha is well supported by morphological and molecular data [36,37]. However, the taxonomic position of Fulgoromorpha within Hemiptera is still controversial. Previous morphological studies suggested that Fulgoromorpha and Cica-domorpha formed Auchenorrhyncha, and that Auchenorrhyncha is more closely related to Coleorrhyncha and Sternorrhyncha than to Heteroptera [38]. Cobben [39] suggested that both Heteroptera and Fulgoromorpha form the sister clade to (Sternorrhyncha,Ci-cadomorpha) according to a cladistic study of morphological traits. Hamilton [33] examined the phylogenetic affiliations using mouthparts and features of the head and proposed (Fulgoromor-pha,(Sternorrhyncha,Cicadomorpha). Emel’yanov [40] placed the clade (Cicadelloidea+Fulgoroidea) in a sister position to the clade (Cercopoidea+Cicadoidea) and suggested that Fulgoromorpha is closer to Cicadomorpha than to other hemipterans. Although the position of Fulgoromorpha is crucial in determining the phyloge-netic framework for Hemiptera, few mitogenome studies have addressed this. Fragments of the mitochondrial genes encoding 16S rRNA, 12S rRNA,cytb, andcox1of some planthopper species [37,41,42,43,44,45], and mitogenomes from three fulgoroid species [46,47,48] have already been sequenced and utilized for phylogenetic studies. However, these studies usually have neither sufficient genetic information nor broad taxonomic samples.
Here, we describe three new complete mitogenome sequences, which add a major group (Fulgoridae) and a second representative of the highly derived clade Ricaniidae. In addition, we analyzed all 49 available complete or nearly complete mitogenomes from Hemiptera, with the aim of estimating a phylogeny of the order.
Materials and Methods
Ethics Statement
No specific permits were required for the insect specimens collected for this study in China. These specimens were collected on the roadside. The field studies did not involve endangered or protected species. Pyrops candelaria, Lycorma delicatula, and Ricania marginalisare all common fulgoroid species in China and are not included in the ‘‘List of Protected Animals in China’’.
Insects
Adult specimens ofPyrops,Lycorma, andRicaniawere collected in Fujian, Henan, and Zhejiang provinces, China, respectively. They were preserved in 100% ethanol and stored at280uC in the Key Laboratory of Zoological Systematics and Evolution, Institute of Zoology, Chinese Academy of Sciences. Flies were identified by Nan Song with reference to Chou et al. [49].
DNA Extraction, PCR, Cloning, and Sequencing
After an examination of external morphology for identification, the muscle tissue under the pronotum of each specimen was used for DNA extraction. A modified method of salt-extraction protocol [50] was employed to extract DNA.
The whole mitogenome was amplified in overlapping PCR fragments. Initial PCR primers are based on Simon et al. (2006) [51]. Short regions within individual genes were amplified using QIAGEN Taq DNA polymerase (QIAGEN, China) in PCR
reaction under the following conditions: 5 min at 94uC, followed by 30 cycles of 50 s at 94uC, 50 s at 50uC, and 1–3 min at 72uC. The final elongation step was continued for 10 min at 72uC. The sequences obtained from these regions were then used to design specific primers for long PCRs that allowed us to link all of the shorter regions. The large fragments (.2000 bp) were obtained using the QIAGEN Long Taq DNA polymerase (QIAGEN, China) under the following conditions: 2 min at 96uC, followed by 30 cycles of 10 s at 98uC, and 3 min at 68uC. The final elongation was continued for 10 min at 72uC. These PCR products were analyzed by 1.0% agarose gel electrophoresis.
PCR products of ,1200 bp were directly sequenced after
purification. Whereas products of 1.2–3 kb were cloned into pBS-T Easy vector (QIAGEN, China), and the resultant plasmid DNA was isolated using the TIANprp Midi Plasmid Kit Purification System (QIAGEN, China) and sequenced by means of primer walking. DNA sequencing was performed using BigDye termina-tor chemistry and ABI 3730xl Genetic Analyzer (PE Applied Biosystems, USA). After the entire mitogenome for Pyrops had been sequenced, the primers were reused to amplify other species; however, some primers were redesigned for efficient sequencing because of minor sequence differences between species.
Sequence Assembly, Annotation, and Analysis
Raw sequence files were proofread and aligned into contigs in BioEdit 7.0.5.3 [52]. Contig sequences were checked for ambiguous base calls, and only non-ambiguous regions were used for annotation. Sequence alignment, genome assembly, and calculations of nucleotide composition were all conducted with MEGA 5 [53]. The 22 tRNA genes were identified using the SE server [54]. The tRNAs not found by tRNAScan-SE were identified through comparison with the regions coding these tRNAs in other insects. Protein-coding genes and rRNA genes were determined by comparison with those of published insect mitochondrial sequences. Potential secondary structure folds in the A+T-rich region of the genome were predicted using Mfold 3.2 [55]. New mitogenome sequences obtained in this study were deposited in GenBank under accession numbers FJ006724, EU909203, and JN242415 for Pyrops, Lycorma, and Ricania, respectively (Table S1).
Phylogenetic Analyses
We conducted phylogenetic analyses using all of the currently available mitogenomes of Hemiptera along with the three newly sequenced ones (Table S1).Three orthopterans and a psocid served as outgroups. The orthopterans form a basal lineage and the psocid is in a sister clade to Hemiptera.
The nucleotide sequences of 13 protein-coding genes and 2 rRNA genes were used to reconstruct the phylogenetic relation-ships in Hemiptera. All protein-coding genes were aligned at the amino acid level using the default settings in ClustalW (as implemented in MEGA 5). The alignments were back-translated into the corresponding nucleotide sequences. The stop codons of protein-coding genes were excluded when aligned. Two rRNAs were respectively aligned in MEGA 5 as nucleotides. Ambiguously aligned regions of protein-coding genes and rRNA genes were checked by eye. Potential saturation in each protein-coding gene and rRNA was individually assessed, with transitions and transversions plotted against corrected genetic distance using DAMBE 5.1.2 [56]. Both average p-distances and pairwise relative -rates were calculated by PHYLTEST [57].
rRNAs (ALL_123); (2) protein-coding genes excluding third codon positions, plus two rRNAs (ALL_12); (3) all protein-coding genes alone (PCG-123); (4) protein-coding genes excluding third codon positions (PCG_12); and (5) two rRNAs alone (rRNAs).
Phylogenetic trees were estimated from each data set using maximum parsimony (MP), maximum likelihood (ML). and Bayesian inference (BI). MP analyses were performed using PAUP* 4.0b10 [58], with gaps treated as missing data. A total of 1,000 random-addition searches using tree-bisection-reconnec-tion were performed for each MP analysis. Bootstrap support was calculated from 1000 bootstrap replicates with 100 random additions per replicate in PAUP*. Tree statistics were also calculated in PAUP* (Table 1). All four outgroup taxa, partial outgroup (psocid only), or long-branch taxa were respectively removed from MP analyses to search for potential long-branch attraction artifacts.
ML analyses were conducted using the program TreeFinder [59]. For each dataset, the GTR+I+G model was identified as the best-fit one under the Akaike information criterion (AIC) by the ‘‘model proposer’’ in TreeFinder. For the datasets with 3rd codon positions, each codon position was treated as a separate partition. A search-depth level of 2 was selected and bootstrap analysis was performed with 1000 replicates.
Bayesian analyses were conducted with MrBayes 3.2 [60]. Prior to the analyses we tested for the appropriate nucleotide substitution model via AIC with MrModeltest v2.3 [61] for each gene, for each codon and for all concatenated datasets (Table S2). GTR+I+G were estimated as the best-fit substitution model for all partitions. Each analysis comprised four independent Markov chains of 3,20 million generations each, sampling every 100
generations, and the first 25% discarded as burn-in. The datasets ALL_123 and PCG_123 were partitioned first by gene, then by codon position. All model parameters were unlinked across partitions. Markov chain stationarity was considered to be reached when the average standard deviation of split frequencies fell below 0.01 and potential scale reduction factor values approached 1.0 [62].
Results
Genome Features
The complete mtDNA sequences ofPyrops,Lycorma, andRicania were determined to be 16021 bp, 15946 bp, and 15698 bp in size, respectively. The three genome sizes are well within the observed range of insect mitogenomes (14–19 kb) and the length variation occurs in the A+T-rich regions, which range from 1324 to 1642 nucleotides. Like other insect mitogenomes, three fulgoroid mitogenomes contain the typical 13 protein-coding genes (PCGs),
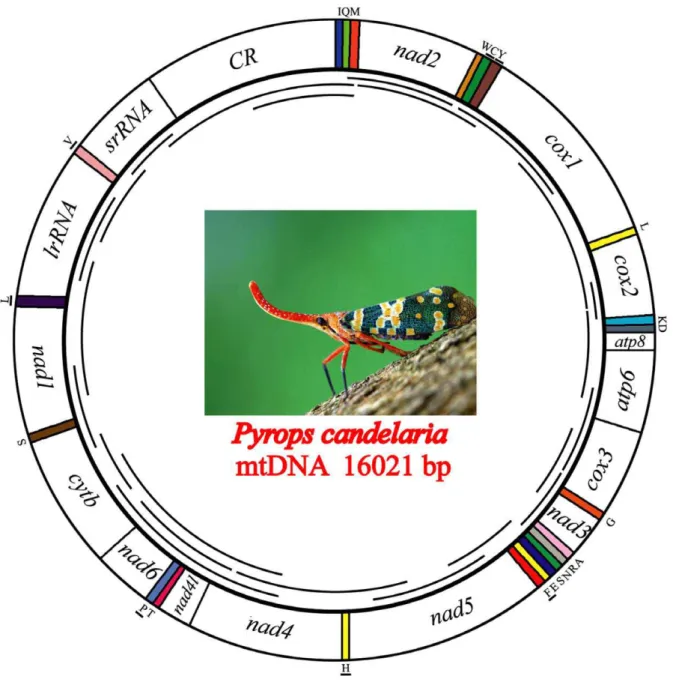
22 tRNAs, two rRNAs, and A+T-rich region (Fig. 1). The position and orientation of the mitochondrial genes are the same as those found in the putative ancestral insect mitogenome [62]. A summary of the mitochondrial genes of Pyrops, Lycorma, and Ricaniais given in Table S3.
The nucleotide composition of all three species is significantly biased towards A and T, at 74.3%, 76.4%, and 76.2% respectively, apportioned as follows: protein-coding genes 72.6%, 74.7%, and 75.0%; rRNA genes 75.6%, 77.5%, and 77.6%; and A+T-rich region 83.8%, 83.7%, and 82.3% (Table 2). The nucleotide guanine (G) is the least used, with the frequencies ranging from 8.5–10.3%. With regard to the protein-coding genes, different codon positions have different nucleotide frequencies. The A+T content at the third codon position is higher than that at the first or second codon position. All of the majority-strand genes favor A and C (A-skew and C-skew are 0.24–0.28 and 0.20–0.28, respectively).
We determined the codon usage of 13 protein-coding genes (Table 3) and found that nine codons (AAT-Asn, TTT-Phe, ATT-Ile, TTA-Leu, AAA-Lys, ATA-Met, TCA-Ser, ACA-Thr, TAT-Tyr) are most frequently used in the three fulgoroids. All of these codons have an A and/or T at the third codon position. This codon bias is also caused by the A+T-rich composition of the mitogenome.
Transfer RNA and Ribosomal RNA Genes
All 22 tRNA coding genes usually found in mitogenome of metazoans are present in these three fulgoroids. The anticodon nucleotides for the corresponding tRNA genes are identical to those of other available hemipteran mitogenomes [46,47,48,63,64]. All tRNA genes have the typical clover-leaf structure with one exception: tRNA-ser(AGN), in which the dihydrouridine arm formed a simple loop as in some other metazoan species, including most insects [1,23,65,66]. The tRNAs are all found to be between 60 bp and 75 bp in length.
The arrangements of both 16S rRNA and 12S rRNA in the fulgoroid mitogenomes are conserved. They are located between tRNA-Leu(CUN) and tRNA-Val and between tRNA-Val and the A+T-rich region, respectively (Fig. 1). The lengths of 16S rRNA and 12S rRNA are determined to be 1214–1216 bp and 717– 736 bp, respectively. These lengths are similar to those of other sequenced fulgorids (1192–1219 bp for 16S rRNA and 711– 747 bp for 12S rRNA inSivaloka damnosus,Geisha, andLaodelphax striatellus) [46,47,48].
A+T-rich Region
The A+T-rich regions can be roughly divided into five sections, which is similar to other fulgoroid species [46,47,48]. In the A+
T-Table 1.Tree statistics for parsimony analyses.
Data set
Total no. characters analyzed
No. of variable characters
No. of parsimony-informative
characters CIa RIb
ALL_123 13378 11473(86%) 10489(78%) 0.215 0.345
ALL_12 9643 7746(80%) 6797(70%) 0.244 0.395
PCG_123 11205 9525(85%) 8791(78%) 0.210 0.337
PCG_12 7470 5798(78%) 5099(68%) 0.244 0.396
rRNAs 2173 1948(89%) 1698(78%) 0.249 0.414
aCI: consistency index; bRI: retention index.
rich region, the poly-T stretch may be important to the initiation of mtDNA replication. The stem-loop secondary structure was suggested to be the site of initiation of the secondary strand synthesis inDrosophila[67]. Such poly-T and stem-loop structures also exist in the fulgoroids’ A+T-rich region. Repetitive sequences have been commonly found in insect mitogenomes [1,68], and the length variations are due to the variable number of repeat copies [69,70,71]. In the six sequenced fulgoroids, all A+T-rich regions contain tandem repeat units. But there are no any similarities in the size and nucleotide composition of repeat units among them.
Saturation Test
Because saturation in substitutions can have negative effects on phylogenetic inference [72], the levels of saturation in
protein-coding genes and mitochondrial rRNA genes were separately explored (Table S4). Xia’s saturation idex (Iss) was estimated and compared to the critical values assuming symmetric (Iss.cSym) and asymmetric (Iss.cAsym) topologies, and a P-value was obtained to assess statistical significance [73,74]. No saturation was detected in the 1st and 2nd codons of protein-coding genes [P(Iss , Iss.c) ,0.05]. For the 3rd codon positions, saturation was detected, with the resulting Iss (0.861) higher than Iss.cSym (0.809). We found similar results in comparisons with Iss.cAsym values. With respect to rRNAs, no saturation was detected in the 16S rRNA alignment, but Iss was greater than both Iss.cSym and Iss.cAsym (NumOUT = 16 or 32) in the 12S rRNA alignment. Therefore, there is some saturation in the third codon positions and rRNAs.
Figure 1. Graphical representation of the mitochondrial genome ofPyrops candelaria.Lines within the circle represent the amplification products. The other two fulgoroid species (Lycorma delicatulaandRicania marginalis) sequenced in this study have the same mitogenome structure asPyrops.
Sequence Diversity and Relative-rates Tests
We calculated average p-distances from PCG_123 between major groups using PHYLTEST (Table S5). The average genetic distances between six whiteflies and other hemipteran groups are higher than those without whiteflies involved. The distances between whiteflies and the psocopteran are close to that between whiteflies and aphids. Furthermore, we carried out pairwise relative-rates tests on PCG_123 using PHYLTEST (Table S6). The family Aleyrodoidea displays higher rates of nucleotide change in the mitochondrial protein-coding genes. The hierarchy of the rate of nucleotide substitution was whiteflies .psyllids .
fulgoroids.aphids.cicadas.true bugs. This hierarchy did not change whether Orthoptera or Lepidoptera was used as outgroup.
Phylogenetic Analyses
In this study, we included 49 taxa of Hemiptera representing four higher groups. After alignment and concatenation, the protein-coding genes totalled 11205 bp and the rRNAs (16S rRNA+12S rRNA) 2173 bp (Table 1).
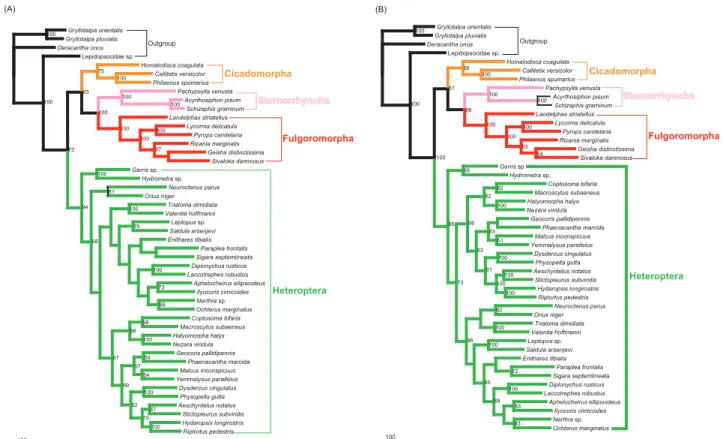
Five different datasets with three inference methods produced 15 phylogenetic trees. These tree topologies were highly compat-ible with each other. Fig. 2, 3, 4 illustrates the results of analyses from the ALL_12 dataset.
In most trees provided in this study, Hemiptera was divided into two groups (Cicadomorpha,(Fulgoromorpha,Sternorrhyncha)) and Heteroptera, rendering Auchenorrhyncha paraphyletic. Heterop-tera and Sternorrhyncha were well supported (both MP and ML bootstrap support values were 100, and Bayesian posterior probability was 1.00).Within Hemiptera, Fulgoromorpha was closer to Sternorrhyncha than to Heteroptera in 11 trees. In the remaining four trees (MP_ALL_123, MP_PCG_123, MP_rRNAs and BI_rRNAs), the group (Cicadomorpha,Fulgoromorpha) was sister to Heteroptera, and Sternorrhyncha was sister clade to the remaining taxa.
Monophyly at the superfamily level within Sternorrhyncha was well supported in all of the topologies. In the MP trees, Aphidoidea was placed as the sister clade to all other taxa within Sternorrhyncha, whereas Psylloidea was found to be the sister group to the remaining sternorrhynchan lineages. But in all
model-based analyses, Psylloidea was recovered as the sister group to all other taxa within Sternorrhyncha, followed by Aphidoidea. Within the suborder Heteroptera, all the major nodes differed among topologies. Several superfamilies were generally well recovered: Lygaeoidea, Pyrrhocoroidea, Coreoidea, Pentatomoi-dea, NepoiPentatomoi-dea, OchteroiPentatomoi-dea, and Reduvioidea.
The interfamilial relationships within Fulgoromorpha were consistently supported. The relationships (Delphacidae,(Fulgori-dae,(Flatidae,(Issidae,Ricaniidae))) were resolved in all analyses except for the datasets using rRNAs. TheLaodelphaxwas placed as the sister to all other taxa in Fulgoromorpha on all trees, and the monophyly ofPyrops+Lycorma was also supported irrespective of the analytical method used.
Effects of Long-branch Attraction
When parsimony and model-based estimates of phylogeny infer different trees, it is desirable to explore the causes of the discrepancy [75]. Long-branch attraction (LBA) is commonly cited as the reason for incongruence between different tree-reconstruction methods [76,77]. Maximum parsimony is consid-ered susceptible to attraction between long branches [78]. In the present study, six representatives of Aleyrodoidea always display branches significantly longer than other hemipteran species (Fig. 2, 3, 4 and Figure S1). This raised the suspicion that the resulting topologies may be compromised by a long-branch attraction artifact.
To test whether LBA affected our phylogenetic analyses, we followed several strategies suggested by Bergsten [79]:
(i) Datasets without 3rd codon positions. When excluding 3rd codon positions, all analyses provided congruent topologies with high statistical support for major nodes: Fulgoromor-pha has a closer relationship to Sternorrhyncha than to other lineages. However, MP analyses including 3rd codon positions produced conflict topologies, with a sister relation-ship between Fulgoromorpha and Heteroptera. The model-based analyses (ML and BI) yielded the same results as those without 3rd codons.
(ii) Exclusion of long-branch taxa. In MP analyses based on datasets ALL_123 and PCG_123, excluding six taxa with Table 2.Nucleotide composition for features in the mitogenomes ofPyrops,Lycorma and Ricania.
genome feature Pyrops Lycorma Ricania
%A %T %G %C Total %A %T %G %C Total %A %T %G %C Total
All sites 47.7 26.6 10.3 15.3 16021 48.7 27.7 8.5 15.1 15946 47.1 29.1 9.4 14.5 15698
Major-strand protein-coding genes 41.4 29.5 11.5 17.6 6738 42.6 30.8 9.2 17.4 6738 40.9 33.0 10.4 15.7 6741
1st codon position 46.6 23.0 16.3 14.1 2246 45.9 24.7 15.2 14.2 2246 45.1 25.6 15.7 13.6 2247
2nd codon position 22.6 42.3 11.8 23.2 2246 21.7 43.8 11.1 23.4 2246 23.1 43.0 11.1 22.8 2247
3rd codon position 55.1 23.2 6.2 15.5 2246 60.2 23.9 1.4 14.5 2246 54.4 30.4 4.4 10.8 2247
Minor-strand protein-coding genes 18.3 57.0 15.2 9.4 4254 19.1 58.5 14.9 7.4 4212 20.4 56.4 13.8 9.4 4197
1st codon position 20.7 52.0 17.5 9.8 1418 21.2 52.5 17.7 8.5 1404 21.7 50.2 17.9 10.2 1399
2nd codon position 16.9 55.6 16.2 11.3 1418 16.9 55.7 16.7 10.8 1404 17.1 55.8 14.6 12.5 1399
3rd codon position 17.3 63.5 12.0 7.2 1418 19.3 67.4 10.4 2.9 1404 22.4 63.2 9.0 5.4 1399
J-strand tRNA 44.0 30.6 13.3 12.1 909 45.5 31.5 11.6 11.4 907 44.3 33.0 11.7 11.0 909
N-strand tRNA 31.8 41.4 16.4 10.4 531 31.2 43.2 16.5 9.1 516 31.5 41.2 18.3 9.1 515
rRNAs 26.9 48.7 15.2 9.2 1931 27.9 49.6 14.3 8.2 1932 49.3 28.3 8.1 14.3 1952
A+T-rich region 50.8 33.0 7.9 8.4 1592 50.3 33.4 7.0 9.3 1642 48.6 33.7 5.6 12.1 1324
long branches yielded almost identical internal structure of Hemiptera: Fulgoromorpha formed a sister group to Sternorrhyncha with high support values (bootstrap val-ue = 100), and Heteroptera alone constituted a major clade within Hemiptera. The topology was very similar to that obtained with the datasets excluding 3rd codon positions, but most higher taxa were recovered with higher support (Fig. 5). (iii) Removal of outgroups. MP analyses of datasets ALL_123 and PCG_123, excluding four outgroup taxa, produced an identical tree topology for Hemiptera (Fig. 6). The only difference was that the MP tree on PCG_123 had an increase in support for a few nodes. In our analyses of rRNAs, we found that the outgroup psocid was always nested within the ingroup. Accordingly, we also estimated trees using PCG_123 with the psocid removed. We estimated a congruent ingroup topology with those remov-ing all outgroups.
The analyses performed above indicated that there is a strong attraction of the clade Sternorrhyncha to the outgroups, and this probably led to LBA artifacts.
rRNA Dataset
The rRNA dataset produced less-resolved topologies. The outgroup Lepidopsocidae sp. tended to group within the ingroup close to Sternorrhyncha in ML and BI analyses. In terms of the family-level relationships in Fulgoromorpha, Flatidae+Ricaniidae formed a moderately supported clade; the position of Issidae varied across different analytical methods. Coreoidea was para-phyletic in the three rRNA analyses and several other datasets that included rRNA (MP_ALL_12, ML_ALL_12, and ML_ALL_123). It is possible that the rRNA data support paraphyly of Coreoidea. Similarly, the monophyly of Cicadomorpha could not be confirmed by the rRNA dataset in MP and ML analyses. These Table 3.Codon usage table forPyrops,LycormaandRicaniamitochondrial DNA.
a.a. codon number a.a. codon number
Pyrops Lycorma Ricania Pyrops Lycorma Ricania
Ala GCG 3 1 2 Pro CCG 8 1 2
GCA 52 58 60 CCA 45 78 69
GCU 21 23 31 CCU 42 36 40
GCC 18 14 5 CCC 34 16 14
Cys UGU 55 53 43 Gln CAG 12 7 14
UGC 9 7 6 CAA 47 50 45
Asn AAU 97 115 125 Trp UGG 14 6 10
AAC 55 35 36 UGA 74 78 69
Asp GAU 49 44 40 Arg CGG 5 3 3
GAC 24 21 18 CGA 24 24 25
Glu GAG 17 9 6 CGU 11 20 14
GAA 72 70 80 CGC 6 0 3
Phe UUU 375 391 408 Ser AGG 14 13 12
UUC 79 67 57 AGA 69 76 62
His CAU 33 33 52 AGU 31 24 23
CAC 33 32 15 AGC 7 2 1
Gly GGG 37 12 24 Ser UCG 6 3 11
GGA 72 99 77 UCA 131 144 141
GGU 57 65 77 UCU 97 89 85
GGC 9 1 5 UCC 20 12 22
Ile AUU 259 274 317 Thr ACG 6 3 1
AUC 73 89 62 ACA 122 121 137
Leu UUG 71 61 61 ACU 49 52 53
UUA 171 230 229 ACC 25 23 14
Leu CUG 13 6 8 Val GUG 15 8 9
CUA 75 65 55 GUA 83 74 73
CUU 57 59 75 GUU 72 86 85
CUC 7 9 13 GUC 13 5 12
Lys AAG 29 15 23 Tyr UAU 111 119 100
AAA 125 143 169 UAC 37 29 35
Met AUG 60 30 38 End UAG 1 1 2
AUA 316 308 245 UAA 10 10 9
problematic topologies might result from alignment errors or from long-branch attraction.
Discussion
Mitochondrial Genome Structure
The start codon forcox1is highly variable across insects, and frequently uses noncanonical start codons that code for amino
acids other than methionine [80,81,82]. However, fulgoroid species do not share this feature. Pyrops uses ATC and Ricania uses ATA as start codon for cox1, whereas conventional methionine (start codon with ATG) is used inLycorma. Although ATG, ATT, ATA, or ATC is universally used as a start codon in mitochondrial protein-coding genes in vertebrates and insects [83,84], there are apparent exceptions to the ATN rule [1]. For example, GTG has been found as the start codon in some insect Figure 2. Maximum-parsimony phylogram of 49 hemipterans.Phylogenetic analysis was based on 13 protein-coding genes (only including first and second codon positions) and two rRNA genes. The tree was rooted by Orthoptera and Psocoptera. Only bootstrap support values above 50% are shown.
mitogenomes: for atp8 in Bactrocera dorsalis [66] and fornad5 in Triatoma [24] and Pteronarcys princes [84]. Similarly in the mitogenome ofPyrops, we found GTG as start codon fornad1.
In accordance with other fulgoroid species, overlapping protein-coding genes are present in Pyrops, Lycorma and Ricania; a 7-bp overlap exists not only betweenatp8 and atp6 but also between Figure 3. Maximum-likelihood phylogram infered from 13 protein-coding genes (1st and 2nd codon positions) and two rRNA genes.The tree was rooted by Orthoptera and Psocoptera. Only bootstrap support values above 50% are shown.
nad4landnad4. In this case, hairpin structures forming at the 39
end of the upstream protein’s mRNA may act as a signal for the cleavage of the polycistronic primary transcript [62].
Phylogenetic Relationships within Hemiptera
Maximum-parsimony analysis, in which all characters were included, produced poorly resolved and poorly supported trees.
Excluding third codon positions tended to increase both resolution and support for nodes. This may be attributed to the generally high rate of evolution at third codon positions for Hemiptera. Maximum-likelihood and Baysian analyses produced broadly similar topologies to the MP analyses without 3rd codon positions. Concordant results between the different analytical approaches provide some confidence in the subordinal structure obtained for Figure 4. Bayesian phylogram inferred from 13 protein-coding genes (1st and 2nd codon positions) and two rRNA genes.The tree was rooted by Orthoptera and Psocoptera. Only posterior probabilities above 50% are shown.
Figure 5. Maximum-parsimony trees from datasets excluding long-branch taxa.(A) Analysis of dataset ALL_123. (B) Analysis of dataset PCG_123. Only bootstrap values above 50% are shown.
doi:10.1371/journal.pone.0048778.g005
Figure 6. Maximum-parsimony trees from datatsets excluding outgroups.(A) Excluding all four outgroups. Branch support values are given as bootstrap values for the dataset ALL_123 (left) and PCG_123 (right). (B) Outgroups excluding only psocid. Only bootstrap values above 50% are shown.
Hemiptera: (((Fulgoromorpha,Sternorrhyncha),Cicadomorpha),-Heteroptera).
The monophyly of Hemiptera is well supported by nucleotide sequences of protein-coding genes, which shows that mitogenome data are very effective in resolving relationships within this group. The relationships (Cicadomorpha,(Fulgoromorpha,Sternor-rhyncha)) were consistently recovered by the analyses using datasets ALL_12 and PCG_12. This suggested a paraphyletic Auchenorrhyncha, which has been proposed by previous studies [33,85,86].
The monophyletic Fulgoromorpha was well recovered in the analyses of the full dataset (PCGs + rRNAs). The phylogenetic hypothesis of (Laodelphax,((Pyrops,Lycorma),(Geisha,(Sivaloka,Ricania))) was strongly supported in the analyses without rRNAs. This result was consistent with those of other molecular studies [23]. The rRNA dataset produced slightly differing topologies (Figure S1). Common to the trees was the placement of Laodelphax as sister taxon to other fulgoroids, which was in line with previous research [25,37,41,87,88]. On the other hand, a sister relationship between Pyropsand Lycormawas consistently resolved in all analyses. This was in accordance with the findings of Yeh et al. [37].
Both the full dataset (ALL_123) and the protein-coding genes (PCG_123) supported a monophyletic Sternorrhyncha. This is in agreement with morphology-based studies [30,38,89]. Heterop-tera was resolved into two major clades. Among pentatomomor-phans, the inferred relationships (Pentatomoidea,(Coreoidea,(Ly-gaeoidea,Pyrrhocoroidea))) were incongruent with a recent molecular study by Hua et al. [63].
Long-branch Attraction Artifact
Long-branch attraction refers to the erroneous grouping of two or more unrelated branches as sister groups due to undetected parallel evolution (homoplasy) [90]. These homoplasies are more likely to occur along long branches. Parsimony analysis has been demonstrated to be vulnerable to the high level of homoplasy, and to be particularly sensitive to LBA [79]. In contrast, by correcting for saturation of substitutions, model-based methods may be relatively insensitive to LBA and infer topologies more accurately [79].
In this work, the conflict between parsimony and model-based methods was detected. We followed a similar protocol to that of Bergsten [79] to investigate possible LBA artifacts. Our results showed that the topological affinities (Sternorrhyncha,(Heterop-tera,(Cicadomorpha,Fulgoromorpha))) is most likely to be the result of the attraction between the whiteflies and the distant psocid outgroup. This is supported by the fact that these two groups share similar rates of evolution and have less sequence divergence. By contrast, the topologies from MP analyses on datasets without 3rd codon positions (removal of fast evolving sites) and those from the model-based methods (which are less commonly affected by LBA) are correct.
Mitochondrial rRNA Genes
In addition to the datasets comprising protein-coding genes, we attempted to gain a better resolution of hemipteran relationships using different genes evolving at different rates, 16S rRNA and 12S rRNA. However, these data yielded the worst topologies and the weakest nodal support, indicating that they might be unsuitable for reconstructing the evolutionary relationships of higher taxa in Hemiptera. This may be due to the substitutional saturation observed in mitochondrial rRNA genes. In addition, it was previously seen that mitochondrial rRNA genes displayed significant differences among lineages in their evolutionary rates [90]. Thus, the phylogenetic inferences based on mitochondrial
rRNAs were likely to be subject to a LBA artifact, and the lineage leading to Sternorrhyncha might have been incorrectly pulled towards the root of the tree.
Comparison to Previous Phylogenetic Results
Complete mtDNA sequences can be informative at deep phylogenetic levels [91], and their phylogenetic utility has been demonstrated in several insect orders (see Introduction). Our results show the paraphyly of Auchenorrhyncha, which is consistent with analyses of full-length or partial sequences of nuclear 18S rDNA [87,92,93]. The discordance between the trees we present here and those reported in previous molecular phylogenetic studies [27,92,93] relates to the position of Fulgor-omorpha in Hemiptera. This may be attributed to different methods, molecular markers, or outgroups used among the phylogenetic analyses. In addition, previous molecular studies were mainly based on single 18S rDNA fragments (,1000 bp, which seems to contain insufficient information) and parsimony analysis. Both the short sequences and methods sensitive to LBA may cause problems in resolving phylogenetic relationships at the intraordinal level of insects.
Although it has been used extensively for studies inferring phylogenies, mtDNA has shortcomings that can limit its potential in recovering the phylogenetic signal [94]. In contrast, nuclear genes evolve more slowly, making them effective sources of information for the analysis of deep phylogenetic relationships. Therefore, a combination of mitochondrial genomes and nuclear genes is expected to provide more precise estimates of phyloge-netic trees.
Conclusions
Hemiptera is the largest nonholometabolan insect assemblage and still contains many species that are underrepresented by complete mitochondrial sequences. Although our limited taxon sampling only can provide a preliminary phylogenetic picture of Hemiptera, our result confirms that mitogenome data are very effective in resolving deeper relationships within this order, and the inclusion or exclusion of third codon positions has a strong influence on phylogenetic reconstruction. Moreover, our results are compatible with our previous findings based on more limited taxon sampling [47,48]. Most topologies inferred in the current study appear to be more consistent with the classical hypothesis by Hamilton [33]. This work has added to current knowledge on the hemipteran phylogeny inferred from mitogenomes. Future research that integrates more taxon sampling, more mitogenome sequences, and data from other molecular markers will provide greater insight into the evolution of Hemiptera.
Supporting Information
Figure S1 Tree topologies of MP, ML, and BI inferred from different data partitions except ALL-12.
(RAR)
Table S1 List of taxa used in the phylogenetic analysis. (XLS)
Table S2 Nucleotide substitution models selected by MrModelTest2.3 for the data partitions, based on the Akaike Information Criterion.
(XLS)
Table S3 Summary of the mitochondrial genes of
Table S4 Test of substitutional saturation. (XLS)
Table S5 Average p-distances between major groups in this study.
(XLS)
Table S6 Relative-rates test as implemented in PHYLT-EST.
(XLS)
Acknowledgments
Special thanks go to Dr Simon Ho and two anonymous reviewers for their thorough and helpful reviews of the manuscript. We also thank Dr Chuan
Ma and Dr Yong-Hua Wu (Institute of Zoology, Chinese Academy of Sciences, Beijing, China) for technical assistance and advice on the experiments. Thanks Dr Hu Li (Department of Entomology, China Agricultural University, Beijing, China) for the help of drawing Fig. 1.
Author Contributions
Conceived and designed the experiments: NS. Analyzed the data: NS. Contributed reagents/materials/analysis tools: AL. Wrote the paper: NS. Determined and assembled the mtDNA sequences of P. candelaria, Lycorma delicatula and Ricania marginalis: NS. Determined the mtDNA sequences of Callitetix versicolor: CB.
References
1. Wolstenholme DR (1992) Animal mitochondrial DNA: structure and evolution. Int Rev Cytol 141: 173–216.
2. Inohira K, Hara T, Matsuura ET (1997) Nucleotide sequence divergence in the A+T-rich region of mitochondrial DNA inDrosophila simulans and Drosophila mauritiana. Mol Biol Evol 14: 814–822.
3. Nardi F, Spinsanti G, Boore JL, Carapelli A, Dallai R, et al. (2003) Hexapod origins: monophyletic or paraphyletic? Science 299: 1887–1889.
4. Cook CE, Yue QY, Akam M (2005) Mitochondrial genomes suggest that hexapods and crustaceans are mutually paraphyletic. Proceedings of the Royal Society of London Series B 272: 1295–1304.
5. Sheffield NC, Song H, Cameron SL, Whiting MF (2009) Nonstationary Evolution and Compositional Heterogeneity in Beetle Mitochondrial Phyloge-nomics. Syst Biol 58: 381–394.
6. Song H, Sheffield NC, Cameron SL, Miller KB, Whiting MF (2010) When phylogenetic assumptions are violated: base compositional heterogeneity and among-site rate variation in beetle mitochondrial phylogenomics. Syst Entomol 35: 429–448.
7. Timmermans MJ, Dodsworth S, Culverwell CL, Bocak L, Ahrens D, et al. (2010) Why barcode? High-throughput multiplex sequencing of mitochondrial genomes for molecular systematics. Nucleic Acids Res 38: e197.
8. Pons J, Ribera I, Bertranpetit J, Balke M (2010) Nucleotide substitution rates for the full set of mitochondrial protein-coding genes in Coleoptera. Mol Phylogenet Evol 56: 796–807.
9. Timmermans MJ, Vogler AP (2012) Phylogenetically informative rearrange-ments in mitochondrial genomes of Coleoptera, and monophyly of aquatic elateriform beetles (Dryopoidea). Mol Phylogenet Evol 63: 299–304. 10. Jiang ST, Hong GY, Yu M, Li N, Yang Y, et al. (2009) Characterization of the
complete mitochondrial genome of the giant silkworm moth,Eriogyna pyretorum
(Lepidoptera: Saturniidae). Int J Biol Sci 5: 351–365.
11. Chai HN, Du YZ, Zhai BP (2012) Characterization of the Complete Mitochondrial Genomes of Cnaphalocrocis medinalis and Chilo suppressalis
(Lepidoptera: Pyralidae). Int J Biol Sci 2012; 8: 561–579.
12. Kim MJ, Kang AR, Jeong HC, Kim KG, Kim I (2011) Reconstructing intraordinal relationships in Lepidoptera using mitochondrial genome data with the description of two newly sequenced lycaenids, Spindasis takanonis and
Protantigius superans(Lepidoptera: Lycaenidae). Mol Phylogenet Evol 6: 436–445. 13. Castro LR, Dowton M (2007) Mitochondrial genomes in the Hymenoptera and
their utility as phylogenetic markers. Syst Entomol 32: 60–69.
14. Cameron SL, Dowton M, Castro LR, Ruberu K, Whiting MF, et al. (2008) Mitochondrial genome organization and phylogeny of two vespid wasps. Genome 51: 800–808.
15. Dowton M, Cameron SL, Austin AD, Whiting MF (2009) Phylogenetic approaches for the analysis of mitochondrial genome sequence data in the Hymenoptera - a lineage with both rapidly and slowly evolving mitochondrial genomes. Mol Phylogenet Evol 52: 512–519.
16. Kaltenpoth M, Showers Corneli P, Dunn DM, Weiss RB, Strohm E, et al. (2012) Accelerated Evolution of Mitochondrial but Not Nuclear Genomes of Hymenoptera: New Evidence from Crabronid Wasps. PLoS ONE 7(3): e32826. doi:10.1371/journal.pone.0032826.
17. Fenn JD, Song H, Cameron SL, Whiting MF (2008) A preliminary mitochondrial genome phylogeny of Orthoptera (Insecta) and approaches to maximizing phylogenetic signal found within mitochondrial genome data. Mol Phylogenet Evol 49: 59–68.
18. Ma C, Liu CX, Yang PC, Kang L (2009) The complete mitochondrial genomes of two band-winged grasshoppers,Gastrimargus marmoratusandOedaleus asiaticus. BMC Genomics 10: 156.
19. Cameron SL, Lambkin CL, Barker SC, Whiting MF (2007) A mitochondrial genome phylogeny of Diptera: whole genome sequence data accurately resolve relationships over broad timescales with high precision. Syst Entomol 32: 40–59. 20. Cameron SL, Sullivan J, Song H, Miller KB, Whiting MF (2009) A mitochondrial genome phylogeny of the Neuropterida (lacewings, alderflies and snakeflies) and their relationship to the other holometabolous insect orders. Zool Scr 38: 575–590.
21. Cameron SL, Whiting MF (2007) Mitochondrial genomic comparisons of the subterranean termites from the GenusReticulitermes(Insecta: Isoptera: Rhino-termitidae). Genome 50: 188–202.
22. Boore JL, Macey JR, Medina M (2005) Sequencing and comparing whole mitochondrial genomes of animals. In Molecular Evolution: Producing the Biochemical Data, Part B Volume 395. San Diego: Elsevier Academic Press Inc. 311–348.
23. Urban JM, Cryan JR (2007) Evolution of the Planthoppers (Insecta: Hemiptera: Fulgoroidea). Mol Phylogenet Evol 42: 556–572.
24. Dotson EM, Beard CB (2001) Sequence and organization of the mitochondrial genome of the Chagas disease vector,Triatoma dimidiata. Insect Mol Biol 10: 205– 215.
25. Dyck VA, Thomas B (1979) The brown planthopper problem. In IRRI ‘‘Brown planthopper: threat to rice production in Asia’’. 3–17. IRRI.Los Banos Philippines, 369.
26. Carver M, Gross GF, Woodward TE (1991) Hemiptera (bugs, leafhoppers, cicadas, aphids, scale insects, etc.).InThe insects of Australia, a textbook for students and research workers. Edited by CSIR Organization. Melbourne University Press, Victoria, Australia 429–509.
27. von Dohlen CD, Moran NA (1995) Molecular phylogeny of the Homoptera: a paraphyletic taxon. J Mol Evol 41: 211–223.
28. Stewart JB, Beckenbach AT (2005) Insect mitochondrial genomics: the complete mitochondrial genome sequence of the meadow spittlebugPhilaenus spumariuss
(Hemiptera: Auchenorrhyncha: Cercopoidae). Genome 48: 46–54.
29. Kramer S (1950) The morphology and phylogeny of auchenorhynchous Homoptera (Insecta). Ill Biol Monog 20: 1–11.
30. Hennig W (1981) Insect phylogeny. J Wiley and Sons, New York.
31. Campbell BC, Steffen-Campbell JD, Sorensen JT, Gill RJ (1995) Paraphyly of Homoptera and Auchenorrhyncha inferred from 18S rDNA nucleotide sequences. Syst Entomol 20: 175–194.
32. Boudreaux HB (1979) Arthropod phylogeny with special reference to insects. J Wiley and Sons, New York.
33. Hamilton KGA (1981) Morphology and evolution of the rhynchotan head (Insecta: Hemiptera, Homoptera). Can Entomol 113: 953–974.
34. Wootton RJ, Betts CR (1986) Homology and function in the wings of Heteroptera. Syst Entomol 11: 389–400.
35. Zrzavy J (1992,) Evolution of antennae and historical ecology of the hemipteran insects (Paraneoptera). Acta Entomol Bohemoslov 89: 77–86.
36. Asche M (1987) Preliminary thoughts on the phylogeny of Fulgoromorpha (Homoptera Auchenorrhyncha). In: Proceedings of the 6th Auchenorrhyncha Meeting, Turin, Italy, 7–11 September, 47–53.
37. Yeh WB, Yang CT, Hui CF (2005) A molecular phylogeny of planthoppers (Hemiptera: Fulgoroidea) inferred from mitochondrial 16S rDNA sequences. Zool Stud 44: 519–535.
38. Evans JW (1963) The phylogeny of the Homoptera. Annu Rev Entomol 8: 77– 94.
39. Cobben RH (1978) Evolutionary trends in Heteroptera. II. Mouthpartstructures and feeding strategies. Mededelingen Landbouwhogeschool, Wageningen, The Netherlands.
40. Emel’yanov AF (1987) The phylogeny of the Cicadina (Homoptera, Cicadina) based on comparative morphological data. Trudy Vsesoyuznogo Entomolo-gischeskogo Obshchestva 69: 19–109.
41. Yeh WB, Yang CT, Hui CF (1998) Phylogenetic relationships of the Tropiduchidae-group (Homoptera: Fulgoroidea) of planthoppers inferred through nucleotide sequences. Zool Stud 37: 45–55.
42. Dijkstra E, Rubio JM, Post RJ (2003) Resolving relationships over a wide taxonomic range in Delphacidae (Homoptera) using the COI gene. Syst Entomol 28: 89–100.
43. Dijkstra E, Slotman ME, Post RJ (2006) Resolution of phylogenetic relationships of the major subfamilies of the Delphacidae (Homoptera: Fulgoroidea) using the mitochondrial ribosomal DNA. Insect Sci 13: 167–177.
combined analyses of mitochondrial and nuclear genes. Mol Phylogenet Evol 48: 667–678.
45. Urban JM, Bartlett C, Cryan J (2010) Evolution of Delphacidae (Hemiptera: Fulgoroidea): combined-evidence phylogenetics reveals importance of grass host shifts. Syst Entomol 35: 678–691.
46. Song N, Liang A-P (2009a) The complete mitochondrial genome sequence of
Geisha distinctissima(Hemiptera: Flatidae) and comparison with other hemipteran insects. Acta Biochim Biophys Sin 41: 206–216.
47. Song N, Liang A-P (2009b) Complete mitochondrial genome of the small brown planthopper,Laodelphax striatellus(Delphacidae: Hemiptera), with a novel gene order. Zool Sci 26: 851–860.
48. Song N, Liang A-P, Ma C (2010) The complete mitochondrial genome sequence of the planthopper,Sivaloka damnosus. J Insect Sci 10: 76.
49. Chou L, Lu JS, Huang J, Wang SZ (1985) Economic insect fauna of China Fasc. 36 Homoptera Fulgoroidea 1–152.
50. Aljanabi SM, Martinez I (1997) Universal and rapid salt-extraction of high quality genomic DNA for PCR-based techniques. Nucleic Acids Res 25: 4692– 4693.
51. Simon C, Buckley TR, Frati F, Stewart JB, Beckenbach AT (2006) Incorporating molecular evolution into phylogenetic analysis, and a new compilation of conserved polymerase chain reaction primers for animal mitochondrial DNA. Annu Rev Ecol Evol Syst 37: 545–579.
52. Hall TA (1999) BioEdit: a user-friendly biological sequence alignment editor and analysis program for Windows 95/98/NT. Nucleic Acids Symp Ser 41: 95–98. 53. Tamura K, Peterson D, Peterson N, Stecher G, Nei M, et al. (2011) MEGA5: Molecular Evolutionary Genetics Analysis using Maximum Likelihood, Evolutionary Distance, and Maximum Parsimony Methods. Mol Biol Evol 28: 2731–2739.
54. Lowe TD, Eddy SR (1997) tRNAscan-SE: a program for improved detection of transfer RNA genes in genomic sequence. Nucleic Acids Res 25: 955–964. 55. Zuker M (2003) Mfold web server for nucleic acid folding and hybridization
prediction. Nucleic Acids Res 31: 3406–3415.
56. Xia X, Xie Z (2001) DAMBE: Data analysis in molecular biology and evolution. J Hered 92: 371–373.
57. Kumar S (1996) PHYLTEST: a program for testing phylogenetic hypotheses, Version 2.0.
58. Swofford DL (2003) PAUP*. Phylogenetic Analysis Using Parsimony (* and other methods). Version 4 (beta 10). Sinauer Associates, Sunderland, Massachusetts.
59. Jobb G, von Haeseler A, Strimmer K (2004) TREEFINDER: a powerful graphical analysis environment for molecular phylogenetics. BMC Evol Biol 4: 18.
60. Ronquist F, Teslenko M, van der Mark P, Ayres D, Darling A, et al. (2012) MrBayes 3.2: Effcient Bayesian phylogenetic inference and model choice across a large model space. Syst Biol 61: 539–42.
61. Nylander JAA (2004) MrModeltest v2. Program distributed by the author. Evolutionary Biology Centre, Uppsala University, Uppsala.
62. Clary DO, Wolstenholme DR (1985) The mitochondrial DNA molecule of
Drosophila yakuba: nucleotide sequence, gene organization, and genetic code. J Mol Evol 22: 252–271.
63. Hua JM, Li M, Dong PZ, Cui Y, Xie Q, et al. (2008) Comparative and phylogenomic studies on the mitochondrial genomes of Pentatomomorpha (Insecta: Hemiptera: Heteroptera). BMC Genomics 9: 610.
64. Hua JM, Li M, Dong PZ, Cui Y, Xie Q, et al (2009) Phylogenetic analysis of the true water bugs (Insecta: Hemiptera: Heteroptera: Nepomorpha): evidence from mitochondrial genomes. BMC Evolut Biol 9: 134.
65. Beard CB, Mills D, Collins FH (1993) The mitochondrial genome of the mosquito Anopheles gambiae: DNA sequence, genome organization, and comparisons with mitochondrial sequences of other insects. Insect Mol Biol 2: 103–124.
66. Yu DJ, Xu L, Nardi F, Li JG, Zhang RJ (2007) The complete nucleotide sequence of the mitochondrial genome of the oriental fruit fly,Bactrocera dorsalis
(Diptera: Tephritidae). Gene 396: 66–74.
67. Clary DO, Wolstenholme DR (1987)Drosophilamitochondrial DNA: conserved sequences in the A+T rich region and supporting evidence for a secondary structure model of the small ribosomal RNA. J Mol Evol 25: 116–125. 68. Zhang DX, Hewitt GM (1997) Insect mitochondrial control region: a review of
its structure, evolution and usefulness in evolutionary studies. Biochem Syst Ecol 25: 99–120.
69. Broughton RE, Dowling TE (1994) Length variation in mitochondrial DNA of the minnowCyprinella spiloptera. Genetics 138: 179–190.
70. Fumagalli L, Taberlet P, Favre L, Hausser J (1996) Origin and evolution of homologous repeated sequences in the mitochondrial DNA control region of shrews. Mol Biol Evol 13: 31–46.
71. Wilkinson GS, Mayer F, Kerth G, Petri B (1997) Evolution of repeated sequence arrays in the D-loop region of bat mitochondrial DNA. Genetics 146: 1035– 1048.
72. Swofford DL, Olsen GJ, Waddell PJ, Hillis DM (1996) Phylogenetic Inference. InMolecular systematics, 2nd
edition, chap. 5, 407–514. Sinauer and Associates, Sunderland, Massachusetts.
73. Xia X, Li C, Yang Q (2003) Routine analysis of molecular data with software DAMBE. Pp. 149–167 in Yang, Q. ed. Fundamental concepts and methodology in molecular palaeontology. Science Publishers, China.
74. Xia X, Lemey P (2009) Assessing substitution saturation with DAMBE. Pp. 615– 630 in Philippe Lemey, Marco Salemi and Anne-Mieke Vandamme, eds. The Phylogenetic Handbook: A Practical Approach to DNA and Protein Phylogeny. 2nd edition. Cambridge University Press.
75. Hillis DM, Huelsenbeck JP, Swofford DL (1994) Hobgoblin of phylogenetics? Nature 369: 363–364.
76. Hendy MD, Penny D (1989) A framework for the quantitative study of evolutionary trees. Syst Zool 38: 297–309.
77. Philippe H, Zhou Y, Brinkmann H, Rodrigue N, Delsuc F (2005) Heterotachy and long-branch attraction in phylogenetics. BMC Evol Biol 5: 50.
78. Ho SYW, Jermiin LS (2004) Tracing the decay of the historical signal in biological sequence data. Syst Biol 53: 623–637.
79. Bergsten J (2005) A review of long-branch attraction. Cladistics 21: 163–193. 80. Bae JS, Kim I, Sohn HD, Jin BR (2004) The mitochondrial genome of the
firefly, Pyrocoelia rufa: complete DNA sequence, genome organization, and phylogenetic analysis with other insects. Mol Phylogenet Evol 32: 978–985. 81. Junqueira ACM, Lessinger AC, Torres TT, Rodrigues da Silva F, Vettore AL,
et al. (2004) The mitochondrial genome of the blowfly Chrysomya chloropyga
(Diptera: Calliphoridae). Gene 339: 7–15.
82. Kim I, Lee EM, Seol KY, Yun EY, Lee YB, et al. (2006) The mitochondrial genome of the Korean hairstreak,Coreana raphaelis(Lepidoptera: Lycaenidae). Insect Mol Biol 15: 217–225.
83. Fearnley IM, Walker JE (1987) Initiation codons in mammalian mitochondria: differences in genetic code in the organelle. Biochemistry 26: 8247–8251. 84. Stewart JB, Beckenbach AT (2006) Insect mitochondrial genomics 2: the
complete mitochondrial genome sequence of a giant stonefly,Pteronarcys princes, asymmetric directional mutation bias, and conserved plecopteran A+T-region elements. Genome 49: 815–824.
85. Ross HH (1965) A textbook of entomology, 3rd ed. Wiley, New York. 86. Goodchild AJP (1966) Evolution of the alimentary canal in the Hemiptera. Biol
Rev 41: 97–140.
87. Bourgoin T, SteVen-Campbell JD, Campbell BC (1997) Molecular phylogeny of Fulgoromorpha (Insecta, Hemiptera, Archaeorrhyncha). The enigmatic Tetti-gometridae: evolutionary affiliations and historical biogeography. Cladistics 13: 207–224.
88. Yeh WB, Yang CT (1999) Fulgoromorpha phylogeny based on 28S rDNA nucleotide sequence. Chin J Entomol 11: 87–111.
89. Schuh RT (1979) Review of RH Cobben, Evolutionary Trends in Heteroptera. Part II. Mouthpart-structures and feeding strategies. Syst Zool 28: 653–656. 90. Felsenstein J (1978) Cases in which parsimony or compatibility methods will be
positively misleading. Syst Zool 27: 401–410.
91. Curole JP, Kocher TD (1999) Mitogenomics: digging deeper with complete mitochondrial genomes. Trends Ecol Evol 14: 394–398.
92. Campbell BC, Steffen-Campbell JD, Gill RJ (1994) Evolutionary origin of whiteflies (Hemiptera: Sternorrhyncha: Aleyrodidae) inferred from 18s rDNA sequences. Insect Mol Biol 3: 73–89.
93. Sorensen JT, Campbell BC, Gill RJ, Steffen-Campbell JD (1995) Non-monophyly of Auchenorrhyncha (‘Homoptera’), based upon 18s rDNA phylogeny: eco-evolutionary and cladistic implications within pre-Heteropter-odea Hemiptera (s.1.) and a proposal for new, monophyletic suborders. Pan-Pac. Entomol. 71: 31–60.