2003 Institute of Mathematics and Informatics, Vilnius
Forecasting Models in the State Education System
Gintautas DZEMYDA, Vyd¯unas ŠALTENIS, Vytautas TIEŠIS
Vilnius Pedagogical UniversityStudent
֒
u 39, LT-2004 Vilnius, Lithuania
Institute of Mathematics and Informatics Akademijos 4, LT-2021 Vilnius, Lithuania e-mail: {dzemyda, saltenis, tiesis}@ktl.mii.lt
Received: March 2003
Abstract. This paper presents model-based assessment and forecasting of the Lithuanian education
system in the period of 2001–2010. In order to obtain satisfactory forecasting results, constructing of models used for these aims should be grounded on some interactive data mining. Data mining of data stored in the system of the Lithuanian teacher’s database and of data from other sources rep-resenting the state of education system and the demographic changes in Lithuania was used. The models cover the estimation of data quality in the databases, the analysis of flow of teachers and pupils, the clustering of schools, the model of dynamics of pedagogical staff and pupils, and the quality analysis of teachers. The main results of forecasting and integrated analysis of the Lithua-nian teachers’ database with other data reflecting the state of the education system and demographic changes in Lithuania are presented.
Key words: modelling, forecasting, education system, data mining.
1. Introduction
Forecasting models of complex social or state systems usually are based on the analy-sis of large amount of information by using suitably adjusted methods. Selection of the methods and constants of models is usually accompanied by the arising of some hypothe-ses. Another origin of hypotheses is a limited possibility to access the required data and also the insufficient reliability of data.
Usually data mining tasks involve forecasting of some variables (Han and Kamber, 2000). In this paper, we discuss a general scheme of the interactive data mining in data sources that may fulfil verification of the hypotheses and ensure the construction of well-founded forecasting models. Moreover, we apply the general scheme of the special data mining on data stored in the system of the Lithuanian teachers’ database, pupils’ database, and of data from other data sources representing the state of education system. The data on demographic changes in Lithuania were also used.
In a result, the model-based forecasting of the Lithuanian education system in the period of 2001–2010 has been successfully performed. The results of the investigation discovered significant problems that may be encountered in the future by the state ed-ucation system: pedagogical staff redundancy for some subjects and for some regions (especially for primary schools).
This paper is organised in the following way. In Section 2 we present a general scheme of the interactive data mining. In Section 3 the problems arising in constructing the fore-casting models that uses the information from different sources are discussed and the main hypotheses for interactive data mining are formulated. In Sections 4 and 5 some results are presented for the Lithuanian education system case.
2. A General Scheme of the Interactive Data Mining
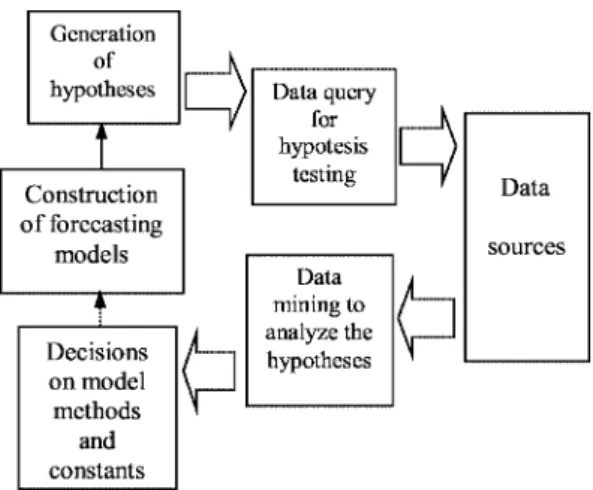
A general scheme of the interactive data mining for constructing the forecasting models is presented in Fig. 1.
Process of the rational constructing the forecasting models usually consists of a set of various decisions that should be made. These decisions usually concern the types of models used. For example: what kind of regression model may be applied, do we may assume the linearity? Sometimes the forecasting is performed by using constants, the ratios of values or the trends of quantitative values. Sometimes our design of forecasting scheme includes data that are not reliable or part of the data may be missed at all.
These decisions may be treated as some sort of hypotheses testing. Only in some cases a preliminary decisions may be fulfilled on a priori information. Usually we generate some hypotheses, then form special data query for the hypotheses testing. Data mining in the query results gives the information for the proper decision.
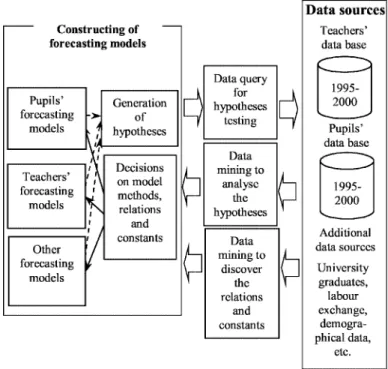
Fig. 2 illustrates the interactive data mining scheme for the forecasting models of Lithuanian state education system. Here the data sources consist of teachers’ database,
Fig. 2. The flow-chart of the interactive data mining for constructing the forecasting models of the state educa-tion system.
pupils’ database and some additional data sources containing information about demo-graphic situation, university graduates, etc.
3. Forecasting Models and Data Mining
The prediction is usually made by two common approaches: the statistical forecasting (naive extrapolation or causal one (Armstrong, 1985)) or the simulation as well as mod-elling based on differential equations (Brauer and Castillo–Chavez, 2001). The statis-tical approach, especially naive, may be rather simply implemented. However, it treats data formally as statistical numbers, therefore sometimes there are difficulties to account functional dependence.
The second approach is based on the analytic model, and the data are used to mine parameters of the model or to verify assumptions on the model. However, sometimes it is difficult to construct a complex model or to evaluate a great number of parameters due to the insufficiency of data. In such cases, we have introduced a mixed approach in which analytic models involve factor trends as parameters (Dzemyda et al., 2001; Šaltenis et
al., 2002). The approach reduces a number of functions and parameters in the model.
3.1. Model of the Lithuanian Education System
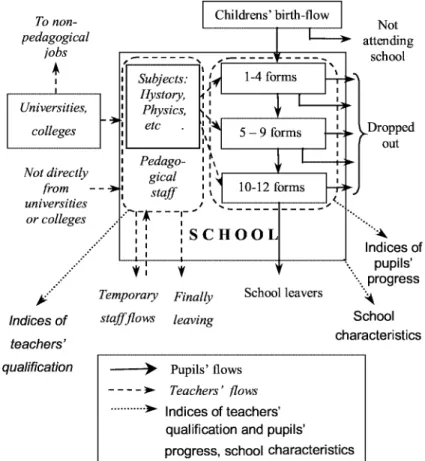
Let us consider the process of model constructing on the example of Lithuanian educa-tion system, which schematic model is presented in Fig. 3. The model is complicated, therefore we will expose only a little part of its features in this paper.
The aim of forecasting models was to evaluate the evolution of the state education system in Lithuania in the nearest future. Continuous reducing of birth rate in the state requires being ready to the future problems.
The main parts of forecasting models are the following:
• pupils’ number forecast models;
• teachers’ number forecast models;
• models for clustering of schools;
• models that evaluate the quality of teachers’.
Fig. 3 illustrates the flow of children. The majority of them come to the 1th forms. During the school years a part of them drops out the school.
The flow of teachers comes to a school from universities and colleges. They may leave a school temporary or permanently.
Schools, teachers and pupils may by characterised by some quality indices.
3.2. Pupils’ Number Forecast
The pupils’ number forecasting models include:
• Forecasting of pupils’ input flows into the first forms on the base of analysis of birth rate data;
• Forecasting of dropped out pupils’ flows;
• Forecasting of the distribution of these flows in various regions.
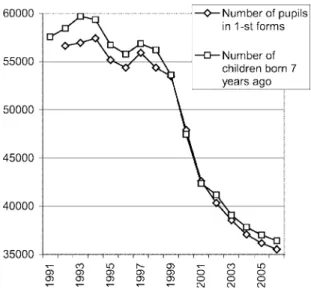
Fig. 4 illustrates the main idea of the forecasting model: the input flow of pupils may be evaluated using demographic birth-rate data sources. Data mining discovered that 97.1% of all children of 7.3 years age (in average) are found in the first forms. These characteristics are stable during a long time period.
3.3. Teachers’ Number Forecast
It is important for education politicians to forecast the amount of teachers necessary to serve present and future number of pupils. The trends are not suitable in the case because the amount of teachers obviously depends on the number of pupils as well as on many other factors characterising the education policy and social circumstances. The number of pupils may have essential changes, and it is impossible to forecast the changes by trends. It is valid in the case of present Lithuania. We have suggested the hypotheses that a num-ber of teachers, teaching some subject, is proportional to a numnum-ber of pupils in the forms,
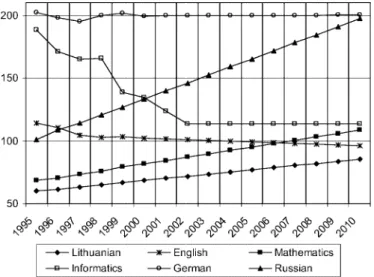
in which the subject is taught. The coefficient of proportion (the ratio teachers/pupils) for most education subjects, especially traditional, changes slowly. The coefficient accu-mulates all the social and educational policy factors and may be often forecasted by the trends. Some trends of the pupils/teachers coefficient mined from the Lithuanian teacher’s database are presented in Fig. 5.
The trends in Fig. 5 were forecasted using the regression. All trends are smooth except for the ratio pupils/(informatics’ teachers). So, the proposed hypothesis of simple model is not proper for informatics subject due to the fast development of informatics’ teaching. The discovered ratios were used to forecast necessary number of teachers.
The future supply and demand in the teachers’ job market depends on teachers’ flows, presented in Fig. 3, as well as on the necessary teachers’ numbers. The decreasing pupils’ number reduces necessary teachers’ number. On the other hand the significant amount of old teachers as well as lack of incoming young teachers may balance surplus of teach-ers. The characteristic representation of such case is shown in Fig. 6 which presents the statistical distribution (histogram) of mathematicians’ numbers. The similar distributions are for physicists, geographers, historians, chemists and biologists. The contrary case is for teachers of primary school (see Fig. 7). Only in very last years the education of them was reduced.
The model, that combines statistical forecasting with analytic modelling, was pro-posed to forecast the number of active teachers working in schools or looking for a teacher’s job (see Dzemyda et al., 2001). Parameters of the model, representing flows of teachers, were forecasted by the use of histograms (see Fig. 6, 7) for several succes-sive years.
The number of active teachers of some speciality or qualification may be forecasted by such model, depending on the nature of data used.
If the difference between the necessary and active teachers’ number is positive, then
Fig. 6. Histogram of mathematicians; colored part represents specialists.
Fig. 7. Histogram of primary school teachers; colored part represents specialists.
there is an unsatisfied demand, otherwise, there is a surplus in teachers of the considered speciality or qualification.
4. Performance Results: the Lithuanian Education System Case
The forecast was performed by the use of models and data presented in Fig. 2.
The total pupils’ number forecast is presented in Fig. 8. Here we see that the number of pupils in primary schools (1–4 forms) dramatically decreases. This wave of low birth rate will reach the higher forms in the near future.
Fig. 8. Pupils’ number forecast.
The forecast of unsatisfied mathematicians demand or surplus is also presented in Fig. 9 for instance. It is interesting to note that only mathematicians-pedagogical special-ists may be engaged as teachers in 2010. The forecast for all the rest subjects is presented in (Dzemyda et al., 2001).
5. Estimates of Dynamics of Teachers’ Flow
It is a valuable opportunity to observe the dynamics of teachers’ flow from the teachers’ databases of different school years and to get quantitative estimates of the flow.
ous aspects of the flow have been examined below. The results are useful in building a mathematical model of the state education system.
By fixing the starting year, we can evaluate the percentage of teachers that continued working at the comprehensive school after one, two, or more years. The results are pre-sented in Fig. 10a for teachers in the city and rural district schools. The figure indicates a decrease in the number of teachers, who worked during the 1995–1996 school year (for short, we put 1995 instead of 1995–1996 school year in the figure; in the next figures of this section we do alike). Similar results are presented in Fig. 10b for different starting years and without sorting teachers into the city and district ones. Fig. 10 indicates that teachers from the city leave their work at school more often than those from the district.
Fig. 11 shows the dynamics of teachers and pupils’ number in the comprehensive schools as compared with the 1995–1996 school year. We can conclude here that the number of teachers grows at a similar rate as the number of pupils independently of the political and economical factors affected the Lithuanian state education system. However, the growth of the number of teachers in the preschools slows down (see Fig. 12). This is an indicator of a decrease in the number of preschool children (see Fig. 4 for addi-tional details). These tendencies will influence the number of pupils and teachers in the comprehensive schools soon.
The data in Fig. 13 give a possibility to evaluate the tendencies of return to the peda-gogical work: how many teachers, who had worked at the comprehensive school during the 1995–1996 school year and left it the next school year, have returned later. Curve 1
Fig. 11. Dynamics of teachers and pupils’ number.
Fig. 12. Dynamics of the number of teachers in the preschools.
Fig. 13. Tendencies of return to the pedagogical work.
indicates the general percent of return, curves 2 and 3 are the return percent of women, who were no younger than 35 and 30, respectively, in the 1995–1996 school year. Curves 2 and 3 allow us to estimate the return after the maternity leave. From Fig. 13 we see that approximately 25% of teachers, who had worked during the 1995–1996 school year and left the comprehensive school in 1996–1997, returned in 1999–2000 school year. The return after a three-year maternity leave makes up about 13–16%.
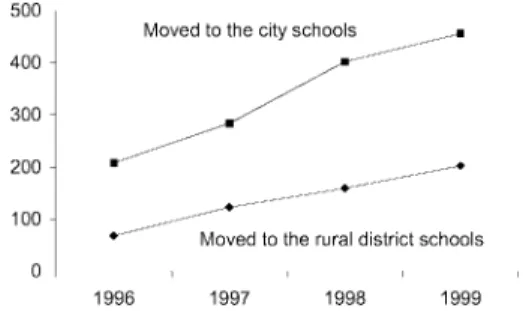
Fig. 14. Fluctuation of teachers between the city and rural district.
many teachers, who had worked in the comprehensive school during the 1995–1996 school year, have changed their work from the city school to the rural district one or vice versa. Obviously, teachers prefer working at the city school rather than the rural district ones (more than two times).
6. Conclusions
The paper proposes an approach for the interactive data mining during the building of the forecasting models.
In order to obtain satisfactory forecasting results, constructing of models used for these aims should be grounded on some interactive data mining. Process of construct-ing is usually accompanied by the arisconstruct-ing of some hypotheses to background methods or models. Also data sources should be verified on accessibility and reliability. Special data mining of data sources may fulfil verification of the hypotheses. Interactive data min-ing of data stored in the system of the Lithuanian teacher’s database and of data from other sources representing the state of education system and the demographic changes in Lithuania was successfully used. The discovered forecast serves as a basis for evidence based policy of the Lithuanian education system.
Acknowledgements
This research is part of the project supported by the Lithuanian Ministry of Education and the Open Society Fund Lithuania.
References
Armstrong, J.S. (1985). Long-Range Forecasting. 2nd edn. A Wiley-Interscience publication, New York. Brauer, F., and C. Castillo–Chavez (2001). Mathematical models in population biology and epidemiology. Texts
in Applied Mathematics, 40, Springer–Verlag.
Dzemyda, G., P. Gudynas, V. Šaltenis and V. Tiešis (2001). Teachers and Pupils in Lithuania: Analysis and Prognosis. Mokslo Aidai, Vilnius (in Lithuanian).
Han, J., and M. Kamber (2000). Data Mining: Concepts and Techniques. Morgan Kaufmann.
G. Dzemyda graduated from Kaunas University of Technology, Lithuania, in 1980, and
in 1984 received there the doctoral degree in technical sciences (PhD) after post-graduate studies at the Institute of Mathematics and Informatics, Vilnius, Lithuania. In 1997 he received the degree of Doctor Habilius from Kaunas University of Technology. He was conferred the title of professor (1998) at Kaunas University of Technology. He is a deputy director of the Institute of Mathematics and Informatics and a head of the System Anal-ysis Department. The main field of scientific interests is the interaction of optimization and data analysis. The interests include optimization theory and applications, multiple criteria decisions, neural networks, and data analysis.
V. Šaltenis graduated from the Kaunas Technological Institute, Lithuania, in 1959. He
received a PhD degree from the Moscow Energy Institute of the USSR Academy of Sci-ences in 1966 and the degree of Doctor Habilius from the Institute of Mathematics and Informatics, Vilnius in 1998. He is a principle researcher of the System Analysis De-partment at the Institute of Mathematics and Informatics, Lithuania. His present research interests include both theory and applications of the structure of optimization problems, modelling, multicriteria decision support systems.
V. Tiešis graduated from the Kaunas University of Technology. He occupies the position
of a research fellow at the Institute of Mathematics and Informatics. Alone or with co-authors he has published more than 80 scientific papers and a monograph. His research interests include non-linear and integer optimisation algorithms, conditions of conver-gence, and efficiency of rough algorithms. His present interests include modelling and control in sociology, epidemiology, economics, military operation, and technology.
Prognozavimo modeliai švietimo sistemoje
Gintautas DZEMYDA, Vyd ¯unas ŠALTENIS, Vytautas TIEŠIS
Straipsnyje pasi¯ulyti kiekybiniai prognozavimo modeliai švietimo sistemoje. Modeliai panau-doti Lietuvos švietimo sistemos analizei ir prognozavimui iki 2010 met
֒
u. Konstruojant modelius
formuluojamos prielaidos apie šiu modeli֒ u savybes bei parametrus. Šios prielaidos patikrinamos֒
interaktyviu b¯udu analizuojant žinias, išskirtas iš Lietuvos mokytoj
֒
u bei mokini
֒ u duomen ֒ u bazi ֒ u
ir kitu šaltini֒ u, turinˇci֒ u duomen֒ u apie švietimo sistem֒ a bei demografinius reiškinius. Modeliai֒
apima mokytoj
֒
u bei mokini
֒
u sraut
֒
u analiz
֒
e ir prognoz
֒
e. Moksleivi
֒
u skaiˇciaus analiz˙e, besiremianti atskleistais moksleivi
֒
u nubyr˙ejimo ir vaik
֒
u gimstamumo d˙esningumais, leidžia prognozuoti, kad d˙el demografin˙es kriz˙es
֒
i bendrojo lavinimo mokykl
֒
u pirm
֒
asias klases 2006 m. ateis maždaug treˇcdaliu mažiau moksleivi
֒
u, nei j
֒
u at˙ejo 1999 m. Straipsnyje parodoma, kaip šios kriz˙es banga v˙elesniais metais risis per vyresnes klases. Pedagoginio personalo poreiki
֒
u analiz˙e, besiremianti prognozuojamu moksleivi
֒
u skaiˇciumi, mokom
֒ uj ֒ u dalyk ֒ u ֒
ivairiose mokymo pakopose strukt¯ura,
pedagogu amžiaus strukt¯ura bei j֒ u at˙ejimo ir iš˙ejimo iš darbo srautais, leidžia prognozuoti per-֒
sonalo poreikio maž˙ejim
֒
a. Parodyta, kad d˙el pedagog
֒
u amžiaus strukt¯uros bei kvalifikacijos
ne-tolygumo ši pedagogu darbo rinkos kriz˙e skirtingu mastu pasireikš֒ ivairi֒ u specialybi֒ u d˙estytojams.֒
Straipsnyje demonstruojama ir teigiama kriz˙es pus˙e – po keli
֒
u met
֒
u kai kuri
֒
u dalyk
֒
u d˙estymui pakaks tik tinkamo išsilavinimo d˙estytoj
֒
u. Straipsnyje aptariami mokytoj
֒
u iš˙ejimo bei gr
֒ ižimo ֒ i darb ֒
a srautai, taip pat srautai tarp miesto ir kaimo, kur ryšk˙eja tendencija persikelti
֒ i miest ֒ a. Pateikti min˙et ֒ u duomen ֒ u šaltini ֒