Submitted13 June 2014 Accepted 1 August 2014 Published26 August 2014 Corresponding author
Michael G. Walsh, thegowda@gmail.com, michael.walsh@downstate.edu
Academic editor
Claus Wilke
Additional Information and Declarations can be found on page 13
DOI10.7717/peerj.533 Copyright
2014 Walsh
Distributed under
Creative Commons CC-BY 4.0 OPEN ACCESS
Rat sightings in New York City are
associated with neighborhood
sociodemographics, housing
characteristics, and proximity to open
public space
Michael G. Walsh
Department of Epidemiology and Biostatistics, School of Public Health, State University of New York, Downstate, Brooklyn, NY, USA
ABSTRACT
Rats are ubiquitous in urban environments and, as established reservoirs for infectious pathogens, present a control priority for public health agencies. New York City (NYC) harbors one of the largest rat populations in the United States, but surprising little study has been undertaken to define rat ecology across varied features of this urban landscape. More importantly, factors that may contribute to increased encounters between rats and humans have rarely been explored. Using city-wide records of rat sightings reported to the NYC Department of Health and Mental Hygiene, this investigation sought to identify sociodemographic, housing, and physical landscape characteristics that are associated with increased rat sightings across NYC census tracts. A hierarchical Bayesian conditional autoregressive Poisson model was used to assess these associations while accounting for spatial heterogeneity in the variance. Closer proximity to both subway lines and recreational public spaces was associated with a higher concentration of rat sightings, as was a greater presence of older housing, vacant housing units, and low education among the population. Moreover, these aspects of the physical and social landscape accurately predicted rat sightings across the city. These findings have identified specific features of the NYC urban environment that may help to provide direct control targets for reducing human–rat encounters.
Subjects Epidemiology, Public Health
Keywords Rattus norvegicus, Rats, Landscape epidemiology, Urban health, Zoonotic diseases
INTRODUCTION
Rats are a prominent feature of the human landscape and can compromise public health.
Rattus norvegicus, commonly known as the brown or Norway rat, is ubiquitous in urban settings across the United States (US), whileRattus rattus, commonly known as the black rat (or roof rat), is now limited primarily to parts of the southeastern US.Rattus norvegicusis a burrowing species and thus often occupies the underground environs of subway and sewer systems (Clinton, 1969). Given its preferred environment,R. norvegicus
bacterial pathogens such asYersinia pestis,Leptospiraspp.,Rickettsia typhi,Streptobacillus moniliformis, andBartonellaspp., which are responsible for bubonic plague, leptospirosis, murine typhus, rat-bite fever, and bartonellosis, respectively (Himsworth et al., 2013). Viral zoonoses are less commonly derived from rat reservoirs, though rats are the primary reservoir for Seoul hantavirus and a potential reservoir for hepatitis E virus (Himsworth et al., 2013). Some of these pathogens have been documented among rat populations in many urban centers across the US over recent decades (Gundi et al., 2012;Purcell et al., 2011;Easterbrook et al., 2007). Ongoing surveillance by the Zoonotic, Influenza, and Vector-borne Disease Unit at the NYC DOHMH has shown sustained prevalence of canine leptospirosis believed to be acquired through rat-associated transmission (NYC Department of Health and Mental Hygiene, 2008;NYC Department of Health and Mental Hygiene, 2011). Perhaps an even bigger public health concern is the potential for
MATERIALS AND METHODS
Rat data were acquired from the NYC Department of Health and Mental Hygiene (DOHMH) through the city’s Open Data Portal (NYC Open Data, 2013a). Between January 1, 2010 and March 24, 2014, a total of 43,542 rat sightings were reported to the Department from all five of the city’s boroughs. The reports were recorded by the DOHMH as a rat sighting complaint associated with a specific city address. Rat complaints were distinguished from mouse complaints in these records. Rat species was not listed for any of these reports, though it is assumed that these reports include onlyR. norvegicus.
A planimetric basemap of all NYC recreational public spaces, comprising park property, parks, playgrounds, rinks, courts, fields, ball fields, tracks, cemeteries, and recreational areas, was also obtained from the Open Data Portal (NYC Open Data, 2013b). Hereafter, these recreational public spaces will be collectively referred to simply as “public spaces”. A shapefile of this map was used to identify the polygon area for each of these public spaces. The areas of all public space polygons were subsequently aggregated to the census tract(s) with which they intersected.
A shapefile for the Metropolitan Transportation Authority (MTA) subway system was obtained from the City University of New York Mapping Service at the Center for Urban Research (Romalewski, 2010). The length of each subway line segment (in meters) was aggregated to the census tract(s) with which it intersected.
Census tract data were obtained from two sources. The shapefile for the census tract polygons and the 2010 population count data were retrieved from the US Census Bureau Tiger data source (US Census Bureau, 2014). The proportion of individuals with less than a high school education, high school graduated, and college graduated were obtained from the American Community Survey which is also conducted by the US Census Bureau and provides socioeconomic data at the census tract level. The total number of housing units, proportion of vacant housing units, age distribution of housing structures, housing structure size, and proportion of housing units lacking complete plumbing were also obtained from the American Community Survey. The FactFinder data extraction utility was used to access the American Community Survey data (US Census Bureau).
STATISTICAL ANALYSIS
autocorrelated (Moran I statistic standard deviate=34.5,p<0.00001). Due to the residual spatial correlation structure in the data, this investigation used a Bayesian hierarchical Poisson model for spatial areal unit data. Specifically, a conditional autoregressive (CAR) model was used to represent random effects, with a Besag–York–Mollie (BYM) prior (Besag, York & Molli, 1991). This specification of the CAR modelled the number of rat sightings per census tract as a function of human population size, the proportion of the population with less than a high school education, and several features of the physical landscape: the total number of housing units per census tract, the proportion of vacant units per tract, the proportion of housing structures built prior to 1950 per tract, the proportion of housing structures with five or more family units per tract, the proportion of housing structures lacking complete plumbing facilities per tract, the average distance in meters from each rat sighting to public space and the average distance in meters from each rat sighting to the nearest subway line. The distances between each rat sighting and the nearest public space were measured and summed for all reported rats in each census tract. This sum of the distances was then divided by the total number of reported rats per census tract to give the average distance between sighted rats and public space in each tract. This procedure was repeated for the distances between all reported rats and the nearest subway lines in each census tract to give the average distance between sighted rats and subway lines in each tract. The full CAR model was structured as follows:
ln(Ratsk)=Xkβk+ϕk+ln(Areak)
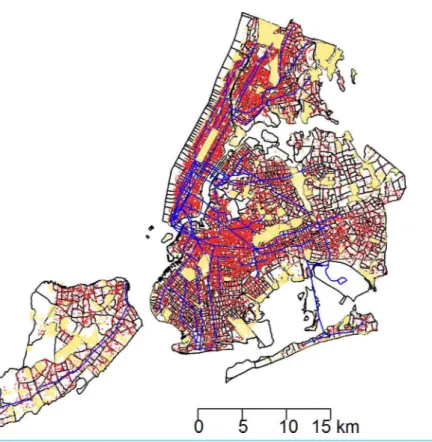
Figure 1 The 43,542 rat sightings reported to the NYC Department of Health and Mental Hygiene are plotted with an overlay of recreational public spaces and subway lines in a map of New York City census tracts.Rat sightings: red points. Recreational public spaces: beige polygons. Subway lines: blue lines.
autocorrelation was present. The R programming language was used for all analysis and mapping procedures (R Development Core Team, 2010). The CAR model was implemented with the CARBayes package (Lee, 2013) using the bymCAR.re() function. The spdep package was used to calculate the global Moran’s index with the moran.test() function and to compute the neighborhood matrix for the CAR model using the nb2mat() function (Bivand, 2009).
RESULTS
Between January 1, 2010 and March 24, 2014, a total of 43,542 rat sightings were reported to the DOHMH from all five of the city’s boroughs.Figure 1presents the map of the individual rat sightings across all census tracts along with public spaces and subway lines.
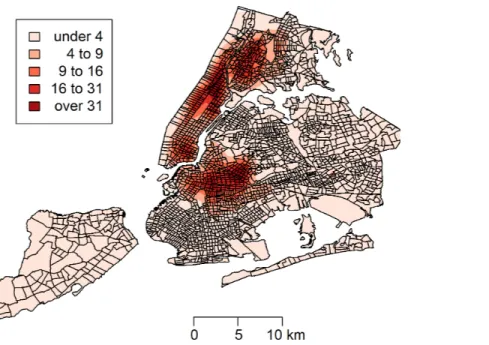
Figure 2 Kernel density estimate (KDE) of rat sightings reported to the New York City Department of Health and Mental Hygiene.The KDE is mapped with New York City census tracts.
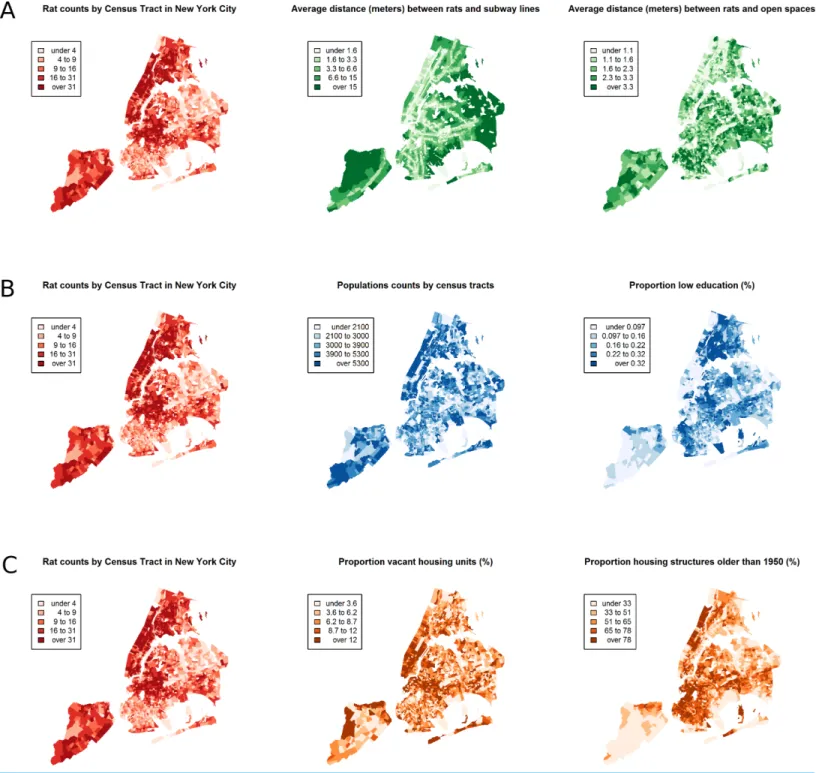
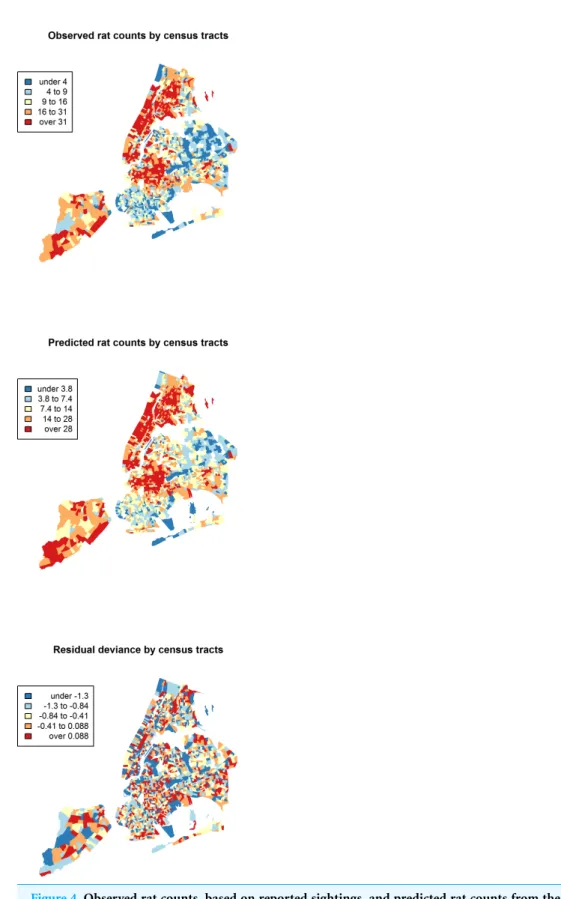
distribution of the average distances from rats to subway lines across census tracts follows the prominent line tunnels of the MTA subway system. Census tracts with shorter average distances between sighted rats and subway lines also tend to have a higher concentration of rats. Interestingly, the distribution of the average distances from rats to public space also shares patterns with the distribution of the concentration of rats, suggesting that closer proximity to public space is also associated with a higher concentration of rats. In addition to these landscape features, high concentrations of rats appear to coincide with high concentrations of vacant housing, old housing, and low education in these maps. Estimates of the rat sighting prevalence ratios (PR) from the CAR model are presented inTable 1along with their associated 95% credible intervals. Both the average distance to subway lines (PR=0.996; 95% CI [0.993–0.998]) and the average distance to public space (PR=0.94; 95% CI [0.91–0.97]) were inversely associated with rat sightings. Each 10 m increase in the average distance from subway lines resulted in a 4% decrease in rat sightings, while each 1 m increase in the average distance from public space corresponded to a 6% decrease in rat sightings. Housing factors were also associated with rat sightings, with each percentage increase in the proportion of vacant housing units corresponding to a 2% increase in rats (PR=1.02; 95% CI [1.018–1.026]) and each 10 percentage point
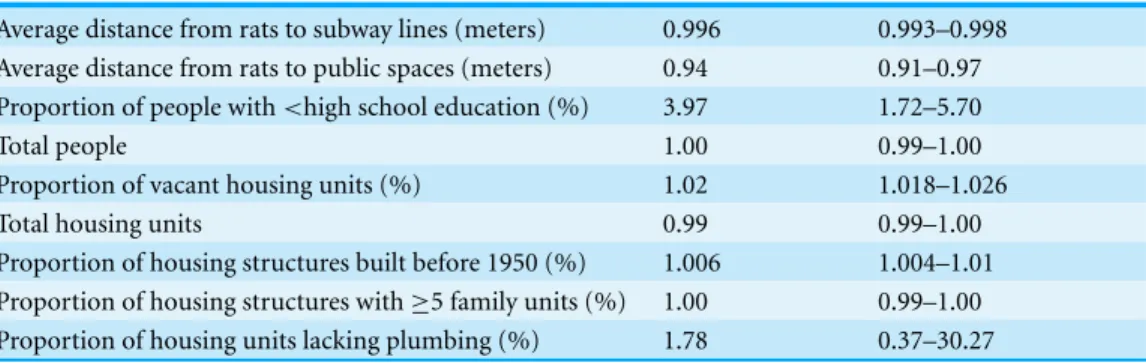
Table 1 Adjusted prevalence ratios for the independent associations between rat sightings and the landscape factors of New York City.The full model is a conditional autoregressive Poisson model, with Besag–York–Mollie priors. Each association between rat sightings and the independent variables are adjusted for the other variables in the model.
Landscape characteristics Prevalence ratio 95% credible interval
Average distance from rats to subway lines (meters) 0.996 0.993–0.998 Average distance from rats to public spaces (meters) 0.94 0.91–0.97 Proportion of people with<high school education (%) 3.97 1.72–5.70
Total people 1.00 0.99–1.00
Proportion of vacant housing units (%) 1.02 1.018–1.026
Total housing units 0.99 0.99–1.00
Proportion of housing structures built before 1950 (%) 1.006 1.004–1.01 Proportion of housing structures with≥5 family units (%) 1.00 0.99–1.00 Proportion of housing units lacking plumbing (%) 1.78 0.37–30.27
for the residual deviance was not significant (Moran’s I statistic standard deviate=0.78,
p-value=0.22), thus confirming statistically the visual interpretation.
DISCUSSION
This study identified areas of high concentrations of rats based on reported sightings in New York City. Closer proximity to subway lines and public spaces was generally found to be associated with a higher concentration of rats, as was a greater presence of older hous-ing, vacant housing units, and low education among the population. These aspects of the physical and social landscape accurately predicted reported rat sightings across the city of New York, and may provide direct targets for reducing contact between humans and rats.
necessary to conduct borough-specific analyses. Indeed, none of the significant city-wide associations were also observed for every borough individually. Second, the case-control study did not account for the potential spatial heterogeneity in their logistic regression model. Nevertheless, this previous case-control study represents the most substantive exploration of the landscape epidemiology of human–rodent encounters, as measured by rodent bites, in any major US city prior to this current investigation. Interestingly, despite different measures of the human-rodent interaction outcome (rodent bites vs. rat sight-ings) and a different accounting of the spatial dynamics of these encounters, the current investigation still identified many of the same landscape features identified previously. However, given the much larger sample size and less restrictive outcome classification, the current findings provide more substantive support for specific features of the landscape that may be relevant for the implementation of rodent control in unique contexts.
There are some important limitations attending this investigation that should be given fair consideration when interpreting the results. First, the rat counts reported here were not obtained directly through bait traps or official agency inspection of rat signs at specific locations throughout the city. Instead, all rat sightings were determined by self-report through the capture of official complaints filed with the NYC DOHMH. Therefore, there may be some measurement error in the outcome. In particular, some of the reports may be misclassified as rats, when in fact the animal sighted was a mouse. However, it is likely that such misclassification would underestimate, rather than overestimate, the true number of rat encounters for the following reason. Adult brown rats are much larger than, and quite distinct from, the common house mouse (Mus musculus). Confusion may arise between the two rodents when considering rat pups, which may be confused for mice. In this scenario the rat pups may be mistakenly reported as mice rather than rats. On the other hand, house mice are quite small even as adults and unlikely to be mistaken for rats. As such, where it exists, we would expect reporting error to more frequently reflect young rats mistaken to be mice, rather than mice mistaken to be rats, which would tend to underestimate the number of human–rat encounters.
Another limitation is the census-level aggregate data. The address and geographic coordinates were recorded for each reported rat sighting, which would allow for the highest possible resolution in the spatial analysis. However, this scale was not available for any of the population-level data, thus requiring aggregation of the data at the census tract. The smaller scale of the census tract is necessarily more coarse than the larger scale observed at the level of the individual household and therefore may miss more nuanced features of rat ecology that are relevant to their encounters with humans. Nevertheless, the census tract does provide a relatively accurate description of neighborhood features that are specific to the local social and physical landscape. As such the current investigation was able to assess the relationship between rat sightings and neighborhood housing character, sociodemographics, and public space in sufficiently fine spatial scale to quantify the spatial variation across NYC.
Finally, the CAR model may have moderately underpredicted rat counts in some NYC census tracts. While there was no spatial pattern to residual deviance as noted above (Fig. 4), there was a slight preponderance of residuals with negative values. Nevertheless, the density of the residuals demonstrated a distribution reasonably centered close to zero. As such, a large bias toward underprediction is not expected, but some individual census tracts may present with a larger number of rat sightings than predicted. Future studies that measure rat presence directly will help to refine this model.
CONCLUSIONS
ADDITIONAL INFORMATION AND DECLARATIONS
Funding
This study received no funding.
Competing Interests
The author declares there are no competing interests.
Author Contributions
• Michael G. Walsh analyzed the data, wrote the paper, prepared figures and/or tables,
reviewed drafts of the paper.
Supplemental Information
Supplemental information for this article can be found online athttp://dx.doi.org/ 10.7717/peerj.533#supplemental-information.
REFERENCES
Besag J, York J, Molli A. 1991.Bayesian image restoration, with two applications in spatial statistics.Annals of the Institute of Statistical Mathematics43(1):1–20DOI 10.1007/BF00116466. Bivand R. 2009.The spdep Package.Available atftp://ctm2.tw.freebsd.org/pub/languages/CRAN/
web/packages/spdep/spdep.pdf.
Brunsdon C, Chen H. 2012.Documentation for package “GISTools” version 0.7-1.Available at http://127.0.0.1:23595/library/GISTools/html/00Index.html.
Childs JE, McLafferty SL, Sadek R, Miller GL, Khan AS, DuPree ER, Advani R, Mills JN, Glass GE. 1998.Epidemiology of rodent bites and prediction of rat infestation in New York City.American Journal of Epidemiology148(1):78–87DOI 10.1093/oxfordjournals.aje.a009563. Clinton JM. 1969.Rats in urban America.Public Health Reports84(1):1–7
DOI 10.2307/4593484.
Comer JA, Diaz T, Vlahov D, Monterroso E, Childs JE. 2001.Evidence of rodent-associated Bartonella and Rickettsia infections among intravenous drug users from Central and East Harlem, New York City.The American Journal of Tropical Medicine and Hygiene65(6):855–860 http://www.ncbi.nlm.nih.gov/pubmed/11791987.
Davis DE. 1953.The characteristics of rat populations.The Quarterly Review of Biology 28(4):373–401DOI 10.1086/399860.
Easterbrook JD, Kaplan JB, Vanasco NB, Reeves WK, Purcell RH, Kosoy MY, Glass GE, Watson J, Klein SL. 2007. A survey of zoonotic pathogens carried by Norway rats in Baltimore, Maryland, USA. Epidemiology and Infection 135(7):1192–1199 DOI 10.1017/S0950268806007746.
Gundi VAKB, Billeter SA, Rood MP, Kosoy MY. 2012.Bartonella spp. in rats and zoonoses, Los Angeles, California, USA.Emerging Infectious Diseases18(4):631–633
DOI 10.3201/eid1804.110816.
Himsworth CG, Parsons KL, Jardine C, Patrick DM. 2013.Rats, cities, people, and pathogens: a systematic review and narrative synthesis of literature regarding the ecology of
rat-associated zoonoses in urban centers.Vector-Borne and Zoonotic Diseases13(6):349–359 DOI 10.1089/vbz.2012.1195.
Lapuz RRSP, Umali DV, Suzuki T, Shirota K, Katoh H. 2012.Comparison of the prevalence of Salmonella infection in layer hens from commercial layer farms with high and low rodent densities.Avian Diseases56(1):29–34DOI 10.1637/9704-030711-Reg.1.
Lee D. 2013.CARBayes: an R Package for bayesian spatial modeling with conditional autoregressive priors.Journal of Statistical Software55(13):1–24.
NYC Department of Health and Mental Hygiene. 2008.Zoonotic and Vector-borne Public Health Newsletter 4(1).Available athttp://www.nyc.gov/html/doh/downloads/pdf/zoo/ zoo-newsletter-2008-v4n1.pdf.
NYC Department of Health and Mental Hygiene. 2011.Zoonotic and Vector-borne Public Health Newsletter 7(1).Available athttp://www.nyc.gov/html/doh/downloads/pdf/zoo/ zoo-newsletter-2011-v7n1.pdf.
NYC Open Data. 2013a.Rat Sightings.Available athttps://data.cityofnewyork.us/Social-Services/ Rat-Sightings/3q43-55fe.
NYC Open Data. 2013b.Data Catalog.Available athttps://data.cityofnewyork.us/data.
Purcell RH, Engle RE, Rood MP, Kabrane-Lazizi Y, Nguyen HT, Govindarajan S, St Claire M, Emerson SU. 2011.Hepatitis E virus in rats, Los Angeles, California, USA.Emerging Infectious Diseases17(12):2216–2222DOI 10.3201/eid1712.110482.
R Development Core Team. 2010.R: a language and environment for statistical computing. Vienna: the R Foundation for Statistical Computing.Available athttp://www.R-project.org/.
Romalewski S. 2010.MTA subway data in GIS format. Spatiality. [Blog post].Available athttp:// spatialityblog.com/2010/07/08/mta-gis-data-update/.
Sullivan R. 2008.Rats: observations on the history & habitat of the city’s most unwanted inhabitants. New York: Bloomsbury Publishing.Available athttp://books.google.com/books? id=7ULxMW8nfPMC&pgis=1.
Swanson SJ, Snider C, Braden CR, Boxrud D, W¨unschmann A, RudroffJA, Lockett J, Smith KE. 2007.Multidrug-resistant Salmonella enterica serotype Typhimurium associated with pet rodents.The New England Journal of Medicine356(1):21–28DOI 10.1056/NEJMoa060465. US Census Bureau. 2014.Geography: TIGER Products.Available athttp://www.census.gov/geo/
maps-data/data/tiger.html.
US Census Bureau.American FactFinder — Search.Available athttp://factfinder2.census.gov/faces/ nav/jsf/pages/searchresults.xhtml?refresh=t.
Venables WN, Ripley BD. 2002.Modern applied statistics with S. New York: Springer, 126–131 Available athttp://books.google.com/books?hl=en&lr=&id=974c4vKurNkC&pgis=1.
Vinetz JM, Glass GE, Flexner CE, Mueller P, Kaslow DC. 1996.Sporadic urban leptospirosis. An-nals of Internal Medicine125(10):794–798DOI 10.7326/0003-4819-125-10-199611150-00002. Yokoyama E, Maruyama S, Kabeya H, Hara S, Sata S, Kuroki T, Yamamoto T. 2007.Prevalence