Boar and Wild Boar
Snežana D. Ivanović1, Zoran M. Stojanović2
, Jovanka V. Popov-Raljic3, Milan Ž. Baltić4, Boris P. Pisinov1,
Ksenija D. Nešić1 1
Scientific Veterinary Institute of Serbia, Belgrade, Serbia 2
Serbian Environmental Protection Agency SEPA, Belgrade, Serbia 3
Faculty of Agriculture, Zemun, Serbia 4
Faculty of Veterinary Medicine, University of Belgrade, Belgrade, Serbia
Abstract
Chemical composition, pH value, fatty acids profile, cholesterol content, color and sensory analysis of pork meat from DurocYorkshire (DY), DurocYorkshirewild boar (DYWB) crossbreeds and wild boars (WB) was investigated. Samples for all tests were taken from m. longissimus dorsi. The chemical composition and pH value were tested by ISO methods. Fatty acid and cholesterol determination was performed by gas chromatography with external standard. The color was determined instrumentally using the thristimulus colouri-meter. The overall sensory quality (appearance, texture and smell) of samples of raw meat was evaluated. A scoring system was used in the evaluation of the results. Statistically significant differences (p < 0.05) were found in the chemical composition (moisture, fat, protein and ash) and pH values between each of the examined groups, as well as fatty acids and cholesterol content among all the examined groups. Measurments of the colour of meat from all three groups showed that the L*, a*, b*, Chroma and Hue angle were also statistically significantly different (p < 0.01)
Keywords: meat quality, Duroc, Yorkshire, wild boar.
PROFESSIONAL PAPER
UDC 637.5'64.05
Hem. Ind.67 (6) 999–1006 (2013)
doi: 10.2298/HEMIND121211017I
Available online at the Journal website: http://www.ache.org.rs/HI/
The quality of pork meat includes different aspects: technological (water holding capacity, pH, intensity and homogeneity of colour, firmness and processing yield), chemical (protein, fat, fatty acids profile and content of cholesterol, conjugated linoleic acid, vitamins and minerals) and sensory (colour, marbling, tenderness, juiciness and flavour). These aspects are influenced by many factors before and after the slaughtering.
The pH value in the muscle after slaughtering is the main factor that affects the meat colour, water holding capacity of binding water, water loss during cooking, processing yield, etc. Rapid acidification of muscle proteins leads to their denaturation and some irregular metabolic processes [1]. The proximate composition and intramuscular fat content are important factors that affect the meat quality and nutritional value. The proximate composition of meat depends on many factors, such as the anatomic region, type of muscle fibres and condition of animal, breed and diet. There are many differences in the fatty acid composition of meat and adipose tissue between various kinds of animals. In pigs, the adipose tissue has a higher content of fat than meat, but the fatty acid composition is
Correspondence: S. I a o ić, Scientific Veterinary Institute of Serbia, Autoput 3, 11070 Belgrade, Serbia.
E-mail: snezaivanovic@gmail.com Paper received: 11 December, 2012 Paper accepted: 22 February, 2013
similar as in meat [2]. The content of linoleic acid is higher in tissues of pigs than in tissues of cattle and small ruminants. Linoleic acid originates primarily from the feed. It passes unchanged through the intestines of pigs, then through blood vessels, and is finally incur-porated into the tissue. Different fatty acid compo-sition in meat can be achieved by adding some fatty acids in feed mixtures or using feedstuffs that have higher content of -3 fatty acids, such as linen seed. The recommended relation between all polyunsatu-rated and satupolyunsatu-rated fatty acids in nutrition is 0.4 or higher, and it is higher in pigs than in ruminants [2]. Selection of pigs in recent decades has mostly been focused on production of large amount of lean meat. New genetic lines deposit less fat in the body and they have less live weight than traditional breeds. To this aim, in modern pig breeding Duroc pigs are chosen because of suitable intramuscular fat content [3,4].
The sensory perception of meat depends on many factors, such as the characteristics of the breed, weight, sex, diet and the biochemical changes that occur during further processing, slaughtering, maturation, heat treatment and cooking [7]. The eating pork quality, evaluated as sensory perceptions during consumption, consists of several attributes. Among the most impor-tant are tenderness, juiciness, flavour and absence of off-flavours [8]. In the case of raw meat bought by consumers for house consumption, the significant traits are the amount of visible fat and colour [9].
The aim of this paper was to investigate if there were any statistically significant differences between chemical composition and pH value, fatty acid compo-sition, cholesterol content, colour and sensory charac-teristics of pork meat originating from DurocYorkshire (DY), DurocYorkshirewild boar (DYWB) and wild boars (WB).
MATERIALS AND METHODS
A total of 60 pigs were used for the trial: 20 cas-trated males DurocYorkshire (DY), 20 castrated males DurocYorkshirewild boar (first generation crossed pig DurocYorkshire with wild boar) (DYWB) and samples collected from 20 shot wild boars (WB). Pigs were bred under the same conditions and fed with the same standard diet adequate for their category. Breeding of pigs was under all hygienic and zootech-nical conditions. The animals were slaughtered at final live weight that was in the range 96–112 kg.
Wild boars weighed between 140 to 150 kg and aged about one year. The hunting ground is located in the south est a d southeast egio Šu adija, “e ia. These are primarily habitats of steppe and steppe forest vegetation, which predominates in deciduous trees – oak, elm, linden, chestnut and hazel. The dominating herbaceous species are Graminaceae, Aste-raceae and Poaceae, and the representative cereals are corn, wheat and barley [10].
The material used for the determination of chemi-cal composition, fatty acids and cholesterol content was m. longissimus dorsi from the left side of the halves. For colour measurement, the same muscle from the right side of halves was used. Protein content was calculated from nitrogen content multiplied by 6.25 using relevant ISO standards [11]. The fat content was determined according to relevant ISO standards [12], as well as moisture content [13], ash content [14] and pH value [15]. Chemical parameters and pH were mea-sured in the meat 24 h after slaughter. The Folch–Lees method [16] was applied for the lipid extraction from the tissue. After the lipid hydrolysis, the fatty acids were esterified to methyl esters, evaporated to dryness in a stream of nitrogen and stored at –18 C. Analysis of FAMEs and cholesterol was performed by an external
standard method using a gas chromatograph (GC6890N, Agilent Tech., USA) by comparing with standard mix of FAMEs 37 (Supelco, USA).
The colour was measured on the fresh meat cuts of the m. longissimus dorsi pars lumborum, from the right side of each carcass (n = 20, two times, for each sample). CIE L*a*b* and CIEYxy colour coordinates [17] were determined using a Minolta chromameter CR-400 (Minolta Co Ltd., Osaka, Japan) in D-65 lighting, with a standard angle of 2 of shelter and 8 mm aperture of the measuring head. In CIE L*a*b* results were given as the mean values: L* – psychometer light, a* – psy-chometer tone, b* – psychometer chroma, hue angle and chroma.
The overall sensory quality (appearance, texture and smell) of all samples of raw meat from DY, DYWB and WB was evaluated. A scoring range of 1.00 to 5.00 was used, with the possibility of assigning half- and quarter-points. For each selected quality cha-racteristic the coefficient of importance (CI) was determined, which was used for the correction (multi-plication) of given ratings.The coefficients were chosen according to the importance of effect of individual characteristics on the overall quality, and balanced so that their sum was 20. Addition of individual scores gave us a complex indicator that represented the o e all se so ualit a d as e p essed as pe e -tage of the a i u possi le ualit . Dividing that value by the sum of the coefficients obtained by weighted importance mean score, which also repre-sented the overall sensory quality of raw meat samples DY, DYWB and WB. Rating: 1.00 – very pronounced errors, 2.00 – pronounced errors, 3.00 – noticeable deviations, 4.00–5.00 and slight differences – fully meets the requirements for quality. In evaluation of sensory characteristics of raw meat quality DY, DYWB and WB [18], 20 experienced tasters were involved [19,20].
Data obtained in investigations were analysed by descriptive and analytical statistics, using Microsoft Excel 2003, ANOVA and the differences between two averages were compared by the t-test at the level of significance of 99% and 95%.
RESULTS
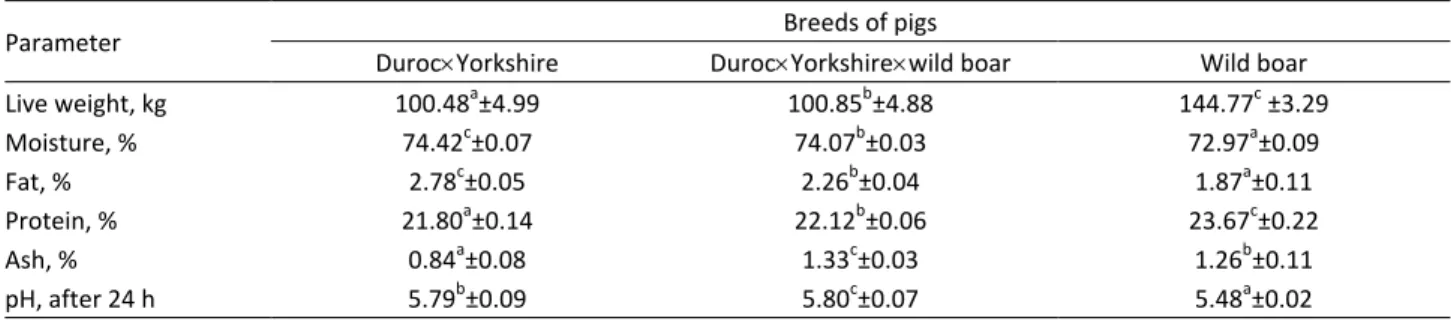
The results obtained during the investigation relat-ing live animal weight, chemical composition and pH value of pork meat are shown in Table 1.
for average proteins values and the average ash mean. The pH value of DY meat did not differ (P > 0.05) from DYWB meat, while the pH value of WB meat was significantly lower than DY meat and DYWB meat (P < 0.05).
Results of examination of fatty acid composition and cholesterol content in pork from three groups DY, DYWB and WB are presented in Table 2. This table shows that there were differences between all mutually compared groups (P < 0.05).
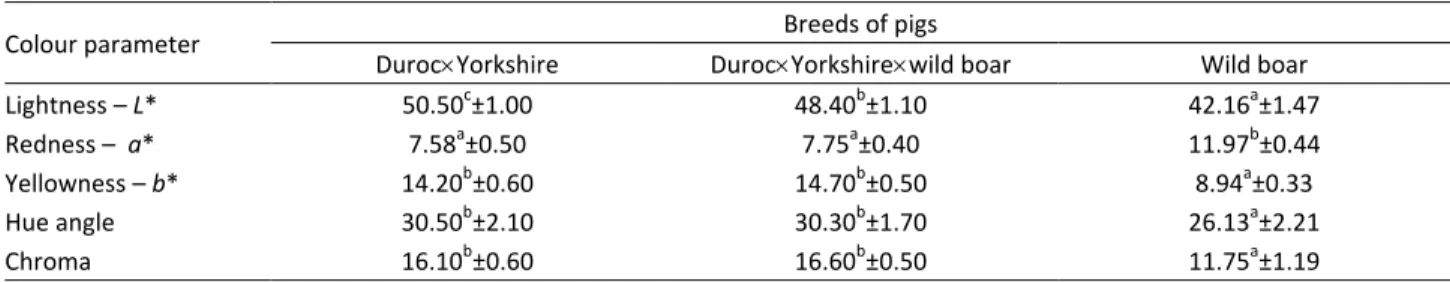
Instrumentally measured values regarding the col-our characteristics of meat samples, expressed in CIE L*a*b* system for three groups are presented in Table 3. For the values obtained for lightness of meat (L*) between all mutually compared groups there were dif-ferences (P < 0.01). Regarding redness of meat (a*) the WB meat differed (P < 0.01) from DY meat and DYWB meat, while DY meat did not differ (P > 0.01) from DYWB. Regarding obtained values for yellow-ness of meat (b*) the WB meat differed (P < 0.01) from DY meat and DYWB meat, while DY meat did not differ (P > 0.01) from DYWB meat.For the hue angle, the WB meat differed (P < 0.01) from DY meat and DYWB meat, but DY meat did not differ (P > 0.01) from DYWB meat. The obtained chroma values in WB meat differed (P < 0.01) from DY meat and
DYWB meat, while in DY meat did not differ (P > 0.01) from DYWB meat.
Based on sensory estimation of appearance, i.e., colour and surface of raw meat pieces from different breeds of pigs (visual technique), it is evident that the greatest number of points was obtained from DYWB sample (20±0.25), and it had a peculiar colour. Then follows a DY sample (18.80±0.28), which was slightly darker than the previous sample. The sample with the lowest number of points for colour as appearance and size, was a sample of WB meat (18.00±0.28) (Table 4). Generally speaking, those were minor differences in shades, i.e., surface brightness, among different kinds of raw pork pieces, but still visually characterized by highl e pe ie ed a d t ai ed taste s as o ditio al different, but characteristic shades of colour. This observation is in accordance to results of instrumental colour determination, the same samples of pig raw meat, measured by the Minolta CR-400 chromameter (Table 3).
For the sample DY by visual technique character-istic, uniform distribution of muscle fibers at the inter-section of pig meat was reported (14.00±0.25), and the corresponding characteristic hardness (15.00±0.23), evaluated by palpatory technique. Practically, for the textural properties samples of DYWB raw meat Table 1. Live animal weight, chemical composition and pH value of the m. longissimus dorsi in DurocYorkshire,
DurocYorkshirewild boar and wild boar (n = 20); a,b,c – row means with different superscripts differ significantly at P < 0.05
Parameter Breeds of pigs
DurocYorkshire DurocYorkshirewild boar Wild boar
Live weight, kg 100.48a±4.99 100.85b±4.88 144.77c ±3.29
Moisture, % 74.42c±0.07 74.07b±0.03 72.97a±0.09
Fat, % 2.78c±0.05 2.26b±0.04 1.87a±0.11
Protein, % 21.80a±0.14 22.12b±0.06 23.67c±0.22
Ash, % 0.84a±0.08 1.33c±0.03 1.26b±0.11
pH, after 24 h 5.79b±0.09 5.80c±0.07 5.48a±0.02
Table 2. Fatty acid composition and cholesterol of the m. longissimus dorsi of DurocYorkshire, DurocYorkshirewild boar and wild boar (n = 20); a,b,c – row means with different superscripts differ significantly at P < 0.05
FAME
(% of total fatty acids)
Breeds of pigs
DurocYorkshire DurocYorkshirewild boar Wild boar
Myristic acid (C14:0) 1.53a±0.02 2.40b±0.03 3.01c±0.51
Palmitic acid (C16:0) 25.55a±0.09 30.34b±0.41 33.20c±0.30
Palmitoleic acid (C16:1) 2.69c±0.07 1.76b±0,03 0.65a±0.01
Stearic acid (C18:0) 14.29a±0.20 19.08b±0.16 21.97c±0.13
Oleic acid (C18:1) 43.18c±0.29 40.01b±0.20 36.15a±0.12
Linoleic acid (C18:2) 9.28c ±1.64 5.17b±0.03 3.29a±0.02
SFA 41.37 51.82 58.18
USFA 55.15 46.94 40.09
USFA/SFA 1.33 0.91 0.69
(12.50±0.18) and samples of raw WB meat (12.50±0.16) were evaluated with the same score (Table 4). Our results of sensory evaluation of smell of raw meat from different breeds of pigs clearly show that meat of WB had very peculiar, stable odour intensity (48.50±0.20), then the characteristic smell of DYWB meat (47.50±0.13), and slightly lower, but still characteristic odour intensity of DY meat (46.00±0.32) (Table 4).
So we could surely say that from the sensory point (assessing odour), the highest quality was found for the meat of wild boar. The percentage of the maximum score for all evaluated characteristics, as well as the weighted mean value of ratings is shown in Table 4. Based on the total number of points that is high sen-sory quality, the order would be as follows: DY (93.80/ /4.69), DYWB (92.00/4.60) and WB (92.0/4.50).
DISCUSSION
For DY and DYWB meat, the chemical compo-sition depends on the diet, race, manner of holding and other factors. According to Pierson [21], fats are the basic ingredient for the perception of taste in the meat, as it is characteristic for the taste of meat of different animal species.Kim et al. [22] in their research showed
that the chemical composition is not the same in all muscles of pig carcass. They investigated 21 muscles. The muscle longissimus dorsi is very interesting for comparison with our results. According to these authors, the percentage of water was 75.51%, protein 21.79%, fat 2.02% and ash 0.99%. Our results were not in agreement with the results of these authors. Jukna and Jukna [23] have also investigated the chemical composition of m. longissimus dorsi from different pig breeds. We can compare the findings with the chemical composition of m. longissimus dorsi Yorkshire. Our results for water, protein and ash in the first two test groups were similar with the findings of these authors (water 74.91%, protein 22.39% and ash 1.09%), while the fat was different (1.61%). Oliver et al. [3] studied the chemical composition of m. longissimus dorsi of five different crossbreeds, which included Duroc (DU), Landrace (LR), Large White (LW) and Belgian Landrace (BL). In our research, obtained values for water, fat, protein and ash in the first two test groups were the closest to the authors who got the breed DU(LRLW). Their findings were 74.12% of water, fat 1.88% and 22.51% of protein. Jacyno et al. [24] studied chemical composition in m. longissimus dorsi of fleshy pigs: water 72.70%, 23.50% protein, 2.79% intramuscular Table 3. Colour parameters of the m. longissimus dorsi of DurocYorkshire, Durocwild boar and wild boar expressed in CIE L*a*b* system (n = 20); a,b,c – row means with different superscripts differ significantly at P < 0.05
Colour parameter Breeds of pigs
DurocYorkshire DurocYorkshirewild boar Wild boar
Lightness – L* 50.50c±1.00 48.40b±1.10 42.16a±1.47
Redness – a* 7.58a±0.50 7.75a±0.40 11.97b±0.44
Yellowness – b* 14.20b±0.60 14.70b±0.50 8.94a±0.33
Hue angle 30.50b±2.10 30.30b±1.70 26.13a±2.21
Chroma 16.10b±0.60 16.60b±0.50 11.75a±1.19
Table 4. Sensory evaluation of pigs meat
Breeds of pigs
Attribute
Percentage of maximal possible
quality 100
Weighted average
100/20
Appearance Texture Flavour
Colour surface Visual evaluated structure
Palpatory evaluated firmness
Olfactory evaluated odour Coefficient of importance
4 3 3 10
DurocYorkshire M 18.80 14.00 15.00 46.00 93.80 4.69
Sd 0.28 0.25 0.23 0.32
Cv 1.47 1.76 1.51 0.71
DurocYorkshire
wild boar
M 20.00 12.50 12.00 47.50 92.00 4.60
Sd 0.25 0.18 0.18 0.13
Cv 1.27 1.42 1.42 0.28
Wild boar M 18.00 12.50 11.00 48.50 90.00 4.50
Sd 0.28 0.16 0.39 0.20
fat. The results of these authors concerning the content of water and protein are not in agreement with our results, while the content of intramuscular masses is in line. Our results regarding fat approximate the findings of Václavková a d Bečko á [25], who examined the effects of various additives on the chemical compo-sition of the m. longissimus dorsi of crossbreed (Czech Large WhiteCzech Landrace)(HampshirePietrain). Our findings of fat content in m. longissimus dorsi of DurocYorkshire (DY) and DurocYorkshirewild boar (DYWB) were similar to the findings of fat in m. lon-gissimus dorsi of the control group (2.10±0.40 %) which was regularly fed. However, our results of intramus-cular fat were different from the findings (1.6±0.4) of Simek et al. [26]. The same authors have determined the pH values in all lines after 24 h. The values ranged from 5.6±0.1 to 5.7±0.2, and were in accordance with the values that we noted 24 h after, by measuring samples DY (5.79±0.09) and the DYWB (5.80±0.07). Kasprzyk et al. [27] measured the pH value of the crossed (HampshireWild boar) after 24 h from the time of slaughter 5.75±0.22, which is consistent with our results for pH values of DYWB (5.80±0.07). The same authors measured the Pulawska line (5.41±0.25), which was lower value than we had got in DY (5.79±0.09).
Václavková a d Bečko á [25] in the same experi-ment examined the prevalence of specific fatty acids. Their findings for myristic C14: 0 (1.29±0.17), palmitic C16: 0 (24.44±1.08), stearic C18: 0 (12.78±0.52), oleic C18: 1 (40.40±1.53) and linoleic acid C18: 2 (1.77±7.53) in a control group of pigs that were given standard feed, as our pigs in the first two groups, did not agree with our findings (Table 3). This probably happened as a result of different races. Wood et al. [4] studied the effect of keeping and feeding on fat deposition in cle and presence of some fatty acids in different mus-cles. They investigated the composition of m. longis-simus dorsi of Berkshire and Tamworth, Large White and Duroc line. We can compare our results from first two groups with their findings relating to the control group Duroc line that received standard feed. Their findings for myristic C14: 0 (1.59), palmitic C16: 0 (23.85), stearic C18: 0 (15.56), oleic C18: 1 (36.17), and linoleic acid C18: 2 (12.02) were significantly different from our findings, which again indicates the influence of race on the fatty acid composition of individual mus-cles. Furman et al. [28] examined the commercial fat, meat-type pigs (hybrid Large WhiteSlovenian Land-race mated by Pietrain, Duroc or PiertainSlovenian Landrace) and normal fatty acid composition of m. longissimus dorsi. Their findings of myristic C14: 0 (1.22), palmitic C16: 0 (22.55), palmitoleic acid C16: 1 (3.23), stearic C18: 0 (11.49), oleic acid C18: 1 (40.21) and linoleic acid C18: 2 (12.75) were also significantly
different from our results concerning the first two groups of pigs (DurocYorkshire and Duroc York-shirewild boar). Jacyno et al. (2006) studied fatty acid composition in m. longissimus dorsi of fleshy pigs. Their findings for myristic C14: 0 (1.29), palmitic C16: 0 (22.95), palmitoleic acid C16: 1 (4.63), stearic C18: 0 (11.50), oleic acid C18: 1 (44.27) and linoleic acid C18: 2 (10.26) were not in accordance with our results. The finding by the same authors for total cholesterol was 63.2 mg/100 g which was not in agreement with our findings (59.80±0.62 mg/100 g and 51.00±0.55 mg/100 g).
Marchiori et al. [29] instrumentally measured the colour of m. longissimus dorsi in pigs that were grown under controlled conditions. L* values (59.00±2.72), a* (7.65±1.43), b* (16:38±0.79) were measured after 48 h from the time of slaughter. L* values were higher than ours (Table 4), indicating that their meat was lighter on the surface in relation to our first two groups. Oliver et al. [3] studied the colour of m. longissimus dorsi from five different crossbreeds, which included Duroc (DU), Landrace (LR), Large White (LW) and Belgian Landrace (BL). The measured values for meat of Duroc were: L* (54.06±0.60), a* (7.55±0.32), b* (6.48±0.27). L* values were higher than ours (Table 4), indicating that their meat was lighter than ours in the first two groups. On the other hand, colour of meat, measured after seven days, from m. longissimus lumbrorum taken from the slaughtered pig breeds Large White Landrace [30] was darker (L* 45.9, a* 9.3, b* 8.1) than meat from our first two groups (Table 3).
For wild boar, Postolache et al. [31] investigated the chemical composition of m. longissimus dorsi in shot wild pigs in Romania, aged 3–4 years. Their findings were 75.36% for water, 21.81% for protein, fat 2.58%, and the pH value measured after 24 h (post mortem) was 5.56. Results regarding water, proteins and fats were not in agreement with our results, while the pH value was in accordance with our findings. That diffe-rence can be explained by a different diet and different age. With respect to pH value in the wild boars meat, our results (5.48±0.02) were consistent with the results (5.46±0.14) from Marchiori et al. [27], but the pH value of our measurements was the lower from pH values (5.80±0.18) that were measured by Kasprzyk et al. [26]. Quaresma et al. [32] examined intramuscular lipids, cholesterol and fatty acid composition in major muscle of shot wild boars in Portugal. They found that the fat content was 4.75%, cholesterol 58.7 mg/100 g, fatty acid – myristic C14:0 (1.00), palmitic C16:0 (20.70), pal-mitoleic acid C16:1 (2.20) stearic C18:0 (10.50), oleic acid C18:1 (39.70) and linoleic C18:2 (15.90). Our results were consistent with the results of these authors.
(49.00±3.48), a* (9.50±1.46), b* (12.99±1.33) were measured after 48 h of the moment of slaughter. L* value was higher than ours (Table 4), suggesting that their wild boars meat was lighter than ours.
It is difficult to compare the results of sensory anal-ysis between different authors. It is also difficult to compare different techniques. But, our results can be compared with the results of Kasprzyk et al. [26]. These authors evaluated Pulawska meat, wild boar and Pulawska(HampshireWild boar). In meat of those wild boars authors received the lowest rating, while the meat of the cross-breed got a perfect score. Morrison et al. [33] investigated the effect of different cultivation methods on sensory qualities. Evaluation was carried out by panel test. The scores varied slightly, but did not differ (P > 0.05) in tenderness, juiciness, pork flavour or overall desirability of pork produced from the two housing treatments. The results of Morrison et al. [33] were similar to ours. Although our results have got slight differences in the sensory evaluation of appearance, they did not affect the acceptability of meat.
CONCLUSIONS
1. Based on the obtained results, it can be con-cluded that there was a statistically significant diffe-rence (P < 0.05) between all three groups in the average water content, total fat, average protein value and ash content. Regarding live weight and pH values there was no statistically significant difference (P > 0.05) between DY and DYWB, while it was noted between DY and WB, as well as between DYWB and WB (P < 0.05).
2. According to the obtained results regarding fatty acids profile and cholesterol content there was a statistically significant difference (P < 0.05) between all three groups.
3. By instrumental measurements of the colour characteristics of meat samples it can be concluded that for L* there was a statistically significant diffe-rence (P < 0.05) between all three groups. But, regard-ing a*, b*, hue angle and chroma there was no statis-tically significant difference (P > 0.05) between DY and DYWB, while however it was noted between DY and WB, as well as between DYWB and WB (P < < 0.05).
Based on the total number of points, i.e., mean sensory quality score, the order would be as follows: DY (93.80/4.69), DYWB (92.00/4.60) and WB (92.0/4.50).
REFERENCES
[1] P. Sellier, G. Monin, Genetics of pig meat quality, A review J. Muscle Foods 5 (1994) 187.
[2] J.D. Wood, M. Enser, A.V. Fisher, G.R. Nute, P.R. Sheard, R.I. Richardson, S.I. Hughes, F.M. Whittington, Fat depo-sition, fatty acid composition and meat quality, A review, Meat Sci. 78 (2008) 343–358.
[3] M.A. Oliver, P. Gou, M. Gispert, A. Diestre, J. Arnau, J.L. Noguera, A. Blasco, Comparison of five types of pig crosses. Ll. Fresh meat quality and sensory character-istics of dry cured ham, Livest. Prod. Sci. 40 (1994) 179–
–185.
[4] J.D. Wood, G.R. Nute, R.I. Richardson, F.M. Whittington, O. Southwood, G. Plastow, R. Mansbridge, N. da Costa, K.C. Chang, Effects of breed diet and muscle on fat deposition and eating quality in pigs, Meat Sci. 67 (2004) 651–667.
[5] I.K. Vukovic, The basics of meat technology (2nd ed.). Veterinary Chamber of Serbia, Belgrade, Serbia, 1998. [6] USDA, The Color of Meat and Poultry, Food Safety and
Inspection Service, Washington D.C., USA, 2008. Available at: http://www.fsis.usda.gov
[7] M. Flores, E. Armero, M.C. Aristoy, F. Toldrá, Sensory characteristics of cooked pork loin as affected by nucleotide content and post mortem meat quality, Meat Sci. 51 (1999) 53–59.
[8] E.A. Bryhni, D.V. Byrne, M. Rodbotten, Consumer and sensory investigations in relation to physical/chemical aspects of cooked pork in Scandinavia, Meat Sci. 65
(2003) 737–748.
[9] Resurreccion AVA, Sensory aspects of consumer choices for meat and meat products, Meat Sci. 66 (2004) 11–20. [10] S. Jovano ić, “i ekologi al a d flo isti stud of ude al
vegetation on Belgrade region. DPh. thesis, University of Belgrade, Belgrade, Serbia, 1992.
[11] ISO 937 (1992), Meat and meat products - Determination of nitrogen content. International Organization for Standardization, Geneva, Switzerland. [12] ISO 1443 (1992), Meat and meat products –
Deter-mination of total fat content. International Organization for Standardization, Geneva, Switzerland.
[13] ISO 1442 (1998), Meat and meat products – Deter-mination of moisture content. International Organiza-tion for StandardizaOrganiza-tion, Geneva, Switzerland.
[14] ISO 936 (1999), Meat and meat products – Determi-nation of total ash. InterDetermi-national Organization for Stan-dardization, Geneva, Switzerland.
[15] ISO 2917 (2004), Meat and meat products – Measu-rement of pH, Reference method. International Organi-zation for StandardiOrgani-zation, Geneva, Switzerland. [16] J. Folch, M. Lees, G.H.S. Stanley, Eine einfache Methode
zur Isolierung und Reinigung der Lipide aus tierisch Gewebe, J. Biol. Chem. 226 (1957) 497–509.
[17] CIE Colorimetry Committee, Technical notes: working program on colour differences, J. Opt. Soc. Am. 64
(1986) 896–897.
[18] ISO 5492 (2000), Sensory analysis – Vocabulary. Interna-tional Organization for Standardization, Geneva, Switz-erland.
International Organization for Standardization, Geneva, Switzerland.
[20] ISO 8586-2 (1994,) Sensory analysis-General guidance for the selection,training and monitoring of assessors – Part 2. International Organization for Standardization, Geneva, Switzerland.
[21] A.M. Pearson, T.A. Gillett, Processed meat (3rd ed.), Aspen Publisher Inc., Gaithersburg, ML, 1999.
[22] H.J. Kim, N.P. Seong, H.S. Cho, Y.B. Park, H.K. Hah, H.L. Yu, G.D. Lim, H.I. Hwangl, H.D. Kim, M.J. Lee, N.C. Ahn, Characterization of Nutritional Value for Twenty-one Pork Muscles, Asian-Aust J. Anim. Sci 21 (2008) 138–143. [23] V. Jukna, C. Jukna, The comparable estimatimation of
meat quality of pigs breeds and their combinations in Lithuania, Biotechnol. Anim .Husband 21 (2005)175–179. [24] E. Jacyno, A. Pietruszka, A. Kołodziej, I flue e of pig meatiness on pork meat quality, Pol. J. Food Nutr. Sci.
56 (2006) 137–140.
[25] E. Vá la ko á, R. Bečko á, Effe t of li seed i pig diet o meat quality and fatty acid content. Arch. Tierz. Dum-merstorf Special Issue 50 (2007) 144–151.
[26] J. Simek, M. Grolichová, Steinhauserová I, Steinhauser L, Carcass and meat quality of selected final hybrids of pigs in the Czech Republic, Meat Sci. 66 (2004) 383–386. [27] A. Kasprzyk, A. Stasiak, M. Babicz, Meat quality and
ultrastructure of muscle tissue from fatteners of Wild
Boar, Pulawska and its crossbreed Pulawska × (Hamshire × Wild Boar). Arch. Tierz. 53 (2010) 184-193.
[28] M. Fu a , Š. Malo h, A. Le a t, Ko ač M, Fatt a id
o positio of eat a d adipose tissue f o K škopolje
pigs and commercial fatteners in Slovenia. Arch. Tierz.
53 (2010) 73–84.
[29] A.F. Marchiori, E.P. de Felício, Quality of wild boar meat and commercial pork. Sci. Agric. 60 (2003) 1–5.
[30] B. Lebret, A.N. Guillard, Outdoor rearing of cull sows: Effects on carcass, tissue composition and meat quality, Meat Sci. 70 (2005) 247–257.
[31] N.A. Postola he, R. Lază , C.P. Boiştea u, Resea hes o the characterization of physical and chemical parame-ters of refrigerated meat from wild boar sampled From the N-E pa t of Ro a ia, Lu ă i Ştii ţifi e, 54 (2011) 193–197.
[32] G.M.A. Quaresma, P.S. Alves, I. Trigo-Rodrigues, R. Pereira-Silva, N. Santos, C.P.J. Lemos, S.A. Barreto, B.J.R. Bessa, Nutritional evaluation of the lipid fraction of feral wild boar (Sus scrofa scrofa) meat, Meat Sci. 89 (2011) 457–461.
IZVOD
KVALITET MESA SVINJA RASE DUROKJORKŠIR, DUROKJORKŠIRDIVLJI VEPAR I DIVLJI VEPAR “ eža a D. I a o ić1, )o a M. “toja o ić2
, Jovanka V. Popov-Raljic3, Mila Ž. Baltić4, Boris P. Pisinov1, Kse ija D. Nešić1
1Naučni institut za veterinarstvo Sr ije, Beograd, Sr ija 2Agen ija za ispitivanje životne sredine, Beograde, Sr ija 3
Poljoprivredni fakultet, Zemun, Srbija 4
Fakultet veterinarske medicine, Univerziteta u Beogradu, Beograd, Srbija
(Struč i ad)
Meso s i ja z og s og sasta a, p e s ega količi e isoko ed ih p otei a, i
esencijlnih aminokiselina, masti i esencijalnih masnih kiselina, vitamina (svinjsko
eso, a p i e , sad ži isok i o tia i a i o je – puta eći ego u esu
ostalih vrsta stoke za klanje) i minerala, predstavlja visokokvalitetnu i
koncentro-a u h koncentro-a u i zkoncentro-ato i koncentro-a koncentro-až u ulogu u ish koncentro-a i ljudi. U zavisnosti od, rase, pola,
sta osti i stepe a uh a je osti, kao i položaja u telu, eso ože da sad ži azličite količi e išić og, as og i ezi og tki a, što epos ed o uslo lja a he ijski
sastav ove namirnice. Cilj ovog rada je bio da se ispita hemijski sastav i pH vred-nost, sasta as ih kiseli a, sad žaj holeste ola, oja i st u e tal o i se zo a
a aliza s ežeg esa s i ja za: Du okJo kši , Du okJo kšidivlji vepar i divlji vepar. Iz uzoraka m. longissimus dorsi, uzetih ako kla ja a ede ih ži oti ja, ispitivan je he ijski sasta p i e o I“O etoda. “asta as ih kiseli a i sad žaj
holeste ola od eđi a i su sta da d o etodo p i e o gas e h o ato
-g afije GC N, Agile t Te h., U“A po eđe i sa sta da do as ih kiseli a
(standard mix of FAMEs 37, Supelco, U“A . Boja s ežeg esa je takođe od eđi -vana u m. longissimus dorsi upotrebom Minolta chromameter CR-400. Senzornu
a alizu su adili o uče i o e ji ači u skladu sa I“O etodo . Do ije i ezultati su statistički o ađe i p i e o p og a a M“-Excel 2003, ANOVA i ut đe e azlike
s ed jih ed osti po eđe e t-testo a i ou z ačaj osti i 95%. Iz prikazanih
ezultata idi se da je postojala statistički z ačaj a azlika u k alitetu esa iz eđu
ispitivanih uzoraka.