Arq. Bras. Med. Vet. Zootec., v.67, n.4, p.1166-1174, 2015
Meat quality and cut yield of pigs slaughtered over 100kg live weight
[Qualidade de carne e rendimento de cortes de suínos abatidos acima de 100kg de peso vivo]
T.M. Bertol1, E.A. Oliveira2, A. Coldebella1, V.L. Kawski1,
A.J. Scandolera3, M.B. Warpechowski3
1Embrapa Suíno e Aves Concórdia, SC
²Aluno de pós-graduação Universidade Federal do Paraná Curitiba, PR 3Universidade Federal do Paraná Curitiba, PR
ABSTRACT
Meat quality and cut yield of pigs slaughtered between 100 and 150kg live weight were evaluated. Pigs (417 Agroceres PIC barrows and gilts) were fed a daily allowance of 2.8kg per head from 80kg until 100.71±0.85, 118.58±0.99, 134.07±1.18 or 143.90±1.24kg live weight. Seventy-one pigs were used for the evaluation of primal and subprimal cuts. There was no interaction between sex and slaughter weight for any of the evaluated parameters. Ham, shoulder, and loin weights linearly increased (P<0.01; R²: 84.3-93.2%) with increasing slaughter weight, which, however, had little effect on primal cuts meat yield. Increasing slaughter weight promoted a linear (P<0.05) and a quadratic (P<0.01) increase of red/green coordinate (a* value) of the loin and ham, respectively. Shear force showed a quadratic response (P<0.05), with minimum value estimated at 122kg slaughter weight. It was concluded that, under the applied management, increasing slaughter weight increased the volume of meat, but had little effect on meat yield. The meat of pigs slaughtered at heavier weights showed more intense red color and the same intramuscular fat content as lighter pigs, while tenderness was slightly affected.
Keywords: feed restriction, pork production, heavy hogs, carcass grading
RESUMO
Foi avaliada a qualidade da carne e os cortes de suínos abatidos entre 100 e 145kg de peso vivo. Os suínos (417 machos castrados e fêmeas, linhagem Agroceres PIC) foram mantidos sob fornecimento programado de 2,8kg de ração por animal por dia a partir de 80kg até o abate aos: 100,71±0,85, 118,58±0,99, 134,07±1,18 ou 143,90±1,24kg de peso vivo. Destes, 71 suínos foram usados para avaliação dos cortes primários e secundários. Não foi observada interação entre sexo e peso de abate em nenhuma das variáveis avaliadas. Os pesos do pernil, da paleta e do carré aumentaram linearmente (P<0,01; R² entre 84,3 e 93,2%) com o peso de abate, com pouco efeito sobre o rendimento da carne. A coordenada vermelho/verde (valor de a*) aumentou linearmente (P<0,05) no lombo e de forma quadrática (P<0,01) no pernil com o aumento do peso de abate. A força de cisalhamento apresentou resposta quadrática (P<0,05), com redução até o valor mínimo estimado para os 122kg de peso vivo. Conclui-se que, com o manejo utilizado neste estudo, a elevação do peso de abate resulta em aumento na quantidade de carne produzida, com pouco efeito sobre o rendimento de carne. A carne de suínos abatidos em pesos elevados apresenta cor vermelha mais intensa e mesmo nível de gordura intramuscular que a carne de suínos mais leves, enquanto a maciez é alterada apenas de maneira discreta.
Palavras chaves: restrição alimentar, produção de carne, suíno pesado, tipificação
INTRODUCTION
In pig production, slaughter weight is a management factor that strongly affects production costs and final product quality. Until the mid 1990s in Brazil, pigs were slaughtered between 90 and 100kg live weight. Reduced fat deposition and better feed efficiency as a result of several technologies adopted by the industry
allowed increasing slaughter weight in
approximately 20-30kg in the last two decades in the main pig-producing regions of Brazil. However, in other regions, pigs are still harvested at lighter weights, and the optimal slaughter weight relative to cut yield and meat quality has not been determined yet.
Some attempts have been made to evaluate the effect of higher slaughter weights on profitability, carcass quality, primal cut yield
(Pinheiro et al., 1983; Irgang and Protas, 1986a;
Irgang and Protas, 1986b; Santos Filho et al.,
2001) and pork quality (Sutton et al., 1997;
Candek-Potokar et al., 1998; Monin et al., 1999;
Latorre et al., 2004; Correa et al., 2006);
however, few have evaluated pigs slaughtered with more than 125kg live weight. The genetic improvement has changed carcass composition in terms of weight and yield of cuts. Moreover, the genetic selection for high lean production also led to changes in the ratio between muscle fiber types, resulting in muscle biochemical changes and negatively affecting meat quality
(Lefaucheur et al., 2011), which may interact
with slaughter weight. Therefore, the aim of this study was to evaluate the weight and composition of cuts, and the meat quality of pigs of a genotype selected for high lean production slaughtered between 100 and 145kg live weight.
MATERIALS AND METHODS
The experimental protocol was approved by the Committee of Ethics for Animal Experimentation of Embrapa Swine and Poultry, in accordance with the ethical principles of animal experimentation of the Brazilian College of Animal Experimentation. The experiment was carried out in two commercial farms located in the central southern region of Paraná, Brazil. A total of 417 crossbred pigs (207 gilts and 210 barrows) were allotted in an experiment with a completely randomized block (farm) design and
a 2x4 factorial arrangement of treatments (two sexes x four slaughter weights: 100, 115, 130 and 145kg). Pigs (initial weight = 80±0.40kg) were housed in sex separate pens in groups of 10 or 11 animals, in a total of five pens of each sex per slaughter weight group. Pens had concrete floors, nipple drinkers, and natural ventilation using side curtains. Daily feed allowance was 2.8kg per animal divided in three meals. The diet contained 3,306 kcal/kg metabolizable energy, 14.79% crude protein, 0.57% calcium, 0.34% total phosphorus, 0.24% available phosphorus, 0.87% total lysine, and 0.74% digestible lysine, and consisted of ground corn (77.5%), soybean meal (19.4%), L-lysine (0.077%), and vitamin and mineral supplement (3%).
At the end of the experiment, pigs were transported to the processing plant, located 80-km from the farms. Pigs were weighed eight hours before transportation after being
feed-fasted for eight hours, but with ad libitum access
to water. The final weight of the pigs in the four
target slaughter weight groups was
100.71±0.85kg, 118.58±0.99kg, 134.07±1.18kg, and 143.90±1.24kg. After electrical stunning pigs were bled and processed according to the usual procedures of the processing plant.
Primal and subprimal cuts were evaluated in a total of 71 carcasses: six barrows and six gilts of the 100-kg target slaughter weight, 10 barrows and 10 gilts of the 115- and 130-kg target slaughter weight, and 10 barrows and 9 gilts of the 145-kg target slaughter weight. The carcasses selected for the evaluation of cuts were those which weight was closer to the target slaughter weight of the group. The following primal cuts were obtained from the right half of carcasses 24 h after slaughter: ham, shoulder, loin, belly, and boston butt. The meat, skin+fat, and bones of each cut were separated. Meat yield relative to each cut, as well as total weight and yield of meat, skin+fat, and bone of the pooled primal cuts were calculated. The weight of subprimal cuts tenderloin, topside, boneless loin, and boneless boston butt were obtained. Head weight was calculated as the difference of carcass weight minus the sum of feet, tail, jowl, kidneys, perirenal fat, and primal cut weights.
to a portable pH meter (Hanna Instruments, HI
99163) in the muscles Longissimus thoracis, at
the last rib and Semimembranosus. Twelve hours
after slaughter, meat was scored for color and marbling (NPPC, 1999), and meat lightness (L*) and redness (a*) were measured according to the CIELAB system (Minolta Camera Ltda., Japan; illuminant D65; 0° viewing angle; 8 mm measuring area; measuring area of 8 mm diameter; illumination area of 11mm diameter). Color saturation index was calculated according to Little (1975). Drip loss was determined in
Longissimus thoracis and Semimembranosus
samples. Approximately 12g samples were placed inside plastic bags specifically used for drip loss analysis. Drip loss was calculated as the difference between initial weight and weight after 48 hours at 7°C, and expressed as a percentage of initial sample weight.
Samples used for dry matter, lipid content, and shear force analyses were frozen at -20°C after collection. The samples used for ether extract and dry matter analyses were freeze-dried (-40°C to 20°C) in a freeze-drier (Liobrás, Model LP810), ground in a refrigerated mill (Foss Tecator 1095, Knifetec Sample), and stored at -25°C. Dry matter and fat contents were
determined according to AOAC (1995). Meat
texture was determined after thawing the loin samples (at 5°C) to 24°C and cooking in a water bath until sample temperature reached 75°C. When the samples reached room temperature (~20°C) rectangular pieces were cut (1x1x2 cm) and placed perpendicularly to the muscle fiber direction in a Warner-Bratzler apparatus (TA-XTPlus, Stable Micro Systems), previously calibrated to 10-kg standard weight, using an aluminum probe (HDP) and pre-test, post-test, and test speeds of 2.0 mm/s (AMSA, 1995).
The analysis of variance (ANOVA) was performed using the means per pen, by the GLM procedure of SAS (SAS Institute INC, 2011), considering the qualitative effects of slaughter weight, sex, farm, and interaction between sex vs. slaughter weight. This analysis was also used to find the pure error to be tested in the polynomial regression analyses of the first and second order. The measured slaughter weight means and sex vs. slaughter weight interaction were used as independent variables in the analysis of regression. The residuals were investigated regarding ANOVA assumptions
using residual plot analysis, tests for normality (Shapiro-Wilk, Kolmogorov-Smirnov, Cramer-von Mises and Anderson-Darling) and for homoscedasticity (Levene’s test). When the homoscedasticity assumption was not supported, ANOVA weighted by inverse of variance was performed.
RESULTS AND DISCUSSION
There was no interaction (P>0.05) between sex and slaughter weight for any of the cut variables. There was no effect of sex on the weight of individual cuts or pooled cuts (Tab. 1 and 2). The lack of effect of sex on cut weight was also
observed by other authors for ham (Latorre et al.,
2004; Correa et al., 2006; Latorre et al., 2008;
Peinado et al., 2008), shoulder, loin, and boston
butt (Cisneros et al., 1996a; Peinado et al.,
2008), and side plus spareribs (Martin et al.,
1980; Cisneros et al., 1996a) from pigs
slaughtered between 107 and 140kg live weight. However, some studies reported higher loin
values for gilts (Latorre et al., 2004; Correa et
al., 2006; Latorre et al., 2008). Gilts had higher
ham and shoulder meat yields (P<0.006 and P<0.004, respectively), as previously found by
Correa et al. (2006).
Ham, shoulder, loin, and boston butt weights linearly increased (P<0.001), with 0.128, 0.073, 0.079, and 0.020kg per kg of increase in slaughter weight, respectively, (Tab. 3). These increments in the weight of primal cuts are consistent with the value ranges reported in
literature of 0.086-0.195kg in ham,
0.036-0.182kg in shoulder, 0.03-0.117kg in loin, and 0.036-0.046kg in boston butt per kg of
increase in slaughter weight (Martin et al., 1980;
Irgang and Protas, 1986b; Cisneros et al., 1996a;
Dutra Jr et al., 2001; Latorre et al., 2004; Latorre
et al., 2008). There was a quadratic effect
(P<0.001) of slaughter weight on belly weight (P<0.001), with maximum point obtained in pigs slaughtered at approximately 145kg, whereas
Martin et al. (1980) and Cisneros et al. (1996a)
reported a linear effect.
Tenderloin, boneless boston butt, topside, and boneless loin weights linearly increased with slaughter weight (P<0.001), and had a weak to moderate correlation with slaughter weight
(R² between 47.6 and 87.9%). Cisneros et al.
loin, tenderloin, and boston butt weights of 38, 5, and 20g per kg of increase in slaughter weight, respectively. Data regarding the effect of
slaughter weight on the weight of subprimal cuts are infrequent, warranting the performance of further studies on this subject.
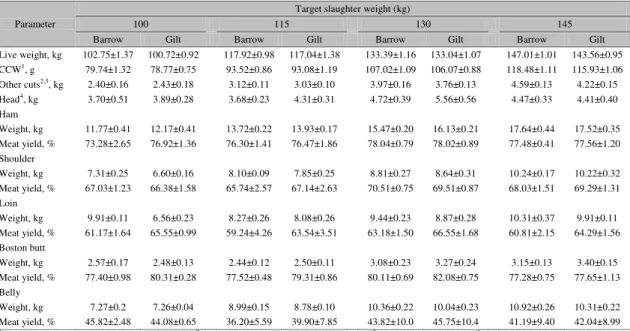
Table 1. Effects of slaughter weight and sex on carcass and primal cuts (means ± standard error) of pigs
slaughtered between 100 and 145kg live weight
Parameter
Target slaughter weight (kg)
100 115 130 145
Barrow Gilt Barrow Gilt Barrow Gilt Barrow Gilt
Live weight, kg 102.75±1.37 100.72±0.92 117.92±0.98 117.04±1.38 133.39±1.16 133.04±1.07 147.01±1.01 143.56±0.95 CCW1, g 79.74±1.32 78.77±0.75 93.52±0.86 93.08±1.19 107.02±1.09 106.07±0.88 118.48±1.11 115.93±1.06
Other cuts2,3, kg 2.40±0.16 2.43±0.18 3.12±0.11 3.03±0.10 3.97±0.16 3.76±0.13 4.59±0.13 4.22±0.15
Head4, kg 3.70±0.51 3.89±0.28 3.68±0.23 4.31±0.31 4.72±0.39 5.56±0.56 4.47±0.33 4.41±0.40
Ham
Weight, kg 11.77±0.41 12.17±0.41 13.72±0.22 13.93±0.17 15.47±0.20 16.13±0.21 17.64±0.44 17.52±0.35 Meat yield, % 73.28±2.65 76.92±1.36 76.30±1.41 76.47±1.86 78.04±0.79 78.02±0.89 77.48±0.41 77.56±1.20 Shoulder
Weight, kg 7.31±0.25 6.60±0.16 8.10±0.09 7.85±0.25 8.81±0.27 8.64±0.31 10.24±0.17 10.22±0.32
Meat yield, % 67.03±1.23 66.38±1.58 65.74±2.57 67.14±2.63 70.51±0.75 69.51±0.87 68.03±1.51 69.29±1.31 Loin
Weight, kg 9.91±0.11 6.56±0.23 8.27±0.26 8.08±0.26 9.44±0.23 8.87±0.28 10.31±0.37 9.91±0.11
Meat yield, % 61.17±1.64 65.55±0.99 59.24±4.26 63.54±3.51 63.18±1.50 66.55±1.68 60.81±2.15 64.29±1.56 Boston butt
Weight, kg 2.57±0.17 2.48±0.13 2.44±0.12 2.50±0.11 3.08±0.23 3.27±0.24 3.15±0.13 3.40±0.15
Meat yield, % 77.40±0.98 80.31±0.28 77.52±0.48 79.31±0.86 80.11±0.69 82.08±0.75 77.28±0.75 77.65±1.13 Belly
Weight, kg 7.27±0.2 7.26±0.04 8.99±0.15 8.78±0.10 10.36±0.22 10.04±0.23 10.92±0.26 10.31±0.22 Meat yield, % 45.82±2.48 44.08±0.65 36.20±5.59 39.90±7.85 43.82±10.0 45.75±10.4 41.19±9.40 42.04±8.99
1 With head, feet, tail, kidneys, and perirenal fat; 2 Feet, tail, jowl, kidneys, and perirenal fat; 3 Relative to half carcass; 4 Calculated per difference; CCW=
cold carcass weight.
Table 2. Effects of slaughter weight and sex on pooled primal and subprimal cuts (means ± standard
error)of pigs slaughtered between 100 and 145kg live weight
Parameter
Target slaughter weight, kg
100 115 130 145
Barrows Gilts Barrows Gilts Barrows Gilts Barrows Gilts
Pooled primal cuts
Total weight1, kg 35.57±0.59 35.06±0.45 41.54±0.45 41.15±0.53 47.16±0.45 46.95±0.41 52.26±0.43 51.40±0.52
Meat, kg 22.90±0.42 23.23±0.51 25.84±0.57 26.52±0.64 31.24±0.49 31.79±0.67 33.92±0.77 33.37±1.10
Bones, kg 4.85±0.20 4.78±0.15 5.47±0.09 5.41±0.13 6.09±0.06 6.10±0.08 6.61±0.09 6.54±0.18
Skin+fat, kg 7.74±0.38 7.02±0.43 10.03±0.43 9.15±0.39 9.69±0.80 8.93±0.77 11.47±0.71 10.49±0.70
Yield, % live weight 34.62±0.22 34.81±0.27 35.23±0.26 35.16±0.25 35.35±0.22 35.29±0.21 35.55±0.13 35.80±0.21
Yield, % carcass 44.68±0.34 44.44±0.16 45.01±0.41 44.34±0.17 44.09±0.16 43.93±0.24 44.23±0.13 44.44±0.15
Meat yield, % 64.39±0.53 66.25±0.93 62.18±1.09 64.43±1.24 66.36±1.51 67.78±1.57 64.89±1.34 65.00±2.29
Bone yield, % 13.65±0.57 13.64±0.38 13.18±0.19 13.15±0.28 12.91±0.16 12.99±0.14 12.64±0.16 12.70±0.25
Skin+fat yield, % 21.74±0.96 20.04±1.26 24.16±1.09 22.29±1.01 20.44±1.56 18.98±1.57 21.95±1.35 20.37±1.26
Subprimal cuts
Tenderloin, kg 0.29±0.02 0.28±0.01 0.27±0.01 0.32±0.01 0.34±0.02 0.69±0.01 0.38±0.03 0.38±0.02
Boneless boston butt,
kg 1.24±0.06 1.18±0.05 1.24±0.06 1.24±0.06 1.51±0.08 1.59±0.10 1.54±0.09 1.68±0.09
Topside, kg 1.07±0.04 1.29±0.05 1.65±0.22 1.73±0.13 1.78±0.22 1.94±0.19 2.28±0.32 2.19±0.29
Boneless loin, kg 2.35±0.13 2.57±0.14 2.72±0.24 2.87±0.10 3.10±0.10 3.27±0.064 3.41±0.17 3.53±0.18
Table 3. Parameters of the polynomial analysis of regression of carcass and primal and subprimal cuts data of pigs slaughtered between 100 and 145kg live weight
Dependent variable
Parameter estimates Pr>F
R2 Residual error Intercept
Linear Quadratic Linear Quadratic Barrows Gilts
CCW1, kg -8.676 -8.676 0.867 - <0.001 NS 98.84 1.49
Other cuts2, 3, kg -2.322 -2.322 0.046 - <0.001 NS 78.11 0.39
Head4, kg 1.481 1.481 0.023 - 0.01 NS 8.95 1.18
Ham
Weight, kg -1.178 -1.178 0.128 - <0.001 NS 93.23 0.56
Meat yield, % 44.043 44.0423 0.467 -0.0016 0.002 0.03 50.10 2.10
Shoulder
Weight, kg -0.612 -0.612 0.073 - <0.001 NS 84.30 0.52
Meat yield, % 58.840 58.840 0.073 - 0.002 NS 49.09 2.75
Loin
Weight, kg -1.295 -1.295 0.079 - <0.001 NS 89.36 0.44
Boston butt
Weight, kg 0.336 0.336 0.020 - <0.001 NS 40.73 0.40
Meat yield, % 39.495 41.056 0.637 -0.0026 NS 0.01 28.85 2.06
Belly
Weight, kg -15.811 -15.811 0.331 -0.0010 <0.001 0.02 90.66 0.41
Meat yield, %5 0.660 0.660 0.767 -0.0034 <0.001 <0.001 86.83 6.35 Pooled primal cuts
Total weight3, kg -2.752 -2.752 0.375 - <0.001 NS 98.08 0.84
Meat, kg -2.203 -2.203 0.248 - <0.001 NS 76.01 2.21
Bones, kg 0.668 0.668 0.041 - <0.001 NS 81.50 0.31
Skin+fat, kg -0.086 -0.086 0.076 - <0.001 NS 29.14 1.88
Yield, live weight % 32.960 32.960 0.018 - <0.001 NS 16.06 0.66
Bone, %5 15.533 15.533 -0.020 - <0.05 NS 15.35 0.73
Subprimal cuts
Tenderloin, kg 0.019 0.019 0.002 - <0.001 NS 55.85 0.04
Boneless boston butt, kg 0.136 0.136 0.010 - <0.001 NS 47.60 0.18
Topside, kg -0.665 -0.665 0.019 - <0.001 NS 87.95 0.20
Boneless loin, kg 0.133 0.133 0.023 - <0.001 NS 67.60 0.28
1With head, feet, tail, kidneys, and perirenal fat; 2Feet, tail, jowl, kidneys, and perirenal fat; 3Relative to half carcass; 4Calculated per difference; 5ANOVA weighted by inverse of variance was performed; CCW= cold carcass weight;
NS = not significant
As expected, the weight of the pooled primal cuts, subprimal cuts, and other cuts (feet, tail, jowl, kidneys, and perirenal fat), as well as the weight of meat, bones, and skin+fat of the pooled cuts linearly increased with slaughter weight (P<0.01 to P<0.001). This is in agreement with
the findings of Correa et al. (2006), who reported
that the weight of pooled subprimal cuts increased with slaughter weight. The increase in meat weight of pooled cuts of the whole carcass obtained in the present study (0.248kg) is
consistent with the observations of Cisneros et
al. (1996a), who reported an increase of 0.140kg
in meat weight per kg increase in slaughter weight.
There was an increase of 0.018% in the pooled cuts yield (P<0.001) per kg of live weight increase (Table 3). However, when considered
relative to carcass weight, there was no effect of slaughter weight, in agreement with the results of Irgang and Protas (1986b). Meat and skin+fat yields were not affected by slaughter weight, as
previously found by Correa et al. (2006).
However, differently from the results of the present study, Irgang and Protas (1986b) and
Cisneros et al. (1996a) reported a reduction in
the meat yield of pooled cuts. This is probably due to differences in slaughter weight ranges, cut patterns, genetics, nutrition, and feeding management used in these studies. Bone yield of the pooled cuts decreased (P<0.001) as slaughter weight increased, which is consistent with the results obtained by Irgang and Protas (1986b).
slaughtering heavier pigs, meaning that more meat can be produced per animal at lower processing costs. Market surveys indicate that heavier slaughter weights provide adequate size of special cuts valued by consumers, such as rump cap, tenderloin, boston butt, and topside, but these surveys also showed that traditional cuts, such as loin, boneless loin, ribs, and ham from pigs slaughtered over 105kg are usually rejected by consumers due to their large size. Specific studies evaluating operational issues in processing plants and consumers’ preferences are needed.
Increasing slaughter weight led to an increase in a* value and color saturation (P<0.05), suggesting that meat color was redder and more intense in heavier pigs (Table 4). The results of previous studies on pork color changes due to slaughter weight are widely varied. The response observed in the present study is consistent with
the findings of Latorre et al. (2004) relative to a*
value. Reduced loin L* values with increasing
slaughter weights were reported by Latorre et al.
(2004) and Fábrega et al. (2011). The more
intense red color obtained in heavier pigs in the present study may be related to higher myoglobin content in the muscle, as reported by
Latorre et al. (2004). Color visual score was
influenced by slaughter weight (P<0.05), which
differs from Sutton et al. (1997) and Correa et al.
(2006), who did not find an effect of slaughter weight on this variable. Considering the different meat color assessments carried out in this study, the meat of heavy pigs was lighter according to the visual evaluation, but not by instrument evaluation (L* value), showing also more intense red color and higher saturation index. The difference between the visual and instrumental assessment is due to the subjectivity of the visual method, which may be affected by intramuscular fat content, meat exudation, and environmental luminosity.
pH 45 min post-slaughter was quadratically reduced (P<0.05), but the mean values for all slaughter weights are within the range of normal quality meat (initial pH>6.0), according to the standards of the National Pork Producers Council (NPPC, 1999). Twelve hours post-slaughter pH linearly increased with increasing slaughter
weight (P<0.05). Twenty four hours post-slaughter, loin pH quadratically increased (P<0.01), but ham pH was not influenced (P>0.05) by slaughter weight. Loin 24-h pH average values for each slaughter weight group were below or at the minimum limit indicated for normal, non-exudative meat (5.6-5.9; NPPC, 1999).
There was no influence of sex on most of the pork quality characteristics, except for marbling, which was higher (P<0.05) in barrows
than in gilts (1.41±0.063 vs. 1.28±0.043 %,
respectively). This result was expected and it is
consistent with previous reports (Latorre et al.,
2003; Suzuki et al., 2003; Dugan et al., 2004).
Interaction of sex vs. slaughter weight was
observed (P<0.05) on the saturation index, color
score, pH 12h of ham and pH 24h of loin. Loin
drip loss was not influenced (P>0.05) by slaughter weight, and the average values obtained are within the range expected for normal quality meat (2-6%; NPPC, 1999). Ham drip loss linearly increased (P<0.01) with slaughter weight. These results are consistent
with the findings of Candek-Potokar et al.
(1998), and Correa et al. (2006).
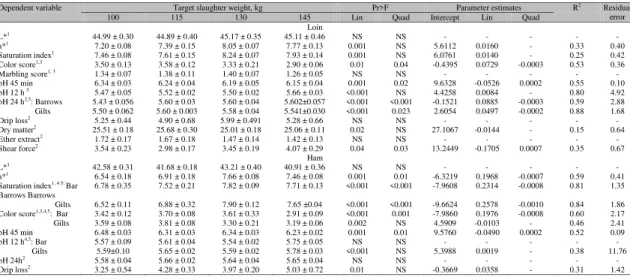
Table 4. Mean, standard error, significance level, and parameters of polynomial analysis of regression of meat quality of pigs slaughtered between 100 and 145kg live weight
Dependent variable Target slaughter weight, kg Pr>F Parameter estimates R2 Residual error 100 115 130 145 Lin Quad Intercept Lin Quad
Loin
L*1 44.99 ± 0.30 44.89 ± 0.40 45.17 ± 0.35 45.11 ± 0.46 NS NS - - - - - a*1 7.20 ± 0.08 7.39 ± 0.15 8.05 ± 0.07 7.77 ± 0.13 0.001 NS 5.6112 0.0160 - 0.33 0.40 Saturation index1 7.46 ± 0.08 7.61 ± 0.15 8.24 ± 0.07 7.93 ± 0.14 0.001 NS 6.0761 0.0140 - 0.25 0.42 Color score1,3 3.50 ± 0.13 3.58 ± 0.12 3.33 ± 0.21 2.90 ± 0.06 0.01 0.04 -0.4395 0.0729 -0.0003 0.53 0.36 Marbling score1, 3 1.34 ± 0.07 1.38 ± 0.11 1.40 ± 0.07 1.26 ± 0.05 NS NS - - - - - pH 45 min 6.34 ± 0.03 6.24 ± 0.04 6.19 ± 0.05 6.15 ± 0.04 0.001 0.02 9.6328 -0.0526 0.0002 0.55 0.10 pH 12 h 5 5.47 ± 0.05 5.52 ± 0.02 5.50 ± 0.02 5.66 ± 0.03 <0.001 NS 4.4258 0.0084 - 0.80 4.92 pH 24 h2,5: Barrows 5.43 ± 0.056 5.60 ± 0.03 5.60 ± 0.04 5.602±0.057 <0.001 <0.001 -0.1521 0.0885 -0.0003 0.59 2.88 Gilts 5.50 ± 0.062 5.60 ± 0.003 5.58 ± 0.04 5.541±0.030 <0.001 0.023 2.6054 0.0497 -0.0002 0.88 1.68 Drip loss2 5.25 ± 0.44 4.90 ± 0.68 5.99 ± 0.491 5.28 ± 0.66 NS NS - - - - - Dry matter2 25.51 ± 0.18 25.68 ± 0.30 25.01 ± 0.18 25.06 ± 0.11 0.02 NS 27.1067 -0.0144 - 0.15 0.64 Ether extract2 1.72 ± 0.17 1.67 ± 0.18 1.47 ± 0.14 1.42 ± 0.13 NS NS - - - - - Shear force2 3.54 ± 0.23 2.98 ± 0.17 3.45 ± 0.19 4.07 ± 0.29 0.04 0.03 13.2449 -0.1705 0.0007 0.35 0.67
Ham
L*1 42.58 ± 0.31 41.68 ± 0.18 43.21 ± 0.40 40.91 ± 0.36 NS NS - - - - - a*1 6.54 ± 0.18 6.91 ± 0.18 7.66 ± 0.08 7.46 ± 0.08 0.001 0.01 -6.3219 0.1968 -0.0007 0.59 0.41 Saturation index1, 4 5: Bar
Barrows Barrows 6.78 ± 0.35 7.52 ± 0.21 7.82 ± 0.09 7.71 ± 0.13 <0.001 <0.001 -7.9608 0.2314 -0.0008 0.81 1.35 Gilts 6.52 ± 0.11 6.88 ± 0.32 7.90 ± 0.12 7.65 ±0.04 <0.001 <0.001 -9.6624 0.2578 -0.0010 0.84 1.86 Color score1,3,4,5: Bar 3.42 ± 0.12 3.70 ± 0.08 3.61 ± 0.33 2.91 ± 0.09 <0.001 0.001 -7.9860 0.1976 -0.0008 0.60 2.17 Gilts 3.59 ± 0.08 3.81 ± 0.08 3.30 ± 0.21 3.19 ± 0.06 0.002 NS 4.5909 -0.0103 - 0.46 2.41 pH 45 min 6.48 ± 0.03 6.31 ± 0.03 6.34 ± 0.03 6.23 ± 0.02 0.001 0.01 9.5760 -0.0490 0.0002 0.52 0.09 pH 12 h4,5: Bar 5.57 ± 0.09 5.61 ± 0.04 5.54 ± 0.02 5.75 ± 0.05 NS NS - - - - -
Gilts 5.59±0.10 5.65 ± 0.02 5.59 ± 0.02 5.78 ± 0.03 <0.001 NS 5.3988 0.0019 - 0.38 11.76 pH 24h2 5.58 ± 0.04 5.66 ± 0.02 5.64 ± 0.04 5.65 ± 0.04 NS NS - - - - - Drip loss2 3.25 ± 0.54 4.28 ± 0.33 3.97 ± 0.20 5.03 ± 0.72 0.01 NS -0.3669 0.0358 - 0.31 1.42
… , 6, dark red; marbling: 1.1% intramuscular fat, 10, 10% intramuscular fat; NPPC, 1999)
1Evaluated 12 hours post-slaughter in all animals; 2Evaluated 24 hours post-slaughter in 20 animals per slaughter weight; 3Visual score (color: 1, pale pink, 6, dark red; marbling: 1.1% intramuscular fat, 10, 10% intramuscular fat; NPPC, 1999); 4Interaction sex X slaughter weight; 5 ANOVA weighted by inverse of variance was performed; Bar = Barrows; Lin = linear effect; Quad = quadratic effect.
Marbling score and ether extract were not influenced (P>0.05) by slaughter weight. These results are consistent with the findings of Monin
et al. (1999), Latorre et al. (2004), Correa et al.
(2006), and Fábrega et al. (2011), but Cisneros et
al. (1996a) found an increase in intramuscular fat
as slaughter weight increased, as well as
Candek-Potokar et al. (1998) in pigs fed ad libitum. An
increase in marbling score in the heavier pigs was not expected in this study because pigs were restricted-fed and the diet contained the same amino acid levels along the whole experimental period. Therefore, as slaughter weight increased, amino acid supply exceeded the pigs’ requirements. Some factors that increase intramuscular fat content are reduced amino acid
levels (Wood et al., 2004; Teye et al., 2006;
Bertol et al., 2010), poor dietary amino acid
balance (Cisneros et al., 1996b), ad-libitum
feeding, and heavy body weight.
Shear force showed a quadratic response (P<0.05), with the minimum value estimated at
122kg slaughter weight. Candek-Potokar et al.
(1998), Monin et al. (1999), and Latorre et al.
(2004) did not find any increase in shear force in pigs slaughtered at maximum weights of 127,
130 or 133kg. However, although Cisneros et al.
(1996a) did not observe any differences in shear force in pigs slaughtered from 100 to 160kg, a
reduction in tenderness was detected by a trained panel. The reduced tenderness in heavier pigs may be due to the lower content of soluble collagen in the muscle as the animal ages (Correa
et al., 2006).
CONCLUSIONS
The significant increase in the weight of primal cuts had little effect on meat yield, showing the advantages of slaughtering heavier pigs. The meat of pigs slaughtered at heavier weights and submitted to feed restriction showed more intense red color and the same intramuscular fat content as lighter pigs. Tenderness slightly changed with slaughter weight when pigs were slaughtered with more than 134kg live weight. The effect of slaughter weight on meat pH and drip loss should be revaluated in future studies by slaughtering pigs of different live weight simultaneously.
ACKNOWLEDGEMENTS
REFERENCES
BERTOL, T.M.; CAMPOS, R.M.L. DE;
COLDEBELLA, A. et al. Desempenho e
qualidade da carne de genótipos de suínos alimentados com dois níveis de aminoácidos.
Pesqui. Agropecu. Bras., v.45, p.621-629, 2010.
CANDEK-POTOKAR, M.; ZLENDER, B.; LEFAUCHEUR, L.; BONNEAU, M. Effects of
age and/or weight at slaughter on longissimus
dorsi muscle: biochemical traits and sensory
quality in pigs. Meat Sci., v.48, p.287-300, 1998.
CISNEROS, F.; ELLIS, M.; BAKER, D.H. et al.
The influence of short-term feeding of amino-acid deficient diets and high dietary leucine levels on the intramuscular fat content of pig
muscle. Anim. Sci., v.63, p.517-522, 1996b.
CISNEROS, F.; ELLIS, M.; MCKEITH, F. F. et
al. Influence of slaughter weight on growth and
carcass characteristics, commercial cutting and curing yields, and meat quality of barrows and
gilts from two genotypes. J. Anim. Sci., v.74,
p.925-933, 1996a.
CORREA, J.A.; FAUCITANO, L.; LAFOREST,
J.J. et al. Effects of slaughter weight on carcass
composition and meat quality in pigs of two
different growth rates. Meat Sci., v.72, p.91-99,
2006.
DUGAN, M.E.R.; AALHUS, J.L.;
ROBERTSON, W.M. et al Practical dietary
levels of canola oil and tallow have differing effects on gilt and barrow performance and
carcass composition. Can. J. Anim. Sci., v.84,
p.661-671, 2004.
DUTRA JR., W. M.; FERREIRA, A. S.;
TAROUCO, J. U. et al. Estimativa de
rendimentos de cortes comerciais e de tecidos de suínos em diferentes pesos de abate pela técnica
de ultra-sonografia em Tempo Real. Rev. Bras.
Zootec., v.30, p.1243-1250, 2001.
FÁBREGA, E.; GISPERT, M.; TIBAU, J. et al.
Effect of housing system, slaughter weight and slaughter strategy on carcass and meat quality, sex organ development and androstenone and skatole levels in Duroc finished entire male pigs.
Meat Sci., v.89, p.434-439, 2011.
IRGANG, R.; PROTAS, J.F. da S. Peso ótimo de abate de suínos. I. Desempenho dos animais.
Pesqui. Agropecu. Bras., v.21, p.1101-1108,
1986a.
IRGANG, R.; PROTAS, J.F.S. Peso ótimo de abate de suínos. II. Resultados de carcaça.
Pesqui. Agropecu. Bras., v.21, p.1337-1345,
1986b.
LATORRE, M. A.; GARCÍA-BELENGUER, E.; ARIÑO, L. The effects of sex and salughter weight on growth performance and carcass traits of pigs intendend for dry-cured ham from Teruel
(Spain). J. Anim. Sci., v.86, p.1933-1942, 2008.
LATORRE, M. A.; LÁZARO, R.; VALENCIA,
D.G. et al. The effects of gender and slaughter
weight on the growth performance, carcass traits,
and meat quality characteristics of heavy pigsJ.
Anim. Sci., v.82, p.526-533, 2004.
LATORRE, M.A.; MEDEL, P.; FUENTETAJA, A. et al. Effect of gender, terminal sire line and
age at slaughter on performance, carcass characteristics and meat quality of heavy pigs.
Anim. Sci., v.77, p.33-45, 2003.
LEFAUCHEUR, L.; LEBRET, B.; ECOLAN, P.
et al. H. Muscle characteristics and meat quality
traits are affected by divergent selection on residual feed intake in pigs. J. Anim. Sci., v.89,
p.996-1010, 2011.
LITTLE, A.C. Off on a tangent. J. Food Sci.,
v.40, p.400-411, 1975.
MARTIN, A. H.; SATHER, A. P.; FREDEEN, H. T.; JOLLY, R. W. Alternative market weights for swine. II Carcass composition and meat
quality. J. Anim. Sci., v.50, p.699-705, 1980.
MONIN, G.; LARZUL, C.; Le ROY, P. et al.
Effects of the halothane genotype and slaughter
weight on texture of pork. J. Anim. Sci., v.77,
p.408-415, 1999.
OFFICIAL methods of analysis, 16. ed. Arlington: AOAC International, 1995. 1025p. PEINADO, J.; MEDEL, P.; FUENTETAJA, A.; MATEOS, G. G. Influence of sex and castration of gilts on growth performance and carcass and meat quality of heavy pigs destined for dry-cured
industry. J. Anim. Sci., v.86, p.1410-1417, 2008.
PINHEIRO, A.C.A.; PROTAS, J.F.S.; IRGANG, R. A função de produção e a relação de preços insumo-produto, como determinantes do peso
ótimo de abate de suínos. Rev. Econ. Sociol.
Rural, v.3, p.371-379, 1983
RESEARCH guideliness for cookery sensory and instrumental tenderness measurement of fresh meat. Chicago: AMSA, 1995. 48p.
SANTOS FILHO, J.I.; PINHEIRO, A.A.C.; BERTOL, T.M.; LUDKE, J. V. Avanço tecnológico e alteração no peso ótimo de abate
de suínos. Concórdia: Embrapa/CNPSA, 2001.
Disponível em: <www.cnpsa.embrapa.br/sgc/
sgc_artigos/artigos_o8t704c.html/>. Acessado
em: 29 ago. 2011.
SAS/STAT user´s guide: statistics. Versão 8,
Cary: SAS Institute, 2001, 155p.
SUTTON, D.S.; ELLIS, M.; LAN, Y. et al.
Influence of slaughter weight and stress gene genotype on the water-holding capacity and protein gel characteristics of three porcine
muscles. Meat Sci., v.46, p.173-180, 1997.
SUZUKI, K.; SHIBATA, T.; KADOWAKI, H.
et al. Meat quality comparison of Berkshire,
Duroc and crossbred pigs sired by Berkshire and
Duroc. Meat Sci., v.64, p.35-42, 2003.
TEYE, G.A.; SHEARD, P.R.; WHITTINGTON,
F.M. et al. Influence of dietary oils and protein
level on pork quality. 1. Effects on muscle fatty acid composition, carcass, meat and eating
quality. Meat Sci., v.73, p.157-165, 2006.
WOOD, J.D.; NUTE, G.R.; RICHARDSON, R.I.
et al. Effects of breed, diet and muscle on fat
deposition and eating quality in pigs. Meat Sci.,