Importance of Oxidative Stress and Inflammation
Pathways in Obesity-Induced Diabetes in Mouse
Shouguo Gao1,2, Herbert Keith Roberts1, Xujing Wang1,2*
1Department of Physics, University of Alabama at Birmingham, Birmingham, Alabama, United States of America,2The Comprehensive Diabetes Center, University of Alabama at Birmingham, Birmingham, Alabama, United States of America
Abstract
Complex disorders often involve dysfunctions in multiple tissue organs. Elucidating the communication among them is important to understanding disease pathophysiology. In this study we integrate multiple tissue gene expression and quantitative trait measurements of an obesity-induced diabetes mouse model, with databases of molecular interaction networks, to construct a cross tissue trait-pathway network. The animals belong to two strains of mice (BTBR or B6), of two obesity status (obese or lean), and at two different ages (4 weeks and 10 weeks). Only 10 week obese BTBR animals are diabetic. The expression data was first utilized to determine the state of every pathway in each tissue, which is subsequently utilized to construct a pathway co-expression network and to define trait-relevant and trait-linking pathways. Among the six tissues profiled, the adipose contains the largest number of trait-linking pathways. Among the eight traits measured, the body weight and plasma insulin level possess the most number of relevant and linking pathways. Topological analysis of the trait-pathway network revealed that the glycolysis/gluconeogenesis pathway in liver and the insulin signaling pathway in muscle are of top importance to the information flow in the network, with the highest degrees and betweenness centralities. Interestingly, pathways related to metabolism and oxidative stress actively interact with many other pathways in all animals, whereas, among the 10 week animals, the inflammation pathways were preferentially interactive in the diabetic ones only. In summary, our method offers a systems approach to delineate disease trait relevant intra- and cross tissue pathway interactions, and provides insights to the molecular basis of the obesity-induced diabetes.
Citation:Gao S, Roberts HK, Wang X (2012) Cross Tissue Trait-Pathway Network Reveals the Importance of Oxidative Stress and Inflammation Pathways in Obesity-Induced Diabetes in Mouse. PLoS ONE 7(9): e44544. doi:10.1371/journal.pone.0044544
Editor:Gualtiero Colombo, Centro Cardiologico Monzino IRCCS, Italy
ReceivedMarch 1, 2012;AcceptedAugust 6, 2012;PublishedSeptember 17, 2012
Copyright:ß2012 Gao et al. This is an open-access article distributed under the terms of the Creative Commons Attribution License, which permits unrestricted use, distribution, and reproduction in any medium, provided the original author and source are credited.
Funding:Funding was provided by United States National Institutes of Health (NIH) NIH-DK080100. The funders had no role in study design, data collection and analysis, decision to publish, or preparation of the manuscript.
Competing Interests:The authors have declared that no competing interests exist.
* E-mail: [email protected]
Introduction
Phenotypic traits are properties that emerge from the interac-tions of genes within a dynamic environmental framework. A major goal of systems biology is to understand how the interactions lead to the observed traits [1,2]. This is especially critical in the study of complex diseases, where it is evident that they cannot be deciphered through considering individual genes only. A disease trait normally correlates with the inability of a particular functional network module to carry out its basic function, and the pathogenesis of a complex disease can involve the perturba-tions of more than one module. In a complex disease like Type 2 Diabetes (T2D), a spectrum of traits, such as obesity, hypergly-cemia, insulin resistance, etc, are associated to the risk of developing T2D. These suggest that multiple functional pathways are involved. Further complexities arise from the fact that multiple tissues are involved and the crosstalk among them is important to disease development. For instance, problems in both the insulin secreting pancreatic islets and target tissues of insulin action are observed in diabetics, and are believed to contribute to disease pathogenesis [3–8]. Therefore it will be highly valuable to map out the signaling pathways, and their interactions, both intra and cross tissue, underlying the disease traits.
A basic bioinformatics question that arises is, in mapping the genetic architecture of a disease, is it more efficient to develop gene level metrics and make assessment of gene networks through their members’ relevance to disease; or to develop network level metrics that directly assess a whole network? In the gene expression data analysis, both approaches were developed, either starting with differentially expressed genes followed by identifying pathways with enhanced presentation among them; or starting with pathways (or predefined gene set) directly through evaluating the expression distribution shift of the whole gene set [9].
approach that first defines disease associated genes through literature mining, followed by associating pathways to diseases based on enriched disease gene presence among pathway members, and linking different diseases based on pathway sharing [11]. To our knowledge, there is no study till now that focuses on delineating the association of clinical traits related to the same disease at the molecular pathway level.
Recently, Keller et al profiled gene expression in six tissues (pancreatic islet, liver, adipose, hypothalamus, gastrocnemius, and soleus), and measured eight quantitative traits (including plasma, glucose, and insulin) in a mouse model of obesity-induced diabetes [7]. They constructed co-expression networks in each tissue and linked network modules (densely connected subregions of the whole network) to traits if the average expression of members correlates to trait variations. A number of modules in islet, adipose, and soleus were found to strongly correlate with plasma glucose; several modules in islets, liver, and adipose exhibited a high correlation with insulin but not with glucose; a module in adipose correlated with inflammation. They further constructed intra- and inter-tissue networks of the pathways by linking those whose first principal components correlated. It was found that there was substantial tissue difference in the degree of intra-tissue connec-tivity. In both BTBR and B6 mouse strains, the two muscle tissues had the most intra-tissue connections (i.e. co-expressions), whereas liver and hypothalamus had the fewest. There was also significant strain difference, likely obesity-dependent, in the structure of the intra-tissue co-expression network. For instance, profiles of the cell cycle module suggested that obesity induced islet cellular proliferation occurred in B6 but not in BTBR mice. There was also an increase in inter-tissue connectivity in BTBR vs B6.
In a similar study by Dobrin et al [8], gene expression levels were profiled in adipose, liver and hypothalamus of the F2 progeny from a cross between the outbred M16 and ICR (imprinting Control Region) control mouse strains. The bipartite tissue to tissue co-expression network was first constructed for each pair of tissues, and subsequently partitioned into subnetworks utilizing the edge betweenness centrality measures defined in [12]. Centrality of a network node refers to its relative importance in the network, in terms of its potential influence on others. Edge betweenness is one of the centrality measures that was first proposed by Linton Freeman [12], which focuses on evaluating a node’s importance both to the local structure and to the global information flow. It is defined to be the fraction of shortest paths between all other nodes that passes through the given node. Topological evaluation of the network revealed that it is scale free, with some genes acting as hub nodes operating across tissues. Through analysis of the cross tissue networks, entire new classes of genes were identified to be associated with disease [8]. These genes were systematically overlooked in single tissue analyses because they formed, on average, no meaningful intra-tissue connections. In both studies [7,8], pathway networks were constructed using individual gene-based metrics; the disease trait measurements were not utilized. Here we propose a pipeline to reverse engineer the tissue-specific pathway and trait interaction networks for obesity-induced T2D using the gene expression and trait measurements by Keller et al [7]. We will utilize the Pathway Connectivity Index (PCI) that we previously developed to characterize the molecular state of a pathway during a given biological process [13], and to link the different pathways, and to link pathways to traits. PCI defines the molecular state of a network based both on the state of individual genes and on the topological structure of their interactions (see Methods). We have previously demonstrated its efficiency at identifying phenotype associated pathways using several gene expression datasets [13–15] and in candidate disease
gene prediction [16,17]. Pathway network edges are defined if the PCI of two pathways correlate, and pathway-trait links are made if the pathway PCI correlates to trait variations. By performing comparative network analysis, we can then hypothesize about the association among clinical traits at the molecular pathway level.
Compared to the existing works [7,8], our approach is new and different in the following aspect: (1) We start with the known KEGG pathways (www.genome.jp/kegg/) as the unit of our operation. We directly characterize the state of each pathway using a new quantitative metric that considers contributions both from individual genes and from their interactions. (2) The approach by Keller et al restricted their analysis to genes that showed one of the 15 predefined patterns [7], and the study by Dobrin et al [8] restricted to genes showing differential expression in at least 5% of the samples. Our approach utilizes expression information of every gene to score pathways and therefore will not miss gene sets that exhibit subtle but consistent changes as a group [9]. (3) Though eight disease related traits were measured in every animal by Keller et al [7], they were not previously utilized in pathway network construction nor in identification of disease-relevant pathways. We will include them to delineate the genetic architecture underlying each trait.
Materials and Methods
Gene expression and quantitative trait data
Multi-tissue microarray data were obtained from Gene Expres-sion Omnibus (GEO, http://www.ncbi.nlm.nih.gov/geo/, GSE10785). In this study [7], gene expression levels were profiled in six tissues that include hypothalamus, gastrocnemius, soleus, liver, adipose, and pancreatic islet from 2 mouse strains, the lean and obese C57BL/6 (B6) and the lean and obese BTBR mice, at two different ages, 4 weeks and 10 weeks. Five replicate animals were sacrificed under each condition in each strain, totaling 40 mice (2 strains62 obesity status62 time points65 replicate
animals). The two strains differ in obesity-induced diabetes susceptibility. B6 mice remain essentially non-diabetic at all ages, irrespective of obesity; whilst obese BTBR mice become severely diabetic by 10 wk of age. This study used Rosetta/Merck Mouse 44 k 1.0 oligonucleotide microarray. For a given tissue from each animal, labeled cRNA was hybridized against a pool sample constructed from equal aliquots of RNA from all of the 20 animals of the corresponding strain. This gives a total of 240 microarrays (6 tissues640 animals). In our study we used the log10 ratio (of each
animal to the common reference) in our network modeling. Eight T2D-related quantitative traits were also measured in each mouse and kindly provided to us by the authors [7]. These include the plasma glucose, insulin, total number of islets harvested per pancreas, body weight, triglyceride (TG), and levels in circulation of three adipokines: adiponectin, plasminogen activator inhibitor-1 (PAI-1), and resistin.
Mouse pathway and gene interaction network information
Characterizing the activity state of a pathway
To network pathways one needs to have a quantitative metric to characterize the state of each pathway. We believe that an efficient metric needs to capture not only the activities of individual genes in the pathway, but also their interaction patterns. Given a pathway of n genesfg1,g2,. . .gng, its gene interaction network can be represented by a graph G Vð ,EÞ, where vertex set V~fg1,g2,. . .gng, and the edge set
E~ gi,gj
Dgenesgiandgjinteract
; or a matrix called the adjacency matrixA~ ai,j
, whereai,j~0, if genesiandjdo not interact; andai,jw0otherwise. In this study we constructEbased on the mouseNET, and the adjacency matrix is defined as:
aij~
1, i~j Ppred, i=j
ð1Þ
where Ppred is the probability of functional linkage between the two genes predicted by the mouseNET [18].
Assuming thatxorigis is the (original) log expression measurement for geneiin samples, we first normalize it to zero mean and unit
variance throughxnorm is ~(x
orig is {xxorigs )
.
ss, and then transform it
using the Sigmoid function xis~Sigmoid(xnormis ){0:5. For each pathway we subsequently define the Pathway Connectivity Index, PCI, to capture pathway level activity [13]:
PCI~X
N
i~1 XN
j~1
sign(xiszxjs)DxisD1=2aijDxjsD1=2 ð2Þ
whereNis the number of genes in the pathway. This concept was first introduced in our previous studies [13], and the adjacency matrix of the protein-protein interaction network of genes in a
pathway was used in the definition.sign(xiszxjs) represents the overall expression status (up- or down-regulation) of the gene pair, and helps to reduce the information loss resulted from using absolute expression values. The Sigmoid transformation is introduced to reduce impact to PCI by genes with extremely low or high expression values. In network modeling of pathways, the PCI of each pathway is further normalized with its sizeN. This makes the PCI across all pathways follow approximately a normal distribution. PCI incorporates information of all available genes in the pathway. Subtle yet consistent gene expression modification will lead to a significant change in PCI. Furthermore, PCI captures the topological properties of the pathway, hub genes contribute more to PCI [13].
Networking pathways and traits
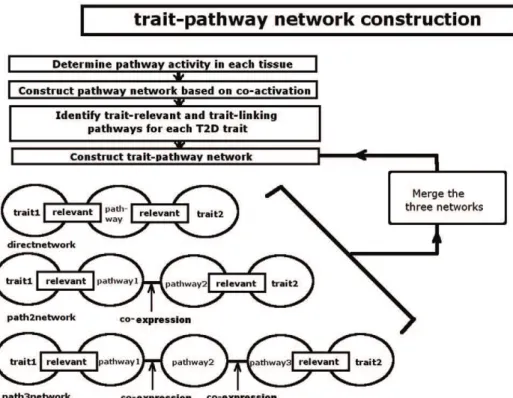
We propose a pipeline to construct the network of pathways and traits by integrating the multi-tissue gene expression, trait measurements, and pathways from KEGG (www.genome.jp/ kegg/). The scheme of the pipeline is given in Figure 1.
First the PCI of each pathway in each tissue of each animal is determined. Next a pathway coordination network is constructed where each node represents a pathway in a certain tissue and hence has two attributes: {pathway, tissue}. An edge is added between two nodes if their pathway PCIs correlate and the pathways are curated to be linked by the KEGG. This includes the situations of two different pathways in the same tissue, two different pathways that each is from a different tissue, and the same pathway in two different tissues.
Thirdly, we construct the trait-pathway network. For each T2D trait, we define the relevant and the linking pathways. A relevant pathway is one whose PCI correlates significantly with the trait variation. A pathway is trait-linking if it satisfies one of the following three conditions (Figure 1): (1) is a relevant pathway simultaneously for 2 or more traits; (2) is relevant to one trait and
interacts with a relevant pathway of another trait; (3) interacts simultaneously with relevant pathways of two different traits. These three situations are depicted at the bottom of Figure 1. We called them the Direct-network, Path2-network, and Path3-network, respectively. Merging them we obtain a complex trait-pathway network which links the T2D related traits and trait-pathways in the six key tissues. The network was further refined by removing nodes of network degree 0 or 1 and those where the sum of distance to the two nearest traits is .6. This helps to focus the analysis on those nodes that are more interactive and more likely to be relevant to T2D traits.
Both the global networks of all animals and the networks specific to each of the eight groups of mice were constructed. In this study we used Spearman correlation coefficient to construct the pathway co-expression network. The threshold values were determined through permutation tests. Briefly, the expression data of different genes were randomly permuted 10,000 times, all pairwise pathway correlation coefficients were recalculated each time. Using the permutation results, the p-value for each correlations value is then determined. We chose p,0.005 as the threshold for significant correlation, this correspond to r.0.7 as the threshold for correlation when constructing networks in each of eight groups of mice, andr.0.4 when constructing shared network for all 40 mice. We have also tried other correlation indices, including the percentage bend correlation index [19], and found no significant difference in results obtained.
Fisher’s exact test was used to evaluate enhancement in pathway interaction as compared to the KEGG annotation, and multiple testing was corrected using the false discovery rate (FDR) [20].
Topological analysis and visualization of the trait-pathway network
A Java script based on the Cytoscape library was developed to analyze the topological properties of the trait-pathway network, including the network degrees, betweenness, and the distributions of linking pathways and ‘‘hub’’ pathways in different tissues. Edge betweenness, i.e.the fraction of shortest paths between all other nodes that pass through a given node in the network, were determined adopting Ulrik Brandes’ algorithm [21]. The MCODE Cytoscape plug-in [22] was used to identify densely connected subregions of the network, namely, clusters of highly interactive pathways. These clusters are usually of core importance for the function of the whole network. Pajek [23] (http://pajek. imfm.si/) was used to visualize trait pathway network with partition of the nodes based on pathway category and tissues types.
Results
Associating tissue specific pathways and T2D quantitative traits
Using all animals, we identified a number of trait-relevant tissue-specific KEGG pathways: 186 for insulin, 32 for glucose, 19 for islet number, 34 for PAI1, 100 for resistin, 107 for TG, 209 for weight, and 9 for adiponectin. Table 1 lists the top tissue-specific pathways that are significantly correlated with the plasma insulin level. Many studies have suggested the relevance of these pathways to obesity and diabetes, such as Biosynthesis of unsaturated fatty acids, Fatty acid biosynthesis, Butanoate metabolism, and Oxidative phosphorylation [4]. The complete list of trait relevant pathways is available in Table S1.
The co-expression of KEGG pathways were determined based on their linkage annotated in KEGG and the correlative variations in their PCI. We found that the pathways annotated to be linked by the KEGG database share high PCI correlation both intra and
cross tissue. The correlation is significant even after adjusting for the number of shared genes between the different pathways (data not shown). The cross tissue pathway co-expression is likely brought about by the communication between different tissues and suggests the importance of characterizing such crosstalk during disease.
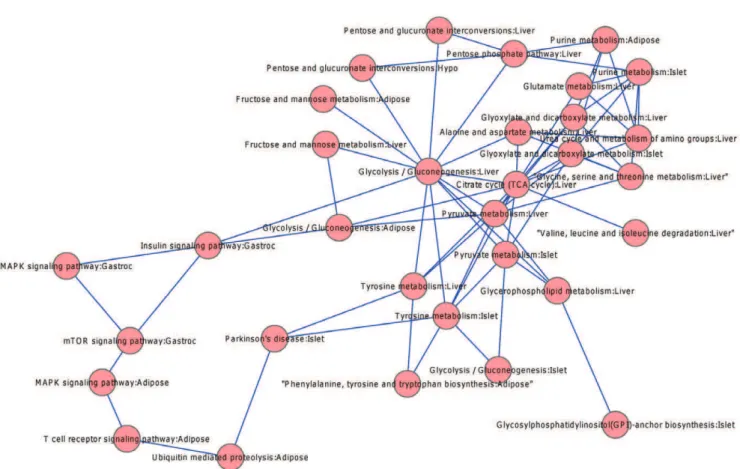
Utilizing the trait-relevant and trait-linking pathways and the pathway co-expression network, we constructed the trait-pathway network, which is given in Figure 2. The association among the 8 T2D traits and communications between different tissues are depicted through the trait-pathway and the pathway-pathway links. In total there are 192 trait linking pathways in the Direct-network, 228 in Path2-network, and 352 in Path3-network. The final network contains 405 pathway/tissue nodes and 2099 interactions. Note that each node has two attributes: {pathway, tissue}. A SIF version of
Table 1.Top insulin-relevant tissue-specific KEGG pathways.
Tissue Pathway
Liver Biosynthesis of unsaturated fatty acids
Liver Fatty acid biosynthesis
Islet Phenylalanine metabolism
Liver Benzoate degradation via CoA ligation
Liver Glycerophospholipid metabolism
Islet Biotin metabolism
Islet Benzoate degradation via CoA ligation
Islet Lysine biosynthesis
Adipose Systemic lupus erythematosus
Islet Glycosylphosphatidylinositol(GPI)-anchor biosynthesis
Islet Bisphenol A degradation
Adipose Aminosugars metabolism
Adipose Gap junction
Liver Butanoate metabolism
Liver PPAR signaling pathway
Islet Ribosome
Adipose Non-small cell lung cancer
Liver Pentose phosphate pathway
Liver Glutathione metabolism
Adipose Melanoma
Islet Protein export
Liver Geraniol degradation
Liver Starch and sucrose metabolism
Adipose Fc epsilon RI signaling pathway
Islet Nucleotide sugars metabolism
Islet Oxidative phosphorylation
Liver Pyruvate metabolism
Liver Valine, leucine and isoleucine degradation
Islet D-Arginine and D-ornithine metabolism
Liver Thiamine metabolism
Liver Bile acid biosynthesis
Liver Metabolism of xenobiotics by cytochrome P450
Adipose Renal cell carcinoma
Adipose SNARE interactions in vesicular transport
Adipose Glioma
network was put into Cytoscape webcast and is available at http:// zen.dom.uab.edu:8080/pathwaynetwork/cytoscape/, where one can view the details of the network with several built-in operations and examine each node and its neighbors. Most of the pathways are metabolism or inflammation related, which is consistent with the current understanding of T2D. To appreciate the general theme of this very complex figure, pathways that are in the same tissue and are from the same KEGG pathway categories were clustered together. The categories include Metabolism, Genetic information processing, Environment information processing, Cellular possesses (some pathways in this category were later taken out and expanded into a new category: Organismal systems), and Human diseases. The presence of pathway members from each category is further evaluated using Fisher’s exact test. The results for all 30 clusters (5 KEGG categories66 tissues) are given in Table 2. We found that in some tissues, members of certain pathway categories exhibit significantly enhanced presentation in the trait-pathway network. The top 3 clusters are Metabolism pathways in liver, islet and adipose tissue, indicating that they are the most active and interactive and, hence, the most relevant to disease traits. Four out of five pathway categories are active in the adipose tissue, which suggests a primary involvement of this tissue in obesity-induced diabetes.
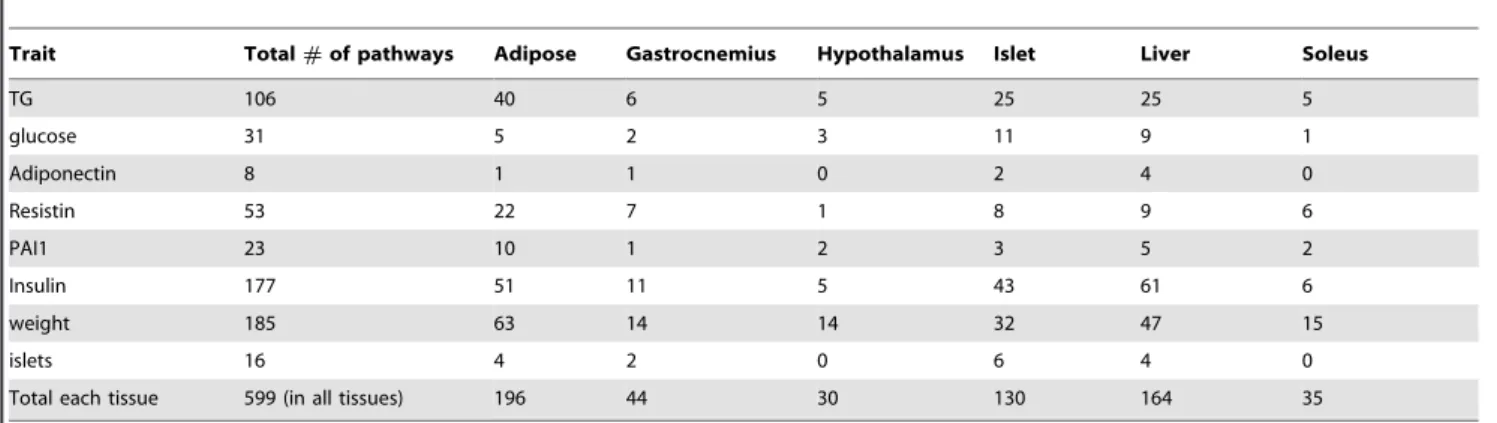
It was previously observed that known disease genes generally exhibit tissue specific activity, with expression levels altered in the tissues where specific gene defects cause pathology [8,24]. Therefore we also examined the distribution of the trait-linking pathways in the six T2D relevant tissues. The results are listed in Table 3. Evidently, the pathways are not equally distributed in the six tissues. Adipose tissue contains the largest number of trait-linking pathways for all traits, consistent with the fact that obesity is the primary cause of T2D in this animal model. In addition, the eight traits have a wide range of linking pathways. Weight possesses the most, again maybe an indication of the central role of obesity in T2D. Insulin level has the second largest number, which fits well with the fact that impaired compensatory insulin secretion under obesity is also a causal factor in T2D.
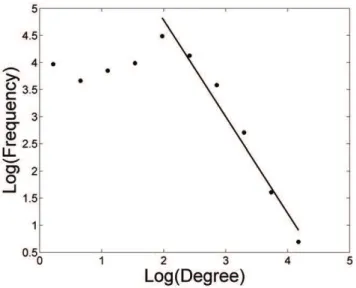
Topological properties of the trait-pathway network We first investigated the global topological properties of the trait-pathway networks in all six tissues. The degree distribution of
the network nodes is given in Figure 3. Interestingly it exhibits a mixed behavior. While for nodes with degrees higher than 8 there is clearly a power-law dependence, the frequencies for nodes with degree below 8 are flat. This is different from the scale-free networks typically observed with gene or protein networks. The leveling off at the low degree end suggests that there are not as many nodes with very low number of interactions as in a scale free network. This is reasonable for a KEGG pathway network, as these pathways are all of important functions and their interactions are well annotated.
The power-law dependence at degrees .8 is indicative of a small proportion of pathways serving as hub nodes that connect to a large number of other pathways. In the study of gene or protein networks, highly connected nodes are often considered important to network function. For instance, analysis of the yeast protein-protein interaction network revealed that the highly connected genes are more likely to be essential for survival [25]. It is tempting to hypothesize here that the highly-connected pathways in the trait-pathway network are the most relevant to the obesity induced T2D. Table 4 lists the top 20 highly connected tissue-specific pathways. The most connected pathway is mmu00010, Glycoly-sis/Gluconeogenesis in the liver, which interacts with 82 other pathways. Its degrees in adipose tissue and islet are also high, 40 and 30, respectively. T2D is a complex disorder where diminished insulin secretion and impaired insulin action together lead to chronic hyperglycemia. The glucose metabolic pathways play an important role in the pathogenesis of the disease. For instance, glycolysis is a critical step in the signaling pathway of glucose stimulated insulin secretion in islets [26]. Abnormalities in them have been observed in diabetic subjects [27].
The citric acid cycle (TCA) is series of chemical reactions used by all aerobic organisms to generate energy. It breaks down pyruvates from glycolysis (and other pathways), and generates ATP by oxidative phosphorylation. The importance of the TCA cycle and the pyruvate metabolism pathway in obesity and T2D has been demonstrated [28,29]. TCA cycle and/or oxidative phosphorylation flux is known to be reduced in diabetes compared to healthy controls [30,31]. Additionally some evidence suggests that the reduced TCA flux may be of primary origin and may control several major diabetic phenotypes including the increased basal glucose uptake, increased basal glucose oxidation, and Figure 2. The trait-pathway network of T2D.The pathways are clustered based on tissue type and KEGG pathway category. The largest clusters are the metabolic pathways in adipose and liver.
Table 2.The pathway categories in the trait-pathway network.
Index1 KEGG pathway category Tissue
Fisher p-value, Over-representation
Fisher p-value, under-representation
25 Metabolism Liver 2.91E-09 1
20 Metabolism Islet 3.63E-06 1
5 Metabolism Adipose 0.0019 1
1 Human diseases Adipose 0.0038 0.998
2 Cellular possesses Adipose 0.0038 0.998
3 Environment information processing Adipose 0.040 0.984
4 Genetic information processing Adipose 0.090 0.961
8 Environment information processing Gastrocnemius 0.388 0.772
14 Genetic information processing Hypothalamus 0.474 0.710
18 Genetic information processing Islet 0.474 0.710
9 Genetic information processing Gastrocnemius 0.580 0.623
23 Genetic information processing Liver 0.580 0.623
29 Genetic information processing Soleus 0.580 0.623
28 Environment information processing Soleus 0.904 0.237
17 Cellular possesses Islet 0.920 0.164
22 Cellular possesses Liver 0.920 0.164
15 Metabolism Hypothalamus 0.952 0.0766
16 Human diseases Islet 0.961 0.0951
7 Cellular possesses Gastrocnemius 0.984 0.0481
11 Human diseases Hypothalamus 0.984 0.0481
10 Metabolism Gastrocnemius 0.986 0.0253
19 Environment information processing Islet 0.993 0.0443
24 Environment information processing Liver 0.993 0.0443
21 Human diseases Liver 0.994 0.0202
26 Human diseases Soleus 0.994 0.0203
30 Metabolism Soleus 0.999 0.0033
6 Human diseases Gastrocnemius 1 0.0015
27 Cellular possesses Soleus 1 0.0015
13 Environment information processing Hypothalamus 1 0.0101
12 Cellular possesses Hypothalamus 1 0.000201
1: Cluster index in Figure 1.
doi:10.1371/journal.pone.0044544.t002
Table 3.Distribution of trait-linking pathways in six tissues.
Trait Total#of pathways Adipose Gastrocnemius Hypothalamus Islet Liver Soleus
TG 106 40 6 5 25 25 5
glucose 31 5 2 3 11 9 1
Adiponectin 8 1 1 0 2 4 0
Resistin 53 22 7 1 8 9 6
PAI1 23 10 1 2 3 5 2
Insulin 177 51 11 5 43 61 6
weight 185 63 14 14 32 47 15
islets 16 4 2 0 6 4 0
Total each tissue 599 (in all tissues) 196 44 30 130 164 35
reduced complete lipid oxidation [32]. In addition pyruvate is metabolized in pancreatic islets, though the extent and mechanism of this metabolism remains unclear.
Edge betweenness, which measures the fraction of shortest paths going through a node, is an important centrality index [33]. It captures the influence that an individual node has in the spread of information within the network [33]. In yeast it was observed that
proteins with high betweenness are more likely to be essential [34]. The top pathways with highest betweenness in our trait-pathway network are listed in Table 5. Insulin signaling pathway in gastrocnemius ranks second among all pathways. It interacts with several other pathways important in glucose homeostasis [27]. Insulin increases glucose uptake and metabolism in skeletal muscle by signal transduction via protein phosphorylation cascades. Some downstream intermediates in the insulin signaling pathways govern glucose homeostasis and can lead to skeletal muscle insulin resistance in T2D [35]. Insulin action on signal transduction is impaired in skeletal muscle from T2D subjects, and the dysfunction is key to T2D development [36]. The MAPK signaling, together with T cell receptor signaling pathway, constitute another pathologically meaningful component relevant to obesity induced diabetes: the inflammation in adipose tissue [37–39].
In scale-free networks, high degree nodes tend to have high betweenness. In our trait-pathway network, most of the pathways with high betweenness also have high degree (compare Table 5 with Table 4, 8 of the 20 elements are shared). Figure 4 depicts the subnetwork of the top high-degree and high-betweenness path-ways listed in Tables 4 and 5. We hypothesize that together they constitute a signature pathway network core of T2D, which provides a picture of the primary molecular basis of T2D pathogenesis.
Densely connected subregions of the trait-pathway network
Using MCODE [22] we found that the trait-pathway network contains a number of densely connected subregions. The top 2 are displayed in Figure 5. They contain 8 nodes and 20 edges, and 9 nodes and 14 edges, respectively.
Figure 3. The degree distribution of the trait-pathway network. Axes are in natural base log scale. The network degree (number of interactions with other pathways) of pathways was log transformed and allocated into 10 evenly spaced bins. Plotted are the frequency counts in each bin against the bin center value.
doi:10.1371/journal.pone.0044544.g003
Table 4.Top 20 tissue-specific pathways with highest degrees.
Tissue Pathway Description Degree
Liver mmu00010 Glycolysis/Gluconeogenesis 82
Liver mmu00020 Citrate cycle (TCA cycle) 55
Liver mmu00252 Alanine and aspartate metabolism 46
Liver mmu00620 Pyruvate metabolism 45
Adipose mmu00010 Glycolysis/Gluconeogenesis 40
Liver mmu00260 Glycine, serine and threonine metabolism 37
Islet mmu00620 Pyruvate metabolism 37
Liver mmu00030 Pentose phosphate pathway 34
Islet mmu00230 Purine metabolism 33
Islet mmu00630 Glyoxylate and dicarboxylate metabolism 32
Islet mmu00010 Glycolysis/Gluconeogenesis 30
Liver mmu00630 Glyoxylate and dicarboxylate metabolism 29
Liver mmu00280 Valine, leucine and isoleucine degradation 26
Hypothalamus mmu00040 Pentose and glucuronate interconversions 26
Adipose mmu00400 Phenylalanine, tyrosine and tryptophan biosynthesis 26
Adipose mmu00230 Purine metabolism 25
Adipose mmu04010 MAPK signaling pathway 25
Liver mmu00040 Pentose and glucuronate interconversions 24
Liver mmu00251 Glutamate metabolism 24
Liver mmu00220 Urea cycle and metabolism of amino groups 24
Table 5.Top 20 tissue-specific pathways with highest betweenness.
Tissue Pathway Description Score
Liver mmu00010 Glycolysis/Gluconeogenesis 34451
Gastrocnemius mmu04910 Insulin signaling pathway 20871
Adipose mmu04120 Ubiquitin mediated proteolysis 16827
Adipose mmu04010 MAPK signaling pathway 12459
Islet mmu00350 Tyrosine metabolism 12147
Adipose mmu00010 Glycolysis/Gluconeogenesis 9971
Liver mmu00020 Citrate cycle (TCA cycle) 9704
Gastrocnemius mmu04150 mTOR signaling pathway 8510
Liver mmu00260 Glycine, serine and threonine metabolism 8480
Adipose mmu04660 T cell receptor signaling pathway 8294
Liver mmu00564 Glycerophospholipid metabolism 7873
Gastrocnemius mmu04010 MAPK signaling pathway 7642.
Liver mmu00620 Pyruvate metabolism 7444
Liver mmu00350 Tyrosine metabolism 7050
Islet mmu00010 Glycolysis/Gluconeogenesis 6789
Adipose mmu00051 Fructose and mannose metabolism 6564
Liver mmu00051 Fructose and mannose metabolism 6330
Islet mmu00563 Glycosylphosphatidylinositol (GPI)-anchor biosynthesis 6203
Islet mmu00230 Purine metabolism 5813
Islet mmu05020 Parkinson’s disease 5681
doi:10.1371/journal.pone.0044544.t005
7 out of the 8 pathways in the first cluster are in liver tissue. As discussed in the previous sections, glycolysis, TCA cycle, and pyruvate metabolism pathways are well known to be T2D related. Protein tyrosine phosphatase 1B (PTP1B) has been found to be a major regulator of body fat stores, energy balance, and insulin sensitivity in vivo. Increased expression of PTP1B is associated with insulin resistance in rodents and humans whereas deletion of PTP1B leads to leanness and insulin sensitivity in rodents [40]. Propionate can lower blood glucose and alters lipid metabolism in healthy subjects [41].
8 out of the 9 pathways in the second cluster are in adipose tissue. MAPKs are intracellular signaling pathways that play a pivotal role in many essential cellular processes such as prolifer-ation and differentiprolifer-ation, specifically in adipocyte differentiprolifer-ation
and obesity [42]. Transforming growth factor-beta/Smad3 signaling regulates insulin gene transcription and pancreatic islet b-cell function [43]. Impaired insulin signaling andb-cell function is critical to obesity induced diabetes. Wnt signaling plays an important role in intestinal tumorigenesis and has been linked to susceptibility to T2D [44]. Carriers of variants of the transcription factor 7-like 2 gene, an important component of the Wnt pathway, are at increased risk for developing T2D. The modulation of proglucagon expression by Wnt activity may partially explain the link between Wnt signaling and diabetes. Insulin resistance-inducing cytokines differentially regulates SOCS mRNA expres-sion via growth factor- and Jak/Stat-signaling pathways in 3T3-L1 adipocytes [45].
Figure 5. Pathway composition of the top 2 densely connected subregions of the whole trait-pathway network. doi:10.1371/journal.pone.0044544.g005
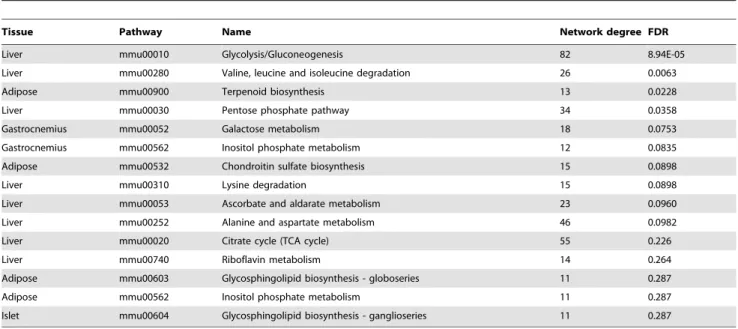
Table 6.Top pathways with highest degree after adjusted by the number of curated interactions.
Tissue Pathway Name Network degree FDR
Liver mmu00010 Glycolysis/Gluconeogenesis 82 8.94E-05
Liver mmu00280 Valine, leucine and isoleucine degradation 26 0.0063
Adipose mmu00900 Terpenoid biosynthesis 13 0.0228
Liver mmu00030 Pentose phosphate pathway 34 0.0358
Gastrocnemius mmu00052 Galactose metabolism 18 0.0753
Gastrocnemius mmu00562 Inositol phosphate metabolism 12 0.0835
Adipose mmu00532 Chondroitin sulfate biosynthesis 15 0.0898
Liver mmu00310 Lysine degradation 15 0.0898
Liver mmu00053 Ascorbate and aldarate metabolism 23 0.0960
Liver mmu00252 Alanine and aspartate metabolism 46 0.0982
Liver mmu00020 Citrate cycle (TCA cycle) 55 0.226
Liver mmu00740 Riboflavin metabolism 14 0.264
Adipose mmu00603 Glycosphingolipid biosynthesis - globoseries 11 0.287
Adipose mmu00562 Inositol phosphate metabolism 11 0.287
Islet mmu00604 Glycosphingolipid biosynthesis - ganglioseries 11 0.287
Context specific network reveals the importance of the OXPHOS and the T cell receptor signaling pathway in obesity-induced diabetes
The trait-pathway network presented in Figure 2 is constructed using both existing information of pathway links annotated in KEGG and the expression data specific to the animals of an obesity-induced diabetes model. The pathway interactions anno-tated by KEGG are not specific to obesity or diabetes. They are generic summaries of the most common denominator from many instances and likely represent the most conserved parts of the interaction network. On the other hand, the expression data offers insight into the activities occurring in the animal model and hence information more specific to the disease under investigation. Using Fisher’s exact test we identified pathways where the expression data brought in significantly more interaction linkages. The top 15 pathways are given in table 6. Most of them are in liver and adipose, suggesting that pathway interactions are most active in these tissues during the obesity development.
Furthermore, we constructed a group-specific network for each of the 8 animal groups in addition to the global network for all animals. The networks in Cytoscape, viewable SIF format files, are given in Figure S1, which is also available at http://zen.dom.uab.
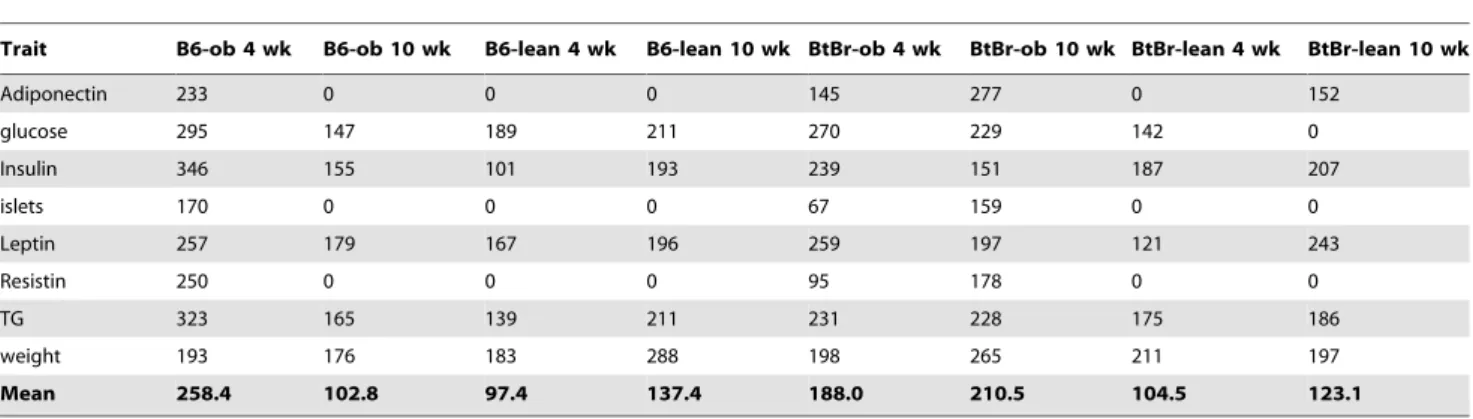
edu:8080/pathwaynetwork/cytoscape. The basic network charac-teristics include the total number of nodes and edges are summarized in Table S2. Table 7 lists the number of trait relevant pathways in each of the eight networks. Interestingly, while in general the number increases moderately from 4 wk to 10 wk for most animals, the B6 ob 10 wk animals showed a significant drop, from 258.4 in average to 102.8. These are obese animals that do not develop diabetes. The pathways with enhanced interactions compared to KEGG annotations are given in the Table S3. The most interesting patterns are again observed in the B6-obese-10 wk group, which does not develop diabetes; and in the BTBR-obese-10 wk group (Table 8), which is diabetic. Together they suggest that in both groups the pathways relevant to glucose metabolism and oxidative stress are interacting actively with other pathways in these animals. In the BTBR-obese-10 wk group additional pathways relevant to inflammations are also active, suggesting that they may be the key differentiating factor that determines why some obese animals develop diabetes and some do not. It is known that obesity is associated with a state of chronic, low-grade inflammation [37]. Inflammatory and stress responses mediate insulin resistance. Obesity-induced
inflamma-Table 7.Number of trait-relevant pathways in each of the eight animal groups.
Trait B6-ob 4 wk B6-ob 10 wk B6-lean 4 wk B6-lean 10 wk BtBr-ob 4 wk BtBr-ob 10 wk BtBr-lean 4 wk BtBr-lean 10 wk
Adiponectin 233 0 0 0 145 277 0 152
glucose 295 147 189 211 270 229 142 0
Insulin 346 155 101 193 239 151 187 207
islets 170 0 0 0 67 159 0 0
Leptin 257 179 167 196 259 197 121 243
Resistin 250 0 0 0 95 178 0 0
TG 323 165 139 211 231 228 175 186
weight 193 176 183 288 198 265 211 197
Mean 258.4 102.8 97.4 137.4 188.0 210.5 104.5 123.1
doi:10.1371/journal.pone.0044544.t007
Table 8.Pathways with the most significant interactions in the BTBR obese 10 week mice.
Tissue Pathway Name
Network
degree p-value FDR
Hypothalamus mmu00190 Oxidative phosphorylation 27 8.5E-07 0.00063
Islet mmu04660 T cell receptor signaling pathway 58 1.1E-05 0.0080
Soleus mmu05332 Graft-versus-host disease 35 0.00045 0.331
Adipose mmu05332 Graft-versus-host disease 35 0.00045 0.331
Adipose mmu05320 Autoimmune thyroid disease 31 0.00065 0.477
Gastrocnemius mmu00190 Oxidative phosphorylation 20 0.00072 0.532
Adipose mmu04510 Focal adhesion 20 0.00072 0.532
Adipose mmu04940 Type I diabetes mellitus 16 0.00076 0.556
Hypothalamus mmu05012 Parkinsons disease 30 0.0012 0.911
Adipose mmu05330 Allograft rejection 30 0.0012 0.912
Adipose mmu05012 Parkinsons disease 30 0.0012 0.912
Gastrocnemius mmu00760 Nicotinate and nicotinamide metabolism 23 0.0013 0.934
Gastrocnemius mmu04514 Cell adhesion molecules (CAMs) 43 0.0013 0.978
tion and the signaling pathways at the intersection of metabolism and inflammation contribute to diabetes.
In more detail, the top overrepresented pathways and their first neighbors in the diabetic BTBR-obese-10 wk group are displayed in Figure 6. The top pathways include oxidative phosphorylation in hypothalamus and T cell receptor signaling in islet. Recently, increasing experimental and clinical evidence suggests that hypothalamic dysregulation may be one of the underlying mechanisms of abnormal glucose metabolism and may underlie at least some portion of T2D or insulin resistance in humans [46]. Hypothalamus shares with pancreas several commonly expressed molecules that are critical in glucose sensing and inhibition of insulin action on hepatic gluconeogenesis. Mouse model studies revealed that obesity induced hypothalamic resistance to insulin may be involved in pathogenesis of peripheral insulin resistance [47]; however, the exact role and mechanism of hypothalamus involvement in T2D is still not clear.
Microarray studies have shown that genes involved in oxidative phosphorylation (OXPHOS) exhibit reduced expression levels in the skeletal muscle of T2D and prediabetic subjects. These changes may be mediated by the peroxisome proliferator– activated receptor c coactivator-1 (PGC1) pathway. Decreased expression of PGC1a- and PGC1b-responsive OXPHOS genes in muscle, and of genes involved in oxidative phosphorylation in pancreatic islets, were observed in T2D patients [10,31]. The importance of OXPHOS genes are also supported by genetics
study [48]. Our analysis results for the first time revealed that the OXPHOS pathway is actively interacting with other pathways in hypothalamus in diabetic animals, suggesting that oxidative stress in hypothalamus may be the underlying mechanism in obesity induced diabetes.
One critical contributing factor to obesity induced diabetes is the inadequate insulin secretion resulting fromb-cell death [49]. The death occurs as a consequence of increased circulating glucose, saturated fatty acids, adipocyte secreted factors, and chronic activation of the innate immune system. In both type 1 and type 2 diabetes intra-islet inflammatory mediators seem to trigger a final common pathway leading tob-cell apoptosis. Anti-inflammatory therapeutic approaches designed to block b-cell apoptosis could be a significant new development [50]. The active role identified here of the T cell receptor signaling pathway can help to narrow down the potential therapeutic targets.
Discussion
In this study, we proposed an approach to build tissue-specific, disease trait-pathway networks through associating co-activated pathways, and trait-relevant and trait-linking pathways. Our strategy goes beyond single gene based analysis. It utilizes the PCI to capture the overall activity of each pathway under given experimental conditions, which incorporates contributions from both the individual genes and how they are geometrically situated Figure 6. Trait-pathway network for the BTBR obese 10 week mice.Nodes are the quantitative traits and pathways with FDR,0.3 and their first-degree neighbors. Node sizes are defined by the enhancement significance of node degree (5thcolumn, p-value, of Table 8).
in the network. The PCI measure is then used to infer interactions between pathways and between T2D traits and pathways. To our knowledge, this is the first of its kind that delineates the disease traits at the genetic pathway level.
The new approach revealed a number of findings compared to original analysis by the authors that generated the dataset [7]. It identified a set of pathways that are responsible for the association among the main T2D traits. The cross tissue pathway networks highlighted communication among the insulin releasing and insulin target tissues. Topological analysis of the network revealed that many pathways that are of topological importance to the network, i.e., those with high degree and high betweenness, are closely involved in glucose metabolism and insulin. A core of pathway clusters was identified that may provide a relatively complete view of the key pathways and their interactions that potentially mediate disease pathophysiology for T2D. In a group-specific analysis, we found a difference in active pathways between the obese animals that developed diabetes and those that did not. While those involved in glucose metabolism and oxidative stress are interactive in both groups, those involved in inflammation exhibit enhanced interaction with other pathways only in the obese animals that develop diabetes. We believe that such multi-scale (genes, pathways, and tissues) systems analysis will provide valuable insight into disease etiology and is essential to better understand the pathophysiology and the pathogenesis of a complex disease like T2D.
Obesity induced diabetes is a complex issue; multiple pathways in many tissues are involved. The bioinformatics study presented in this work offers a glimpse of the underlying genetic architecture. There are still many questions to be answered. For instance, in table 7, we see that, in general, the number of trait-relevant pathways increases with age (which is itself a risk factor for obesity and diabetes). The obese animals that do not develop diabetes show a marked reduction in the number of trait-relevant pathways. It is very intriguing then whether the pathways that showed differential trait-relevance contain key information as to why some obese individuals develop diabetes while some don’t. These deserve further investigation in future.
In this study we only analyzed data from two mouse strains. It will be interesting to compare the trait-pathway networks across different models of T2D, which would be valuable to
understand-ing the disease etiology and how well each model represents the human disease. This approach can be generalized from the analysis of multiple traits of one disease to the interrelations among a set of different diseases. Then diseases can be linked through their relevant and linking pathways. The problem of associating multiple diseases is subsequently converted to the problem of network comparison. Finally, it would also be of interest to study trait-pathway networks in general across different species. The results will shed light to the functional evolution of related pathways and pathway interactions.
Supporting Information
Table S1 The tissue-specific pathways relevant to each trait.
(XLS)
Table S2 Network measures, including the total num-ber of nodes and edges, of the trait relevant pathway network in each of weight animal groups.
(XLSX)
Table S3 Pathways with enhanced interactions in each of the eight animal groups.
(XLSX)
Figure S1 Trait-pathway networks in 8 groups in Cytoscape viewable SIF format. (A) B6 lean 4 week. (B) B6 lean10 week. (C) B6 obese 4 week. (D) B6 obese 10 week. (E) BTBR lean 4 week. (F) BTBR lean10 week. (G) BBR obese 4 week. (G) BTBR obese 10 week.
(ZIP)
Acknowledgments
We thank Alan Attie and Mark Keller in University of Wisconsin for proving the clinical traits and expression data for this study.
Author Contributions
Conceived and designed the experiments: SG XW. Performed the experiments: SG HKR XW. Analyzed the data: SG HKR XW. Contributed reagents/materials/analysis tools: SG XW. Wrote the paper: SG XW.
References
1. Barabasi AL, Oltvai ZN (2004) Network biology: understanding the cell’s functional organization. Nat Rev Genet 5: 101–113.
2. Wu X, Jiang R, Zhang MQ, Li S (2008) Network-based global inference of human disease genes. Mol Syst Biol 4: 189.
3. Hu H, Li X (2008) Networking pathways unveils association between obesity and non-insulin dependent diabetes mellitus. Pac Symp Biocomput: 255–266. 4. Kahn SE, Hull RL, Utzschneider KM (2006) Mechanisms linking obesity to
insulin resistance and type 2 diabetes. Nature 444: 840–846.
5. Palumbo PJ (2004) The case for insulin treatment early in type 2 diabetes. Cleve Clin J Med 71: 385–386, 391–382, 394 passim.
6. Lusis AJ, Attie AD, Reue K (2008) Metabolic syndrome: from epidemiology to systems biology. Nat Rev Genet 9: 819–830.
7. Keller MP, Choi Y, Wang P, Davis DB, Rabaglia ME, et al. (2008) A gene expression network model of type 2 diabetes links cell cycle regulation in islets with diabetes susceptibility. Genome Res 18: 706–716.
8. Dobrin R, Zhu J, Molony C, Argman C, Parrish ML, et al. (2009) Multi-tissue coexpression networks reveal unexpected subnetworks associated with disease. Genome Biol 10: R55.
9. Subramanian A, Tamayo P, Mootha VK, Mukherjee S, Ebert BL, et al. (2005) Gene set enrichment analysis: a knowledge-based approach for interpreting genome-wide expression profiles. Proc Natl Acad Sci U S A 102: 15545–15550. 10. Mootha VK, Lindgren CM, Eriksson KF, Subramanian A, Sihag S, et al. (2003) PGC-1alpha-responsive genes involved in oxidative phosphorylation are coordinately downregulated in human diabetes. Nat Genet 34: 267–273. 11. Li Y, Agarwal P (2009) A pathway-based view of human diseases and disease
relationships. PLoS One 4: e4346.
12. Girvan M, Newman ME (2002) Community structure in social and biological networks. Proc Natl Acad Sci U S A 99: 7821–7826.
13. Gao S, Wang X (2007) TAPPA: topological analysis of pathway phenotype association. Bioinformatics 23: 3100–3102.
14. Gao S, Wang X (2009) Identification of active gene modules during pancreatic development. Online Journal of Bioinformatics 10: 191–200.
15. Gao S, Wang X (2011) Topology-based scoring method for identification of responsive protein–protein interaction subnetwork. Bioinformatics and Biomed-icine Workshops (BIBMW), IEEE International Conference on Bioinformatics. Atlanta, GA, USA.: ISBN: 978-1-4577-1612-6.
16. Gao S, Wang X (2009) Predicting Type 1 Diabetes Candidate Genes using Human Protein-Protein Interaction Networks. Journal of Computer Science & Systems Biology 2: 133–146.
17. Gao S, Jia S, Hessner MJ, Wang X (2012) Predicting disease related subnetworks for type 1 diabetes using a new network activity score Omics Accepted. 18. Guan Y, Myers CL, Lu R, Lemischka IR, Bult CJ, et al. (2008) A genomewide
functional network for the laboratory mouse. PLoS Comput Biol 4: e1000165. 19. Wilcox RR (2003) Applying Contemporay Statistical Techniques.
20. Benjamini Y, Drai D, Elmer G, Kafkafi N, Golani I (2001) Controlling the false discovery rate in behavior genetics research. Behav Brain Res 125: 279–284. 21. Brandes U (2001) A Faster Algorithm for Betweenness Centrality. Journal of
Mathematical Sociology 25: 163.
22. Bader GD, Hogue CW (2003) An automated method for finding molecular complexes in large protein interaction networks. BMC Bioinformatics 4: 2. 23. Batagelj V, Mrvar A (2004) Graph drawing software: Pajek-analysis and
24. Lage K, Hansen NT, Karlberg EO, Eklund AC, Roque FS, et al. (2008) A large-scale analysis of tissue-specific pathology and gene expression of human disease genes and complexes. Proc Natl Acad Sci U S A 105: 20870–20875. 25. Jeong H, Mason SP, Barabasi AL, Oltvai ZN (2001) Lethality and centrality in
protein networks. Nature 411: 41–42.
26. Rocheleau JV, Head WS, Nicholson WE, Powers AC, Piston DW (2002) Pancreatic islet beta-cells transiently metabolize pyruvate. J Biol Chem 277: 30914–30920.
27. Webber J (1998) Abnormalities in glucose metabolism and their relevance to nutrition support in the critically ill. pp. 191–194.
28. Frayn KN (2003) The glucose-fatty acid cycle: a physiological perspective. Biochem Soc Trans 31: 1115–1119.
29. Suhail M, Rizvi S (1989) Effect of type I (insulin-dependent) diabetes mellitus on key glycolytic enzymes of red blood cells. Acta Diabetol Lat 26: 315–320. 30. Newgard CB, An J, Bain JR, Muehlbauer MJ, Stevens RD, et al. (2009) A
branched-chain amino acid-related metabolic signature that differentiates obese and lean humans and contributes to insulin resistance. Cell Metab 9: 311–326. 31. Patti ME, Butte AJ, Crunkhorn S, Cusi K, Berria R, et al. (2003) Coordinated reduction of genes of oxidative metabolism in humans with insulin resistance and diabetes: Potential role of PGC1 and NRF1. Proc Natl Acad Sci U S A 100: 8466–8471.
32. Gaster M (2009) Reduced TCA flux in diabetic myotubes: A governing influence on the diabetic phenotype? Biochem Biophys Res Commun 387: 651–655. 33. Newman MEJ (2005) A measure of betweenness centrality based on random
walks. Social Networks 27: 39–54.
34. Maliackal Poulo Joy AB, Donald E. . Ingber, Sui Huang (2005) High-Betweenness Proteins in the Yeast Protein Interaction Network. Journal of Biomedicine and Biotechnology.
35. Karlsson H, Zierath J (2007) Insulin signaling and glucose transport in insulin resistant human skeletal muscle. Cell Biochemistry and Biophysics 48: 103–113. 36. Ogawa W, Kasuga M (2006) Insulin signaling and pathophysiology of type 2
diabetes mellitus. Japanese journal of clinical medicine 64: 1381.
37. Wellen KE, Hotamisligil GS (2005) Inflammation, stress, and diabetes. The Journal of clinical investigation 115: 1111–1119.
38. Vodenik B, Rovira J, Campistol JM (2009) Mammalian target of rapamycin and diabetes: what does the current evidence tell us? Transplant Proc 41: S31–38. 39. Olefsky JM, Glass CK (2010) Macrophages, inflammation, and insulin
resistance. Annu Rev Physiol 72: 219–246.
40. Mirela D, Nimesh M (2009) PROTEIN TYROSINE PHOSPHATASE 1B (PTP1B) IN OBESITY AND TYPE 2 DIABETES.
41. Todesco T, Rao AV, Bosello O, Jenkins DJ (1991) Propionate lowers blood glucose and alters lipid metabolism in healthy subjects. Am J Clin Nutr 54: 860– 865.
42. Bost F, Aouadi M, Caron L, Binetruy B (2005) The role of MAPKs in adipocyte differentiation and obesity. Biochimie 87: 51–56.
43. Lin HM, Lee JH, Yadav H, Kamaraju AK, Liu E, et al. (2009) Transforming growth factor-beta/Smad3 signaling regulates insulin gene transcription and pancreatic islet beta-cell function. J Biol Chem 284: 12246–12257.
44. Bordonaro M (2009) Role of Wnt signaling in the development of type 2 diabetes. Vitam Horm 80: 563–581.
45. Fasshauer M, Kralisch S, Klier M, Lossner U, Bluher M, et al. (2004) Insulin resistance-inducing cytokines differentially regulate SOCS mRNA expression via growth factor- and Jak/Stat-signaling pathways in 3T3-L1 adipocytes. J Endocrinol 181: 129–138.
46. Koshiyama H, Hamamoto Y, Honjo S, Wada Y, Lkeda H (2006) Hypothalamic pathogenesis of type 2 diabetes. Med Hypotheses 67: 307–310.
47. Bruning JC, Gautam D, Burks DJ, Gillette J, Schubert M, et al. (2000) Role of brain insulin receptor in control of body weight and reproduction. Science 289: 2122–2125.
48. Olsson AH, Ronn T, Ladenvall C, Parikh H, Isomaa B, et al. (2011) Two common genetic variants near nuclear-encoded OXPHOS genes are associated with insulin secretion in vivo. Eur J Endocrinol 164: 765–771.
49. Rhodes CJ (2005) Type 2 diabetes-a matter of beta-cell life and death? Science 307: 380–384.