Experiential Teaching of Signal Analysis in Data Acquisition
Systems Course by Virtualization
POSZET Otto
1, VARI-
KAKAS Ștefan
1, PATER Mirela
1, POSZET Anna
21University of Oradea, Romania,
Department of Computers and Information Technology, Faculty of Electrical Engineering and Information Technology, Universității Street, No.1, 410087, Oradea, Romania, E-Mail: [email protected], [email protected], [email protected]
2
High School “Calasantius”, Carei, Romania, Department of Physics,
Iuliu Maniu Street, No.1, 445100 Carei, Romania, E-Mail: [email protected] Abstract – The progress in computer technology
allowed the use of virtual instrumentation in educa-tion. We show how the LabVIEW virtual environment can be used in the data acquisition systems laboratory of computer engineering students. At the end of the paper we present the results of a student survey concer-ning how they have received this way of learconcer-ning.
Keywords: virtual laboratory; data acquisition; LabVIEW; signal analysis.
I. INTRODUCTION
The technological progress of the last decades had serious impact in research and education. Thus the use of information technology results in modern educational systems became a possibility and a need at the same time [1, 2]. In the education, new concepts as distance learning, access to online didactic materials or open universities are available for everyone. Based on these achievements some new requirements have been defined, for example distance laboratories, home measurements, experiments and tests at any time and probably simultaneously with many students.
A. Virtual Laboratories
The accomplishment of a classical distance laboratory is quite difficult because in some cases there are a lot of things to be implemented to assure optimal conditions for the experiments: cameras, robot arms etc. Alternative solutions to the real distance laboratories are the virtual laboratories that can be achieved based on information technology using a virtual world and replacing the physical equipment with remotely accessible virtual instruments [3, 4].
Some demands of these virtual laboratories are [5]: 1) The user interfaces and the behavior of virtual
instrument must be identical with that of the real laboratory equipment.
2) Users have to perceive the work with virtual instruments as though they would work with real equipment.
3) In the virtual world students should be able to collaborate with each other and with the tutor.
Normally the virtual laboratories have some disadvantages compared to the real ones:
1) The laboratory exercises and virtual equipment are simulated and so they cannot reproduce all the aspects of real experiments.
2) A virtual laboratory will never return the feeling of a real experiment.
3) The interactions between students and with the tutor are different and more restricted than in a real laboratory.
B. Data Acquisition Systems Course
An area where this virtualization is relatively easy to achieve is data acquisition, management and distribution (data acquisition and control systems, data acquisition and processing systems) [6, 7, 8]. This kind of systems have special importance today and are widely used in industry (automatic production lines, process monitoring and control), in multimedia (audio and video signal processing, digital signal processing), research (nuclear plants, laboratory equipment) and other fields.
In the computer engineer BSc curriculum of the University of Oradea, the data acquisition and processing systems (DAPS) course is placed in the last (the 4th) year of studies and aims to familiarize the students with the technologies used in data acquisition systems.
In the laboratory classes that belong to the DAPS course, the simulations and modeling can be easily performed using virtual instruments. The LabVIEW working environment of National Instruments provides a lot of virtual instruments that can be configured to accomplish different complex data acquisition, processing and distribution systems [9, 10, 11, 12].
II. SIGNAL ANALYSIS IN DATA ACQUISITION SYSTEMS
Data acquisition systems make the link between the real world of physical quantities and the virtual, digital world of computers. In order to study the physical processes, the nonelectrical quantities should be transformed in electrical signal using transducers. By processing these signals we can obtain information about the supervised physical processes. The processing of signals can be performed with analogue or digital technics.
Data acquisition can be defined as the receiving the signals from the transducers and their digital processing with a computer. Data is received, decoded, processed and used through successive transformations with or without human intervention. Based on the collected information the physical process can be modeled, processing and control strategies and algorithms can be elaborated and optimized. In other words, an acquisition and control system implements a feedback control loop with three main phases: information collecting, decision, action. Corresponding to these phases we can define the three constructive modules of a data acquisition and control system (DACS):
1) Data acquisition part (sensors and transducers, signal conditioning circuits, A/D converters with sample and hold circuits).
2) Processing and control equipment.
3) Data distribution part (D/A converters, signal conditioning circuits, amplifiers, actuators).
Fig. 1. Theoretical structure of a DACS.
The DAPS course lectures follow the architectural components of a DACS. The associated laboratory classes are divided in two parts. In the first laboratories the students study the architecture of a data acquisition board of National Instruments and develop applications in a classical programming language (C++) in order to make measurements with real laboratory instruments (multimeters, oscilloscopes). In the second part they study the LabVIEW environment and develop applications based on configurations of the virtual instruments. By designing the block diagram of the application and the user interface, the program can be elaborated in a very elegant manner and with an increased productivity than with classical programming languages.
The signal analysis is very important in a DACS because after this analysis the computer (with or without human operator intervention) can make decisions regarding the process control [15]. In some special cases, as audio or video signal processing, the signal analysis is crucial, causing an improved quality of images and sounds (error detection and filtration), a lower storage space (compression) and possibility of adding special effects.
As an example, in this work we study the audio signals both mathematically and from the point of view of signal generation and analysis using the LabVIEW environment.
The sounds as mechanical waves
The sounds are longitudinal mechanical waves for which the propagation direction coincides with the oscillation direction. The wave source makes a harmonic oscillating motion defined by the equation:
π ⋅
= t
T 2 sin A
y (1)
where y is the elongation, A the amplitude, T the oscillation period.
The wave propagation can be described by the equation:
λ − π ⋅
= x
T t 2 sin A
y (2)
where x is the position of the observed point.
The propagation speed in the case of longitudinal waves is:
ρ =
ν E (3)
where E is the elasticity module and ρ the substance
density.
The propagation speed at transverse waves is:
µ =
ν T (4)
where T is the string tension and µ the linear density of the medium.
Sounds are characterized by frequency, amplitude and waveform. The waveform is determined by the number and intensity of harmonics. Physically, the harmonics are determined by the standing waves that arise in the sound source (e. g. musical instruments). The standing wave equation is:
λ λ + − π
λ λ + π =
2 2 l 2 T
t 2 sin 2
2 x 2 2 cos A 2
yP (5)
where l is the string length.
Any periodic signal can be synthesized by the finite or infinite sum of sine waves (Fourier series). This sum can have more equivalent forms, one of these is the compact form (cosine waves sum). In the reality, in order to obtain a given precision, it is sufficient the use of a finite number of components. The compact form of Fourier series is presented in equation (6):
Physical Process
Traductors
Signal Conditioning Circuits
Analog –Digital Converters
Digital –Analog Converters Execution and ControlElements
Signal Conditioning Circuits
Digital Processing and Control Equipment
Digital signals processed
Electrical voltage Physical sizes
Electrical voltage
Digital signals
Physical actions
Analog signals processed
( )
(
0 n)
1n n
0 A cos2 nf t
A t
y = +
∑
π⋅ +ϕ∞
= (6)
where f0 is the fundamental frequency, nf0 are the
harmonics (n=1,2,…,n integers), An is the amplitude of
harmonic n, φ_n the phase of harmonic n.
Fig. 2. Synthesis of a square signal based on Fourier series.
In the following, we show the Fourier decomposition of four frequently met in practice signals that are analyzed and synthesized with LabVIEW, as in a student’s laboratory work. The signals waveform and spectral distribution is visualized in LabVIEW.
a. Sine signal:
( )
Usin(
2 1 f t)
2 t f 1 2 cos U
t 0 = π ⋅ 0
π ⋅ −π
=
ν (7)
b. Square signal:
( )
(
π)
+(
π)
+π =
ν sin2 3f t
3 1 t f 2 sin 1 1 U 4
t 0 0
(
)
(
)
π + π +
π
+ sin2 7f t ...
7 1 t f 5 2 sin 5 1 U 4 0
0 (8)
c. Triangle signal:
( )
(
)
(
)
+ π + π π =ν cos2 3f t
3 1 t f 2 cos 1 1 U 8 t 0 2 0 2 2
(
)
(
)
+ π + π π+ cos2 7f t ...
7 1 t f 5 2 cos 5 1 U 8 0 2 0 2 2 (9)
d. Saw-tooth (ramp) signal:
( )
(
π)
−(
π)
+π =
ν sin2 2f t
2 1 t f 2 sin 1 1 U 2
t 0 0
(
)
(
)
π − π +
π
+ sin2 4f t ...
4 1 t f 3 2 sin 3 1 U 2 0
0 (10)
Supposing that we extract N samples in order to analyze a T0 period of the measured signal, then the
sampling frequency will be:
0 T
N s
f = (11)
and the fundamental harmonic frequency (the fundamental frequency) is:
n f T 1 f s 0
0= = (12) Because the fast Fourier transform (FFT) produces a number of N/2 components, results that the maximum component frequency is:
2 f N f 2 N f 2 N
fmax= ⋅ 0= ⋅ s = s (13)
Hence results the Shannon theorem, stating that in order to avoid the down-sampling phenomena (aliasing), the sampling frequency must be at least twice the maximum component frequency of the measured signal.
fs≥ 2·fmax (14)
III. MODELING IN LABVIEW
One of the most advanced modern tools used in data acquisition is the LabVIEW programming environment [1, 6, 7]. Unlike the classical programming languages, LabVIEW is a graphical working environment, where the programs are developed in a graphical way. There are two principal parts of an application: the Block Diagram and the user interface, called the Front Panel.
LabVIEW offers a lot of default modules called virtual instruments (VI), that can be configured as needed. There are also very big mathematical function libraries, operators, data and programming structures, signal analysis and graphical modules, that can be used easily to develop complex applications. All these features make that the visual programming environment is very attractive for the students and offers a very high efficiency in the design and implementation of big projects [14].
In order to understand better the advantages and disadvantages of virtualization, we will ask the students to execute a laboratory exercise both with real, physical equipment and virtual instruments. As an implementation task we will analyze and synthesize different signals using real equipment from a real laboratory (signal generators, oscilloscopes, and signal analyzers) and in the same time we will ask the students to implement the same exercise with virtual instruments using LabVIEW and the sound board as the acquisition hardware.
The LabVIEW application consists in the development of the block diagram and the design of the front panel. Based on the results, the students will be assessed and in the same time we will watch the virtualization efficiency by student survey.
A. Problem specification
The task consists in the generation of signals with different waveforms, frequencies and amplitudes with pulse generators and LabVIEW. Than these signals will be captured with an oscilloscope and a computer using a data acquisition board. The signals will be displayed in time domain (the real waveform) and in frequency domain (FFT spectral analysis). An implementation version could be the capture of externally generated signals provided by a microphone.
In order to be a more attractive work for the students, we will ask that the generated signals should have the musical notes frequencies, ensuring the reproducing of these signals with the computers sound card. It is imposed that every parameter of the signal (frequency, amplitude, waveform) must be adjustable. The generated frequencies have to respect the appropriate mathematic equation of the musical notes, the amplitude must be
cos(3ω0t)
cos(ω0t)
f(t)
cos(ω0t)+cos(3ω0t)
proportional with the generated sounds volume and the waveform selectable from sine, square, triangle and ramp.
The musical notes frequencies can be calculated from a basic (reference) frequency, usually f0=440 Hz,
the tuning fork frequency (the A note). Marking the distance in halftones of the musical note to be calculated to the reference with d, the frequency equation will be:
12 d
0
12 d
0
d f 2 f 2
f = ⋅ = ⋅ (15)
It can be noticed that an octave means the double of the basic frequency: fA2 = f12 = 2f0 = 880 Hz. The
students will set the distances d=0, 1, 2, …, 24 and the program will generate the corresponding musical note with the predefined amplitude and waveform.
Fig. 3. The first application’s Block Diagram – musical note frequencies.
Fig. 4. The second application’s Block Diagram – capturing musical instrument’s real waveforms with the microphone.
IV. RESULTS
After the block diagram development the students have to design the front panel. This interface should be interactive and should allow the setting of the main signal generation parameters and of the results display. LabVIEW offers a lot of controls (numeric and Boolean, buttons, sliders etc.) and visual indicators (numeric indicators, LEDs, oscilloscope screens, 2D and 3D graphics etc.). Students have the possibility to configure the interface as they like.
B. Signal analysis
In the first application we generated signals having 4 types of waveforms (sine, square, triangle, saw-tooth), and their frequency corresponded to frequency of musical notes.
For each signal, we represented the initial waveform and the result of spectral analysis in oscilloscope-type graph indicators and a LED-based indicator.
Fig. 5. The waveform (time-domain) and the spectral dispersion (frequency-domain): sine 440Hz, square 440Hz.
Fig. 6. The waveform (time-domain) and the result of spectral analysis (frequency-domain): sine 440Hz, square 440Hz.
Fig. 7. Waveform sine at 880Hz.
Fig. 8. Waveform square at 880Hz.
Fig. 9. Waveform triangle at 880Hz.
Fig. 10. Waveform saw-tooth at 880Hz.
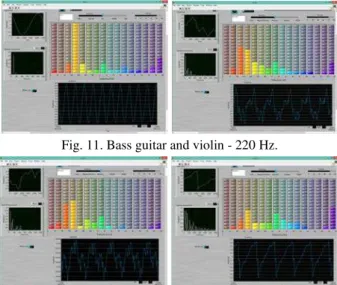
a specified instrument, the amplitude and the form of the audio signals varies in time, in function of many parameters (attack, decay, release, echo, etc.). Examples are shown in the next figures.
Fig. 11. Bass guitar and violin - 220 Hz.
Fig. 12. Piano and Roland EXR5S saw tooth - 220 Hz.
After performing the laboratory exercises with the students, we found that LabVIEW is a strong instrument for signal analysis and synthesis, allowing a much greater flexibility in the experiments than the real equipment: varied range of waveforms, complex signal analysis, and friendly configurable user interface). Another advantage of the virtual environment is that students can work individually, they are not limited by the number of physical stands in the laboratory, they can work remotely or in their free time at home, without the constraint of the laboratory timetable. The disadvantage of LabVIEW against the use of real laboratory equipment is that if we wish to obtain more complex real signals, we cannot rely only on the computer soundboard. Reproducing the signals at physical level can be achieved with a quite expensive special data acquisition board (there are a lot of such boards produced also by National Instruments).
C. Student survey
At the end of the university year we have performed anonymous survey among the students in order to assess how the objectives of the laboratory works were accomplished. The questionnaire referred to the use of LabVIEW in the practical part of the DAPS course. The positive statements we have asked the students to express their opinions on were the following:
1) My interest in the subject grew by the use of virtualization in the laboratories.
2) I could understand better the theoretical concepts presented in the lectures.
3) The laboratories were beneficial for the deepening of practical knowledge in the subject.
4) I could familiarize rapidly with the virtual environment.
5) The laboratory works helped me for the engineer profession.
6) I like more the virtual laboratory as the one based on real measurements.
7) The graphics platform helped me for a better management of the available time for the laboratory works.
8) I had access to the virtual environment from home too.
9) The virtual environment enabled the successful completion of all the laboratory works.
10) The provided laboratory guides were sufficient for the use of the virtual environment.
The students expressed their opinions for each statement on a five-point scale: completely disagree (1), disagree (2), undecided (3), agree (4), completely agree (5). In the survey there were involved a number of 47 students in computer engineering from the University of Oradea. From the statistical analysis of the answers to the particular points of the survey we could make the following significant remarks:
1) 70% agreed that their interest in subject grew due to virtual laboratories;
2) 11% couldn’t easily famialiarize with the virtual environment;
3) 29% are undecided regarding the difference between virtual and real measurements;
4) 18% reported that they could not have access to LabVIEW from home;
5) 82% could perform all the laboratory works in virtual environment;
6) 23% of responders agreed completely with the support materials.
Fig. 13. The global results of the student survey.
A global result of the assessment is presented in the radial diagram of Fig. 13. For all the answers, the weighted mean value of the distribution can be obtained taking into account the occurrence frequencies (ni) of the
random variables (i. e. the five grades, xi) as:
N x n X
5
1 i
i i
∑
=
= = 3.85 (16)
ascending ordered string in two equal halves. For our case this value is 4, which correspond to the global appreciation of „agree” in our investigation.
V. CONCLUSIONS
This paper deals with the study of efficiency in the use of a virtual instrument, namely LabVIEW in the laboratories of students in computer engineering. We presented some specific features that make it adequate to be used in the practical part of the data acquisition and processing systems course. The impact of virtual instrumentation in the students learning was assessed by the interrogation of a sample of students. The survey results highlighted that this mode of activity in the students practice has a favorable reception, but the attention must continue in the development of appropriate and new tutorials for the proposed laboratory works and in the extension to the possibly e-learning laboratories.
REFERENCES
[1] Peter Tiernan, „Enhancing the learning experience of undergraduate technology students with LabVIEW software”, Computers & Education, Vol. 55, Issue 4, pp. 1579-1588, December 2010.
[2] B. Jarosievitz, „ICT use in Science Education”, in A. Méndez-Vilas et al. (Eds), Research, Reflections and Innovations in Integrating ICT in Education: Proceedings of the Fifth International Conference on Multimedia and ICT in Education, Lisbon, 22-24 April 2009, Vol. 1, pp. 382-386, 2009.
[3] Wei Zhan, Jay R. Porter, Joseph A. Morgan, „Experiential Learning of Digital Communication Using LabVIEW”, IEEE Transactions on Education, Vol. 57, No. 1, pp. 34-41, February 2014.
[4] Mauricio N. Frota, Ludwik Finkelstein, „Thoughts on the education in measurement and instrumentation: A review of requirements”, Measurement, Vol. 46, pp. 2978-2982, October 2013.
[5] Veljko Potkonjak, Michael Gardner, Victor Callaghan, Pasi Mattila, Christian Guetl, Vladimir M. Petrovic, Kosta Jovanovic, „Virtual laboratories for education in science,
technology, and engineering: A review”, Computers & Education, Vol. 95, Issue C, pp. 309-327, April 2016. [6] Leng Jianwei1, Shan Chuanbin, „Design of FMCW radar
data acquisition and signal processing system based on Labview”, Applied Mechanics and Materials, Vols. 496-500, pp. 1881-1884, 2014.
[7] Hong min Wang , Dan dan Li,Ping Xue, Jie Zhu, Hai bo Li, „LabVIEW-based data acquisition system design”, IEEE 2012 International Conference on Measurement, Information and Control (MIC), pp. 689-692, May 18-20, 2012.
[8] Guan Xu, Zhang Chun-mei, Wang Shang-jin, „Virtual Instrument Software Labview and Data Acquisition”, Microcomputer Development, Vol. 14, Issue 03, pp. 77-79, 2004.
[9] Zhao Hua, „Application of LabVIEW in the Design of Data Acquisition and Signal Processing System of Mechanical Vibration”, IEEE 2011 International Conference on Mechatronic Science, Electric Engineering and Computer, Jilin, China, pp. 2551-2554, August 19-22, 2011.
[10]H. Q. Liao, Z. R. Qiu, G.H.Feng, „The Design of LDF Data Acquisition System Based on LabVIEW”, ESIAT 2011, Procedia Environmental Sciences, Vol. 10, Part B, pp. 1188-1192, 2011.
[11]Linggang Liu, Junhui Li, Luhua Deng, „Design of Data Acquisition System Based on LabVIEW”, Advanced Materials Research, Vol. 569, pp. 808-813, 2012.
[12]Xie Bing, Chen Chang-xin, Zheng Bin, „Design of Data Acquisition and Signal Processing System Based on LabVIEW”, Modern Electronics Technique, Issue 14, pp. 173-175, 2011.
[13]Gilbert-Rainer Gillich, Doina Frunzaverde, Nicoleta Gillich, Daniel Amariei, „The use of virtual instruments in engineering education”, WCES-2010, Procedia Social and Behavioral Sciences, Vol. 2, Issue 2, pp. 3806-3810, 2010.
[14]Wen-Hsuan Kuan, Chi-Hung Tseng, Sufen Chen, Ching-Chang Wong, „Development of a Computer-Assisted Instrumentation Curriculum for Physics Students: Using LabVIEW and Arduino Platform”, Journal of Science Education and Technology, Vol. 25, Issue 3, pp. 427-438, June 2016.